Hydrodynamic model atmospheres for WR stars:
We present the first non-LTE atmosphere models for WR stars that incorporate a self-consistent solution of the hydrodynamic equations. The models account for iron-group line-blanketing and clumping, and compute the hydrodynamic structure of a radiatively driven wind consistently with the non-LTE radiation transport in the co-moving frame. We construct a self-consistent wind model that reproduces all observed properties of an early-type WC star (WC5). We find that the WR-type mass-loss is initiated at high optical depth by the so-called ‘Hot Iron Bump’ opacities (Fe ix–xvi). The acceleration of the outer wind regions is performed by iron-group ions of lower excitation in combination with C and O. Consequently, the wind structure shows two acceleration regions, one close to the hydrostatic wind base in the optically thick part of the atmosphere, and another farther out in the wind. In addition to the radiative acceleration, the ‘Iron Bump’ opacities are responsible for an intense heating of deep atmospheric layers. We find that the observed narrow O vi-emissions in the optical spectra of WC stars originate from this region. By their dependence on the clumping factor we gain important information about the location where the density inhomogeneities in WR-winds start to develop.
Key Words.:
Stars: Wolf-Rayet – Stars: early-type – Stars: atmospheres – Stars: mass-loss – Stars: winds, outflows – Stars: individual: WR 1111 Introduction
The modeling of the atmospheres of Wolf-Rayet (WR) stars with their strong stellar winds underwent a strong development during the last two decades. Starting with pure-helium atmospheres (Hillier 1987a, b; Hamann & Schmutz 1987), the main goal was to augment the models by more complex atoms like C, N, and O (e.g. Hillier 1989; Koesterke & Hamann 1995), until a major step towards a realistic determination of stellar parameters and emergent flux distributions was performed by the inclusion of iron-group line-blanketing (Hillier & Miller 1998, 1999; Gräfener et al. 2002) and clumping (see Hamann & Koesterke 1998).
For the inclusion of line-blanketing major revisions of the model codes were necessary. In line-blanketed models the whole spectral range is covered by millions of overlapping lines. Due to the frequency coupling in expanding atmospheres, no sampling or re-ordering techniques can be applied (cf. the technique of opacity distribution functions, e.g. Carbon 1979), i.e., the complete radiation field must be calculated on a fine frequency grid, with each line transition at its proper place.
As a by-product of these numerically expensive calculations also the radiative acceleration on the wind material is obtained. This is of special interest for WR stars, because it is not clear whether their strong winds can be driven by radiation pressure alone. In contrast to the thin winds of OB stars, WR winds show wind momenta far above the single scattering limit . This means that, on average, each photon leaving the star must be scattered several times to accelerate the wind to the observed terminal velocities.
The first results from line-blanketed atmosphere calculations have shown that the acceleration of the outer part of a WR wind is easily explained by radiative driving, whereas the models failed completely in the deeper layers where the mass-loss is initiated (Gräfener et al. 2000; Herald et al. 2001; Gräfener et al. 2002; Hillier 2003). On the other hand, Nugis & Lamers (2002) and Lamers & Nugis (2002) demonstrated by a critical-point analysis that the mass-loss rates of WR stars can probably be maintained, if the critical point of the equation of motion is located in the optically thick part of the atmosphere at a temperature close to 160 kK. In this case the mass-loss is initiated by the so-called ‘Hot Iron Bump’ – an increase of the Rosseland mean opacity, which is mainly due to the excitation of the Fe M-shell ions (Fe ix–xvi). Due to their method of analysis, however, it remained unclear whether the assumed conditions are actually met in WR atmospheres, and if the wind can be further accelerated beyond the optically thick regime.
Due to their high wind densities and their hard radiation field, WR stars develop extended atmospheres in extreme non-LTE that require sophisticated modeling techniques. Their complex ionization structure is strongly affected by the interplay between different elements (see Gräfener et al. 2002). It is therefore necessary to employ a full non-LTE treatment and a radiation transport that correctly accounts for line-overlaps. Moreover, WR winds show high velocities at large optical depths, i.e., complete atmosphere models including an accurate solution of the temperature structure are required. The numerical cost of our present models is therefore much higher than for already existent stellar wind models (e.g. Castor et al. 1975; Abbott & Lucy 1985; Pauldrach et al. 1986; Lucy & Abbott 1993; Schaerer & Schmutz 1994; Pauldrach et al. 1994; Vink et al. 1999; Pauldrach et al. 2001; Krtička & Kubát 2004) which are mostly focusing on the thin winds of OB stars.
An additional important aspect for the driving of WR winds, which is not included in any of the previous wind models, is the role of density inhomogeneities. For WR stars, these are directly observed as time-dependent variations of the line profiles (Lépine & Moffat 1999; Lépine et al. 1999, 2000; Koesterke et al. 2001). They are included in our models in the form of a clumping factor , which lowers the empirically derived mass-loss rates by a factor (see Hamann & Koesterke 1998), i.e., it reduces the wind momentum problem for WR stars. Typically, values in the range of = 4–10 are obtained by a fit of the electron scattering wings of strong emission lines. An effect of similar importance is the influence of clumping on the radiative acceleration of the wind material. This effect was discussed for the first time by Schmutz (1995) and Schmutz (1997) and is also detected in our models (Gräfener & Hamann 2003). The clumping factor therefore plays a key role for the dynamics of WR winds.
For the modeling of OB star winds, two main approaches are presently followed. In the first one, all atomic populations are calculated in non-LTE (i.e., the statistical equilibrium equations are exactly solved) and the radiation field is treated in Sobolev approximation (Pauldrach et al. 2001; Krtička & Kubát 2004). In the second, a Monte-Carlo technique is employed for the radiation transfer which particularly accounts for multiple scattering effects due to line-overlaps. The atomic populations of the iron-group elements, however, are treated in a modified nebular approximation (Vink et al. 1999). As mentioned above, both methods are probably not suitable for the modeling of WR winds, because the spectrum formation in WR stars is dominated by non-LTE effects and line-overlaps. Despite of the approximations concerning the atomic populations, all spectral lines are treated as pure scattering opacities in the Monte-Carlo approach, i.e., they do not allow for photon leakage from one part of the spectrum to another (see Owocki & Gayley 1999; Sim 2004). This situation may be improved by the new technique of Lucy (2002, 2003). The Sobolev approach, on the other hand, introduces an artificial distinction between ‘line radiation’ and ‘background continuum radiation’ that causes problems in case of line overlaps. A correction of the continuum radiation field is therefore necessary (see Pauldrach et al. 1994). In addition, the first order Sobolev approximation breaks down in the acceleration region near the transsonic wind base – even for thin stellar winds (Sellmaier et al. 1993; Owocki & Puls 1999).
The hydrodynamic structure of O star winds was obtained for the first time by Castor et al. (1975, later on CAK), who employed a parametrization of the radiative acceleration by means of the so-called force multiplier function. This method has been significantly improved by Pauldrach et al. (1986) and describes successfully the observed properties of OB star winds (except for dense winds where multiple scattering effects become important, see Lamers & Leitherer 1993; Puls et al. 1996; Vink et al. 2000). However, due to the parametrization by only two parameters, the line force is subject to an averaging process, i.e., the hydrodynamic equations are not strictly solved. Again, for the highly structured winds of WR stars, this approach is probably not sufficient. The Monte-Carlo models by Vink et al. (1999) are based on an even less accurate method where a consistent global energy budget is provided for a prescribed velocity field. Krtička & Kubát (2004) have recently improved this situation by a full local solution of the equation of motion and the energy equation, i.e., their models provide a consistent velocity and temperature structure. Nevertheless, due to the neglect of multiple scatterings, these models are limited to weaker winds.
In the present work we overcome the problems explained above by combining full non-LTE atmosphere models with the equations of hydrodynamics. By iteration between the non-LTE radiation transport and the hydrodynamics we derive , , , and the non-LTE population numbers consistently with the radiation field in the co-moving frame (CMF), i.e., we solve the radiation transport, the energy equation, and the equation of motion simultaneously. Moreover, clumping is accounted for. The resultant models describe the conditions in WR atmospheres correctly, and provide synthetic spectra, i.e., they allow for a direct comparison with observational material. Nevertheless, simplifying assumptions are necessary also in our models. These concern especially the assumption of a constant Doppler broadening velocity throughout the atmosphere and the omission of opacities, partly due to the neglect of trace elements like Ne, Ar, S, or P and partly due to incompleteness of the available data (for ions above ionization stage ix, no fine-structure data, and no atomic data for elements with are available).
As already mentioned above, the critical-point analysis by Nugis & Lamers (2002) revealed that the mass-loss of early-type WR stars is probably driven by the ‘Iron Opacity Bump’ which is mainly due to line opacities of the Fe M-shell ions (Fe ix–xvi). By inclusion of these ions in our models we are able to check whether the assumptions of Nugis & Lamers (critical point at high optical depth and high temperature) are correct, and most importantly, if the high wind acceleration can be maintained in the outer part of the wind.
In the Sect. 2 of the present work we review our standard atmosphere models, followed by a series of test calculations to clarify the role of the ‘Iron Bump’ opacities and the clumping factor (Sect. 3). Then we describe the combination of our atmosphere models with the hydrodynamic equations (Sect. 4), and present a self-consistent hydrodynamic atmosphere model that reproduces all observed characteristics of an early-type WC star. Finally, we summarize our conclusions in Sect. 6.
2 Model atmospheres
In the present section we give a short overview of our standard atmosphere models with prescribed wind structure, as they are routinely used for the spectral analysis of WR stars (Koesterke et al. 1992; Hamann et al. 1992; Leuenhagen & Hamann 1994; Koesterke & Hamann 1995; Leuenhagen et al. 1996; Hamann & Koesterke 1998; Koesterke et al. 2002; Gräfener et al. 2002; Hamann & Gräfener 2003). In Sect. 2.1 we describe the applied numerical methods, in Sect. 2.2 we review the relevant model parameters, and in Sect. 2.3 we summarize the atomic data utilized for the calculations.
2.1 Standard models
For our standard models we assume a spherically symmetric, stationary outflow with a prescribed density and velocity structure. The model code computes the radiation field, the atomic populations, and the temperature structure in the expanding atmosphere. The complete solution comprises three parts, which are iterated until consistency is obtained: The radiation transport, the statistical equilibrium equations, and the energy equation.
The radiation transport for the spherically expanding atmosphere is formulated in the co-moving frame of reference (CMF), neglecting aberration and advection terms (see Mihalas et al. 1976). For a fast solution and a consistent treatment of the scattering terms we employ the method of variable Eddington factors (Auer & Mihalas 1970). This means that the moment equations are solved to obtain the angle-averaged radiation field, and the numerically expensive ray-by-ray transfer is only calculated from time to time (Koesterke et al. 2002; Gräfener et al. 2002). The fast numerical solution allows a detailed treatment of millions of spectral lines on a fine frequency grid.
The atomic populations and the electron density are determined from the equations of statistical equilibrium. This system of equations is solved in line with the radiation transport by application of the ALI formalism (accelerated lambda iteration, see Hamann 1985, 1986). Complex model atoms of He, C, O, Si, and the iron-group are accounted for. For the inclusion of millions of iron-group transitions we take advantage of the concept of super-levels (see Gräfener et al. 2002). Furthermore, density inhomogeneities are accounted for by the assumption of small-scale clumps with a clumping factor (defined as the inverse of the volume filling factor , see Hamann & Koesterke 1998).
The temperature structure is obtained from the assumption of radiative equilibrium. In the present work this constraint equation is decoupled from the equations of statistical equilibrium. It is solved by a temperature correction procedure which is based on the Unsöld-Lucy method (Unsöld 1955; Lucy 1964), and has been generalized for the application in non-LTE models with spherical expansion (Hamann & Gräfener 2003).
2.2 Model parameters
The model atmospheres are specified by the luminosity and radius of the stellar core, the chemical composition of the envelope, and its density and velocity structure. The basic parameters are: The stellar core radius at Rosseland optical depth , the stellar temperature (related to the luminosity and the core radius via the Stefan Boltzmann law), the chemical composition, the clumping factor , and, if the atmosphere structure is not calculated self-consistently, the mass-loss rate and the terminal velocity . In the latter case, a -type velocity-law of the form is assumed, where denotes the transition point to the hydrostatic domain and is set to one.
At the start of the model calculation, when the density and velocity structure of the atmosphere are fixed, only the continuum opacities for LTE populations with a grey temperature structure are calculated. The value of , which specifies the inner boundary of our models, therefore denotes a ‘LTE-grey-continuum Rosseland optical depth’ of 20. The ‘true’ Rosseland optical depth, , of a converged non-LTE model with all line opacities included is usually much larger. In our present models (WC stars with solar Fe-abundance) values of are typically reached at the inner boundary.
Together with the density and velocity structure also the clumping factor is prescribed at the start of the model calculation. For realistic wind models it is however necessary to allow for a radial variation of . Especially for our intended hydrodynamic treatment a smooth wind-structure is favorable at large optical depth around and below the sonic point. The radial dependence is therefore specified in the following form. In the deep layers, where is greater than a specified value , a smooth wind with is assumed. Then the clumping factor is continuously increased until a fixed maximum value is reached at a specified optical depth . For , is kept constant. In the present work, the given values for refer to its maximum value with set to and to .
2.3 Atomic data
| Ion | Levels | Ion | Super-levels | Sub-levels | |
|---|---|---|---|---|---|
| He i | 17 | Fe ii | 1 | 1 | |
| He ii | 16 | Fe iii | 8 | 14188 | |
| He iii | 1 | Fe iv | 18 | 30122 | |
| C i | 2 | Fe v | 19 | 19804 | |
| C ii | 32 | Fe vi | 18 | 15155 | |
| C iii | 40 | Fe vii | 16 | 11867 | |
| C iv | 54 | Fe viii | 10 | 8669 | |
| C v | 1 | Fe ix | 11 | 12366 | |
| O ii | 3 | Fe x | 9 | 761 | |
| O iii | 33 | Fe xi | 9 | 1143 | |
| O iv | 25 | Fe xii | 9 | 894 | |
| O v | 36 | Fe xiii | 9 | 797 | |
| O vi | 15 | Fe xiv | 9 | 589 | |
| O vii | 1 | Fe xv | 7 | 253 | |
| Si iii | 10 | Fe xvi | 6 | 31 | |
| Si iv | 7 | Fe xvii | 1 | 1 | |
| Si v | 1 |
The chemical composition of the model atmospheres is given by mass fractions , , , and of helium, carbon, oxygen, silicon and iron-group elements. Compared to Gräfener et al. (2002) the atomic data are extended by the ions Fe x–xvii and by detailed photoionization cross sections for C and O that include dielectronic resonances. Two types of model atoms, with and without the extended iron model, are applied in the present work. The model atoms are summarized in Table 1. They contain ionization stages He i–He iii, C i–C v, O ii–O vii, Si iii–Si v, and Fe ii–Fe x or Fe ii–Fe xvii. Except for He i and Si iii, the lowest and highest ionization stages are restricted to few auxiliary levels.
The atomic level & line data are compiled from the following sources. Oscillator strengths are taken from the Opacity Project (Hummer & Mihalas 1988; Seaton 1987; Seaton et al. 1992; Cunto & Mendoza 1992; Seaton et al. 1994; The Opacity Project Team 1995), level energies from Kurucz’s CD-ROM No. 23 (Kurucz & Bell 1995), iron group data (ionization stages II–IX) from Kurucz CD-ROM No. 20–22 (see Kurucz 1991, 2002), and the iron M-shell data (Fe x–Fe xvii) from the Opacity Project. The iron-group elements from Sc to Ni are comprised into one generic atom. This model atom is of course dominated by Fe due its high relative abundance. The extension of the generic ion from the stages Fe x to Fe xvii is restricted to pure Fe because the Opacity Project does not provide data for elements with .
The emission line spectra of WR stars are chiefly formed in line emission cascades, which follow recombination to excited energy levels. A realistic treatment of photoionization and recombination processes is therefore mandatory. Especially for the ionization of carbon and oxygen ions C i–C iii and O i–O v, the excitation of auto-ionizing, dielectronic resonances close to the ionization edge provides an important reaction cannel. In our previous work, photoionization cross sections were obtained by low-order fits to Opacity Project data, and the dielectronic transitions were treated separately by the approach of Mihalas & Hummer (1973). This distinction between dielectronic and ‘pure’ photoionization processes is, however, highly questionable. The resonances actually form complex features on the total cross section, which cannot be eliminated by a fitting process. In the present work we avoid these problems by taking the ionization cross sections for C and O by Nahar & Pradhan (1997) and Nahar (1999) as they are, i.e., they are only smoothed with a Doppler profile. Effects like the successive saturation of the dielectronic features when a continuum becomes optically thick, are therefore modeled in a realistic manner. The numerical cost of this treatment is, however, rather high because the continuum opacities must be provided on a fine frequency grid to resolve the dielectronic features. Further disadvantages may be due to the slightly incorrect wavelengths in the data source. Moreover, the cross sections are only available in a form where the transitions from one lower level to several states of the upper ion are combined. Photoionizations therefore always lead into the ground state of the upper ion.
3 Test calculations
| Model | GKH02 | A,B | C | D | Hydro |
|---|---|---|---|---|---|
| 2.455 | 2.455 | 0.905 | 0.905 | 0.905 | |
| 85 | 85 | 140 | 140 | 140 | |
| 13.63 | 13.63 | 13.63 | 13.63 | 13.63 | |
| 4.132 | 3.683 | 1.358 | 1.358 | 1.210 | |
| 10 | 10 | 10 | 50 | 50 | |
| 2200 | 2020 | 2020 | 2020 | 2010 | |
| 0.51 | 0.33 | 0.33 | 0.33 | 0.33 | |
| 0.45 | 0.60 | 0.60 | 0.60 | 0.60 | |
| 0.04 | 0.06 | 0.06 | 0.06 | 0.06 | |
| 0.42 | 0.47 | 0.71 | 1.05 | 1.00 | |
| 4.83 | 4.87 | 4.87 | 2.17 | 2.54 |
As a preparation for our intended hydrodynamic modeling, we investigate in the present section the effect of the additional Fe opacities on the radiative acceleration, and determine the range of stellar parameters that actually allows to maintain a WR-type wind. For this purpose we employ models with a prescribed -type velocity law and similar parameters as the WC 5 prototype WR 111, which has already been analyzed in detail by Hillier & Miller (1999) and Gräfener et al. (2002). Although the modeling of WC stars is a rather complex task, these objects offer a good test case for our hydrodynamic models. Due to their almost homogeneous chemical composition their mass can be reliably derived from the theoretical mass-luminosity relation e.g. by Langer (1989), i.e., the number of free parameters is reduced by one.
In Sect. 3.1 we identify the line opacities of the Fe M-shell ions as the main contributors to the wind acceleration in deep atmospheric layers, and show that the WR-type mass-loss can only be maintained for rather high stellar core temperatures (around ). Furthermore, we point out the influence of the clumping factor on the radiative acceleration. In Sect. 3.2 we demonstrate the reaction of the optical O vi-features on the radial dependence of the clumping factor, and show that they are a possible diagnostic tool for the location where the wind clumping sets in.
3.1 The effect of the Fe M-shell opacities
To investigate the effect of the additional Fe opacities we start with a similar model (i.e. with similar parameters and atomic data) as in our previous analysis of WR 111 (Gräfener et al. 2002). The model parameters are adapted in a way to facilitate the intended hydrodynamic treatment (slightly higher C and O abundances) and to allow for an easy comparison to the final model in Sect. 5 (). Moreover, the mass-loss rate is adjusted to reproduce the observed C iii/C iv line strengths. Note that the effective wind density is enhanced in our present models due to the improved treatment of dielectronic recombination (see Sect. 2.3). In Table 2, the parameters of this first test model (Model A) are listed together with the values previously derived for WR 111 (GKH02).
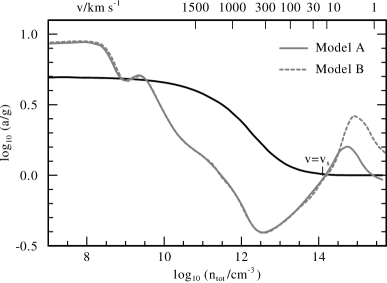
The radiative acceleration as obtained from Model A is shown in Fig. 1. It is compared to the wind acceleration according to the prescribed -type velocity law. In analogy to previous works (Gräfener et al. 2000; Herald et al. 2001; Gräfener et al. 2002; Hillier 2003), the obtained radiative force exceeds the force needed to accelerate the wind in the outer layers, but fails at large optical depth where the mass-loss is initiated. For the work ratio between the work performed by the radiation field and the gas expansion on the wind material
| (1) |
and the prescribed mechanical wind luminosity
| (2) |
we obtain a value of , i.e. the model provides about half of the global energy budget of the wind.
The reason for the lack of force in the acceleration region becomes obvious when the atomic populations of Model A are inspected. The top panel of Fig. 3 shows the Fe-ionization structure of Model A (black). In the inner part of the atmosphere, Fe is ionized up to the highest ionization stage considered in the model atom, i.e., in this region only opacities from subordinate levels contribute to the radiative force. The lack of force may therefore be attributed to a lack of sufficiently high ionization stages considered in the model atom. For C and O the situation is similar, however, these elements are complete up to their He-like ions. Fe is only considered up to the second M-shell ion, Fe x. Because the ionization potentials of the M-shell ions are increasing only in small steps from 236 eV for Fe ix to 489 eV for Fe xvi before a big step of 1266 eV follows for Fe xvii, one may expect that at least a few more M-shell ions could be excited if they were present in the model atom.
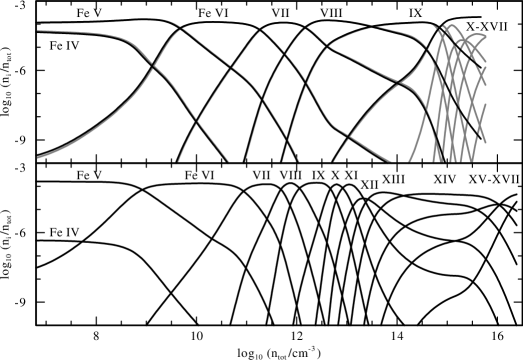
That this is indeed the case is indicated by the grey curves in Fig. 3. They show the populations of Model B which has the same parameters as Model A but an extended model atom, including all M-shell ions up to Fe xvii (see Table 1). In this model, ions up to Fe xiv are excited. However, an inspection of Fig. 1 shows that the radiative force due to the additional ions does not solve our problem with the wind acceleration. is only increased in the hydrostatic layers, where it now considerably exceeds the gravitational attraction, i.e., no hydrostatic equilibrium is possible anymore. The deficit in the acceleration region remains.
The apparent solution of this problem is an increase of , to push the temperature regime where the M-shell ions are excited farther out into the acceleration region of the wind. For a typical WC model, the emergent spectrum is only marginally changed by this operation because the continuum becomes optically thick already at high wind velocities, i.e., the location of the photosphere is determined by the velocity structure of the wind rather than the size of the stellar core (see Hamann et al. 2003). In the deeper layers however, where our problem with the radiative acceleration occurs, the temperature scales with and the ionization structure may be changed considerably.
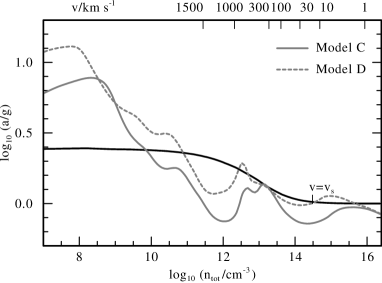
In the lower panel of Fig. 3 we show the Fe-populations of Model C where the stellar radius has been correspondingly decreased so that . It is clearly visible that the bulk of the M-shell ions is now shifted towards much lower densities, and ions up to Fe xvi are exited. As demonstrated in Fig. 2, the radiative acceleration on these ions works exactly in the intended way, and fills the previous gap in the acceleration region. Moreover, the work ratio of this model has improved to a value of 0.71. Nevertheless, below and directly above the apparent opacity bump, the radiative acceleration still lies slightly below the gravitational attraction. Whereas the deficit in the deeper layers, below , would be balanced by the gas pressure in a hydrodynamic model, the lack of force around , would presumably remain. The latter, however, is located so far outside in the wind that changes in the recombination rates due to clumping can considerably affect the wind dynamics.
This is demonstrated by Model D in Fig. 2, where the clumping factor has been increased from to a value of . The mass-loss rate has been correspondingly reduced by a factor of in order to maintain the transformed radius and thereby the strength of the emergent emission line radiation (see Sect. 2.2). For this model a work ratio of 1.05 is obtained, i.e., it has a nearly consistent global energy budget. With respect to Model C, the radiative acceleration is partially enhanced by up to 0.3 dex. The influence of the clumping factor and its exact dependence on the radius is therefore crucial for the dynamics of WR winds.
The lack of force in Model C is presumably due to the omission of trace elements like Si, P, S, Ne, and especially Ar in our calculations (see Hillier 2003), i.e., the high clumping factors in Model D are possibly only needed as a compensation for this deficit. Nevertheless, we use Model D as the start model for our hydrodynamic modeling in Sect. 5, and admit that we might overestimate the clumping factor in order to achieve a consistent solution.
Interestingly, with an electron temperature of – in the acceleration region, our Model D basically matches the conditions claimed by Nugis & Lamers (2002) for the initiation of an optically thick wind. However, our models indicate that the acceleration of the wind above the sonic point is only possible for very high core temperatures of . This is in contradiction to Nugis & Lamers who assumed much larger radii, in accordance with current spectral analyses (see also Lamers & Nugis 2002). These typically provide values of (Koesterke & Hamann 1995; Gräfener et al. 1998, 2002; Crowther et al. 2002). Our present value, on the other hand, is in accordance with stellar structure calculations which also show high core temperatures (120–130 kK, see Langer 1989; Schaerer 1996). This may imply that, due to the obscuration of the stellar core by the wind opacity, spectral analyses tend to overestimate the stellar radius, i.e., the large derived radii do actually reflect a very extended wind-structure rather than a large core size.
3.2 The radial dependence of the clumping factor
As explained in Sect. 2.2, the radial dependence of the clumping factor is fixed at the start of our model calculations. For the models in Sects. 3.1 and 5, the clumping factor is assumed to increase from a homogeneous wind () for optical depths larger than to a specified value ( or 50) for optical depths smaller than . As demonstrated in the previous section, clumping has a strong impact on the radiative acceleration, i.e., the results of our hydrodynamic modeling will depend on the detailed choice of and .
For a justification of our present choice we have calculated test models similar to Model D but with different values of and . For Model D1 the clumping factor is assumed to be constant throughout the atmosphere, whereas for Model D2, and have been decreased (, ) so that the onset of clumping is pushed farther out in the wind.
In the emergent spectrum these changes especially show up in the narrow O vi-doublet at 3811/34 Å. In previous works (e.g. Hillier & Miller 1999; Gräfener et al. 2002; Crowther et al. 2002) these lines could not be reproduced, which is remarkable because of the relatively simple structure of the O vi ion. That we are now able to reproduce O vi features of the observed strength is due to the combination of the high stellar temperature and the additional blanketing by the Fe M-shell opacities. O vi consequently helps to trace regions relatively deep inside the envelope at temperatures around 100 kK.

As demonstrated in Fig. 4, O vi 3811 reacts strongly on the performed changes of the clumping factor. In our test, Model D shows slightly stronger emissions than observed. Model D1, which is fully clumped, provides much weaker lines, whereas for Model D2, where the clumping sets in farther out, not only O vi is enhanced, but also the flux level of the continuum is affected. Although the strength of the O vi lines will depend on the final model parameters (see next section), the present test shows that O vi is a good diagnostic tool for the clumping structure in deep atmospheric layers.
4 The wind hydrodynamics
In this section we describe the combination of our model atmospheres with the equations of hydrodynamics. The resultant atmosphere models provide a self-consistent wind structure, i.e., for given stellar core parameters the non-LTE population numbers and the atmosphere structure are derived consistently with the radiation field in the co-moving frame of reference (CMF). The solution is obtained by iteration between the non-LTE radiation transport and the hydrodynamics. Thereby, the numerical effort is considerably enhanced with respect to the standard models. In Sect. 4.1 we discuss the parametrization of the radiative acceleration, which forms the link between the radiation transport and the hydrodynamics. The solution of the hydrodynamic equations is explained in Sect. 4.2.
4.1 The radiative acceleration
From the solution of the moment equations in the radiation transport, we obtain the Eddington flux on a fine frequency grid in the CMF. In combination with the opacity , which is given on the same grid, it is thus possible to derive the radiative acceleration on the wind material by direct integration
| (3) |
Due to Doppler shifts, however, the radiative acceleration on spectral lines depends strongly on the velocity gradient . The radiative-acoustic wave modes arising from this dependence are changing the characteristic properties of the gas flow (Abbott 1980). For the application in our hydrodynamics it is therefore necessary to find a suitable parametrization of which accounts for this effect.
In the CAK approach (Castor et al. 1975) the acceleration on spectral lines is written in the form
| (4) |
where we have used our own definition . In this formulation the parameter reflects the distribution of line strengths in the relevant wavelength range, and is usually found to be in the range 0.6–0.7. In contrast to this, the radiative acceleration in our models, as calculated from Eq. (3), cannot be described by two parameters. To obtain consistent wind models we have to allow for depth dependent parameters and . By this, however, the solution topology due to the non-linearity in becomes much more complicated. To avoid numerical problems we therefore utilize a linearized form of Eq. (4) in our calculations.
Let us first assume that is given for a fixed velocity field . Then a first order expansion of Eq. (4) with respect to gives
| (5) |
Here the first term behaves as expected for optically thin lines (note that is fixed), and the second term reflects the behavior of optically thick lines due to Doppler shifts, i.e., the parameter indicates the fraction of the line force which is due to optically thick lines (see Gayley 1995; Puls et al. 2000).
For a realistic representation in the hydrodynamics, from Eq. (3) must be disentangled into its different contributions. As a first step, the line acceleration must be separated from the acceleration on continua . Then the ratio between optically thin and optically thick lines must be determined, so that can be written as . and correspond to the first and second term in Eq. (5), i.e., they must be parametrized in a form where and . Because the acceleration on continua is also independent from the velocity gradient, can be treated analogously to . Finally, can be written in the form
| (6) |
where includes the contributions from continua and optically thin lines, and describes the contribution from optically thick lines.
The first step, the separation of and , is easily done by dividing the total opacity under the integral in Eq. (3) into the parts due to continua and lines only. Then the dependence of on is investigated to determine and . For this purpose the velocity field in the radiation transport is varied, i.e., the radiation field is calculated twice for the same density structure and the same atomic populations but for different velocity distributions . In practice, a variation of 10% is applied to and . The variation of then causes changes in the derived value of and the total radiative flux. After normalizing the result with respect to the flux, we obtain a measure for the reaction of on the variation of alone. Now the fraction of the line force due to optically thick lines (which is equivalent to the force multiplier parameter ) can be calculated directly from Eq. (5) for each depth index.
The physical meaning of derived on this way is different from the standard approach, where is interpreted as a characteristic material property due to the distribution of line strengths. The value derived here is an effective value which reflects the reaction of on including all important radiative effects like multiple scattering, line overlaps, ionization effects, the exact angle-dependence of the radiation field, or the shortening of the photon mean free path at large optical depth, which also have partly been introduced in the standard CAK approach (see Abbott 1982; Pauldrach et al. 1986; Puls et al. 2000).
The parametrization of in Eq. (6) is fundamentally different from the CAK approach (Eq. 4) which is non-linear in . Our linearization helps to avoid numerical problems due to multiple solutions. However, in the CAK approach the non-linearity is prerequisite for the self-consistent calculation of the mass-loss rate. For our present calculations, we therefore need an additional constraint. Because and are continuously updated, the overall nonlinear behavior of the line force is nevertheless retained during the iterative solution.
4.2 Solution of the hydrodynamic equations
The self-consistent hydrodynamic atmosphere models are obtained by iteration between the non-LTE radiation transport as described in Sect. 2.1, and the solution of the hydrodynamic equations. The radiation transport provides the radiative acceleration according to Eq. (6) and the temperature structure, namely , , and . Based on this, a hydrodynamic solution for the density and velocity structure, and , is obtained. and are then fed back into the radiation transport, and the procedure is repeated until convergence.
As already indicated above, as well as and are fixed on the -grid, where is given by our simple definition from Eq. (4). By this, the energy equation is implicitly included in the hydrodynamics (at large optical depth is coupled to ). This is particularly important for the optically thick winds of WR stars where a violation of radiative equilibrium results in extreme deviations from flux constancy, which would spoil the whole iteration process.
To maintain radiative equilibrium it is further necessary that the total optical depth of the atmosphere remains unchanged when a new hydrodynamic structure is calculated. As explained in the following, this additional constraint is exactly what we need to close the system of hydrodynamic equations, i.e., by the inclusion of the energy equation we gain the additional constraint which is required due to our linearization of with respect to . We incorporate the conservation of optical depth into the hydrodynamics by choosing as the integration variable. Due to our simple definition of , however, we neglect the the actual -dependence of flux-mean opacity. Nevertheless, this approach turned out to be numerically stable and efficient enough for our purposes.
With from Eq. (6), the equation of motion for a stationary, spherically expanding gas flow reads
| (7) |
where denotes the stellar mass, the gravitational constant, the gas density, and the gas pressure. Formulating in terms of the isothermal sound speed , replacing by , and applying the equation of continuity
| (8) |
we obtain the equation of motion in the form
| (9) |
where , , and are taken from the preceding non-LTE model calculation. This equation must be solved in line with which is given by our definition of
| (10) |
For given boundary values and , and a given mass-loss rate , Eqs. (9) and (10) can be integrated directly over . The outer boundary of our model atmosphere is located at a prescribed radius . At this point can be arbitrarily set to . The inner boundary value at the stellar core radius is taken from the previous non-LTE solution. By these two conditions, namely and , we ensure that the optical depth of our atmosphere model is conserved. A third condition is obtained at the critical point of the equation of motion, where the term in square brackets in Eq. (9) becomes zero. In analogy to the CAK approach, this point marks the position where the flow speed reaches the value of the fast radiative-acoustic wave mode (Abbott 1980). At this point also the right hand side of Eq. (9) must be zero for to be defined.
After all we have three conditions to obtain two boundary values and , and the mass-loss rate . For the starting point of the numerical integration we choose the outer boundary, which is located at radius with . By this, the first of our three conditions () is fulfilled, and the values and remain to be determined. As start values for and we take the values from the previous model iteration. Then the numerical integration of Eqs. (9) and (10) is performed, until the critical point is reached. If the critical condition is not fulfilled, is adjusted and the integration is repeated until this is the case. Now the numerical integration can be continued through the critical point to the inner boundary at , where our last condition must be fulfilled. This is achieved by an adjustment of , and repetition of the previous procedure until .
Instead of using a pure numerical algorithm we employ relatively simple rules for the adjustment of and . At the critical point, the new value for can be read off directly from Eq. (9). , on the other hand, can be adjusted by the well-known result from the CAK theory that the terminal velocity of a radiatively driven wind scales with the escape velocity at the stellar surface, i.e., if we scale the terminal velocity by .
The numerical integration is performed by a simple Runge-Kutta scheme with adaptive step-size control. Here especially the calculation of from Eq. (9) is affected by numerical difficulties. The resolution of the model grid in our non-LTE models (typically 70 depth points) is much lower than what is needed for the integration of the hydrodynamic equations. For the extraction of , , and it is thus necessary to employ an interpolation algorithm which provides smooth functions with well-defined derivatives. We use the monotonic spline-interpolation by Steffen (1990) for this purpose. Further difficulties occur when the critical point is approached, where Eq. (9), which has the form , has a singularity with and . Close to this point it is necessary to apply the rule of de l’Hopital for the calculation of .
In practice, the wind structure is iterated until changes in the mass-loss rate are obtained, which is typically the case after 15–30 iterations between non-LTE radiation transfer and hydrodynamics. The demands on the numerical accuracy of the non-LTE solution are extremely high. Already small deviations from radiative equilibrium can have fatal consequences, because the critical point reacts very sensitively on changes of the radiative flux. An accuracy better than 0.01% is therefore mandatory for the flux-level. Because of this, the non-LTE solution alone requires a computation time of the order of one day on a current personal computer, and a hydrodynamic model like the one presented in Sect. 5 takes a pure calculation time of the order of one month.
5 Self-consistent modeling of a WC star wind
In this section we apply the hydrodynamic treatment described in Sect. 4.2, and present a self-consistent atmosphere model for an early-type WC star. The ‘input’ parameters for the hydrodynamic model are the same as for our test model D in Sect. 3. Moreover, we assume a stellar mass of according to the mass-luminosity relation by Langer (1989). The clumping structure is prescribed in the same way as for our previous calculations, i.e., is related to the LTE-continuum optical depth (see Sect. 2.2) which is now updated after each iteration.
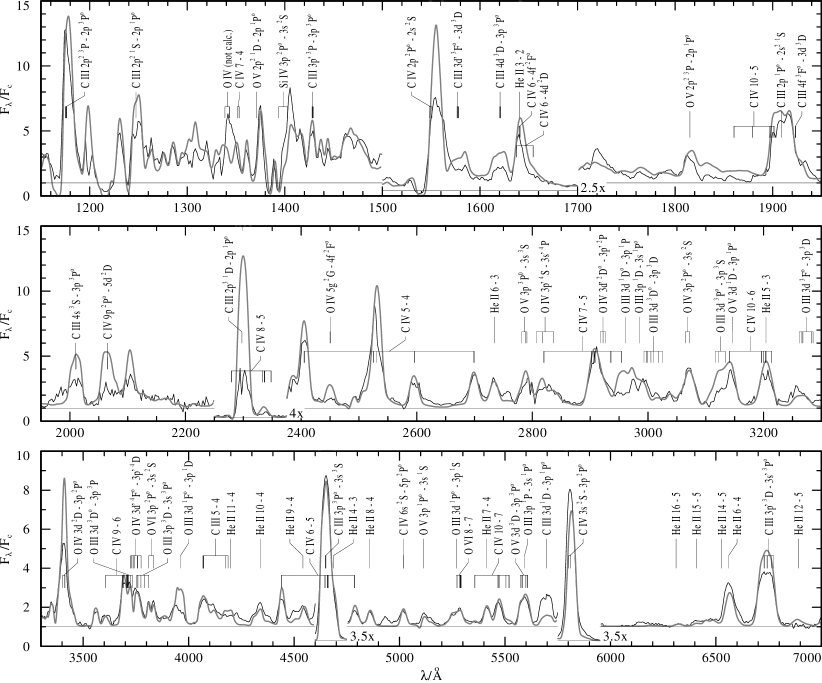
The converged model nicely reproduces the observed parameters of a typical WC star (see Table 2, ‘Hydro’). The obtained mass-loss rate is only slightly higher than the value adopted for Model D, and the resultant terminal velocity is very close to the canonical value of 2000 km/s. In Figs. 7 and 8 the synthetic spectrum is compared to the observed spectrum of WR 111. Although the fit quality would not be sufficient for a detailed analysis, the model clearly displays the spectral characteristics of an early-type WC star. Moreover, the successful reproduction of O vi 3811/38 supports our assumptions concerning the radial dependence of the clumping factor (see previous section), although the electron scattering wings of C iv 5805 indicate that the assumed maximum value of is probably too high.
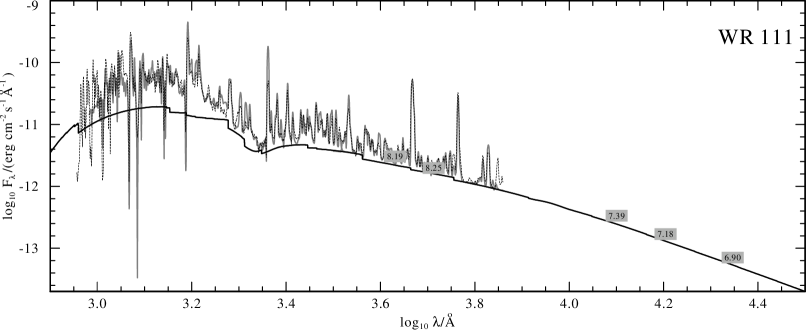
Further discrepancies are mainly due to the modified model parameters in comparison to our previous analysis of WR 111 (Gräfener et al. 2002). Due to the high assumed carbon abundance, many carbon lines appear too strong. Moreover, the emergent flux distribution is slightly changed, which results in a smaller required correction for interstellar extinction ( compared to the previous value of ). In the present work, the model flux must therefore be scaled down to match the observed flux distribution of WR 111. A comparison of the emergent flux distributions is shown in Fig. 8, where the model flux has been reduced by 0.18 dex and a distance of () is adopted for WR 111.
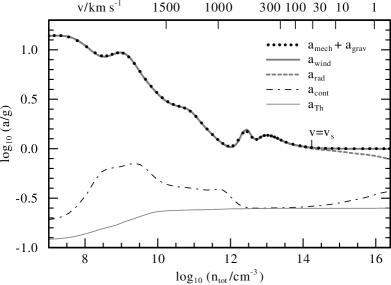
The wind acceleration of our self-consistent model is shown in Fig. 5. A precise agreement between the mechanical + gravitational acceleration (black dots) and the acceleration due to radiation and gas pressure (grey, in the background) is obtained. Note that the wind shows two acceleration regions, one in the optically thick part below a velocity of 900 km/s, and one in the outer part of the wind. These two zones reflect the influence of the two well-known opacity bumps, which are responsible for a variety of phenomena in stellar physics (see Rogers & Iglesias 1998; Nugis & Lamers 2002). In the present case, both opacity bumps are located beyond the sonic point and thus contribute to the acceleration of the wind.
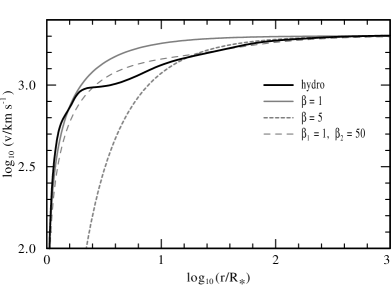
In Fig. 6, the resulting velocity structure is compared to -type velocity laws with and , and a double- law as proposed by Hillier & Miller (1999) (, , , and ). Clearly, none of the -laws is able to describe the overall structure of the hydrodynamic model exactly. The strong acceleration in the inner part is best described by whereas the outer part tends towards higher , in accordance with Lépine & Moffat (1999) who deduced high values () for the outer wind region from variations in emission line-profiles. The best match, especially for the asymptotic behavior at large radii, is indeed provided by Hillier & Miller’s double- law.
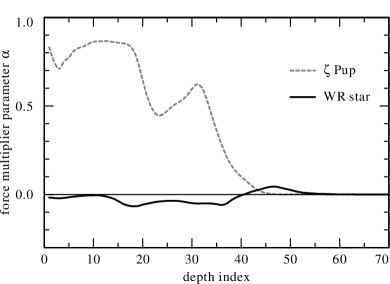
For the parametrization of the line force in the hydrodynamics, the effective force multiplier parameter is calculated within our radiation transport (see Eq. 4). In the standard picture, denotes the fraction of the line force which is due to optically thick lines, i.e., the fraction which reacts linearly on changes of . As demonstrated in Fig. 9, we obtain values for our WR model of throughout the whole atmosphere. This implies that the dependence of the line force on the velocity gradient is very small and sometimes even shows the opposite behavior as expected (i.e. the line force decreases for increasing ). The displayed O star model, in contrast, shows the expected behavior with in the outer wind regions, and at large optical depth. The abnormal values do presumably not reflect the original distribution of line strengths. Instead, the effective value of is probably influenced by complex radiative processes like line emission cascades due to recombination in the outer wind regions or extreme line overlaps. Hence our results indicate the total breakdown of the CAK theory for WR winds, even in the outer wind regions.
Concerning the driving mechanism of the wind, our models are in qualitative agreement with the ideas of Nugis & Lamers (2002). The critical point of the equation of motion (at ) is indeed located very close to the sonic point (at ) in the optically thick part of the envelope, below the iron opacity peak where the Rosseland mean opacity is increasing with radius. The radiative acceleration on the iron opacities overruns the gravitational attraction close to the sonic radius (see also Nugis & Lamers 2002, Sect. 4.1), i.e., the star crosses the Eddington limit at this point and thereby initiates the mass loss.
The detailed structure of our present model, however, shows significant differences to the results of Nugis & Lamers for WR 111. This is basically due to the high value Nugis & Lamers adopted for the stellar radius (corresponding to kK, see Lamers & Nugis 2002). Because Nugis & Lamers only analyze the sonic point, and assume that the wind is radiatively driven in the outer regions, they obtain solutions for a relatively wide range of . Our test calculations, in contrast, indicate that for ‘cool’ around the radiative force is not sufficient to maintain the WR-type mass-loss beyond the sonic point (see Model B in Sect. 3). For our ‘hot’ models with this situation improves. Consequently, as the temperature gradient increases proportional to , we obtain higher temperatures at smaller optical depths. The sonic point in our hydrodynamic model is therefore located at a relatively small flux-mean optical depth of and a high temperature of , compared to the models by Nugis & Lamers where – and –.
In our hydrodynamic models the mass-loss rate is chiefly determined by the temperature-dependence of the Rosseland mean opacity. An increase of the wind density heats up the deeper layers and pushes the opacity bump, and therefore also the sonic point, towards lower densities. Consequently, the mass-loss rate is decreased, i.e. the wind is stabilized. This regulation mechanism is most effective in parameter ranges where the ionization structure is sensitive to changes in the mass-loss. This is probably the reason why the WR models in spectral analyses tend to lie in regions where the ionization is just changing (i.e. the models are most difficult to calculate).
Another important question is how our results fit to the predicted properties of stellar structure models (e.g. Langer 1989; Schaerer 1996). An inspection of Figs. 4 and 5 in the work of Schaerer (1996) shows that our sonic-point temperature of is already reached relatively deep inside the star at around . Moreover, this point is located within the outer convection zone of the star, which is also caused by the iron opacity bump in these models. This implies that the convection zone in stellar structure calculations may possibly be identified with the acceleration zone of the WR wind, which then would be located at a rather small radius. However, for exact predictions stellar structure models are needed that take realistic wind models as an outer boundary condition, and allow for convection under dynamical conditions.
6 Conclusions
In the present work we have constructed the first hydrodynamically consistent model for a WR-type (WC 5) stellar wind, driven by radiation pressure. For this purpose we have combined our non-LTE atmosphere models with the hydrodynamic equations. On this way we obtain the first models for radiatively driven winds that incorporate a full non-LTE radiation transfer in the CMF, i.e., they allow for a realistic treatment of all important radiative effects throughout the whole atmosphere, including large optical depths. Moreover, the models account for the important effects of clumping.
By inclusion of the Fe M-shell ions (Fe ix–Fe xvi) in our models, the radiative acceleration in deep atmospheric layers is considerably enhanced. We show that, for suitable stellar parameters, the radiative force on these opacities is able to drive an optically thick wind. In particular, very high stellar temperatures () are needed to maintain the wind acceleration above the sonic point. In accordance with Nugis & Lamers (2002), the sonic point in our hydrodynamic model is located at large optical depth below the ‘Hot Iron Bump’ at a very high temperature of . The resultant wind structure shows two acceleration regions. A steep velocity increase in deep atmospheric layers due to the Fe M-shell ions, and a shallow increase in the outer part of the wind due to iron-group ions of lower excitation in combination with C and O. The latter is in accordance with the shallow velocity laws deduced by Lépine & Moffat (1999) from line-profile variations.
Despite of the fact that the wind is optically thick at the sonic point, we find strong deviations from the standard CAK theory also in the outer wind regions. Here especially the reaction of the radiative force on changes of shows an abnormal behavior, which is presumably due to complex radiative processes like line emission cascades after recombination, or extreme line overlaps. Moreover, we find a strong dependence of the radiative force on wind clumping, an effect which is neglected in previous models for radiatively driven winds.
The emergent flux, as calculated from our hydrodynamic model, clearly shows the spectral characteristics of an early-type WC star, i.e., the wind density and the terminal wind velocity, which are both obtained self-consistently from the hydrodynamics, are of the correct order of magnitude. Moreover, we are able to reproduce the observed narrow O vi emissions in the optical spectrum of WC stars. These features are excited by a combination of heating due to the Fe M-shell ions and the high stellar temperature, which is necessary for our wind modeling. The O vi lines also react very sensitively on the detailed clumping structure, i.e., they help to trace deep atmospheric layers where the clumping of WC star winds sets in.
When our results are compared to stellar structure calculations, the question about the location of the ‘surface’ of a WR star gains more and more in importance. Stellar structure models for WR stars show an outer convection zone, which largely determines the extension of the stellar envelope. The convection however, is caused by the same increase of the mean opacity that causes the driving of the WR wind in our models. A temperature around 200 kK, corresponding to our sonic-point temperature, is only reached deep inside the stellar envelope at the bottom of the outer convection zone. For a full understanding of the structure and the mass-loss of WR stars models are therefore needed, that combine stellar structure and atmosphere calculations and allow for convection under dynamic conditions.
Acknowledgements.
This work was partly supported by the Deutsche Agentur für Raumfahrtangelegenheiten under grant DARA 50 OR 0008 and partly by the Swiss National Science Foundation.References
- Abbott (1980) Abbott, D. C. 1980, ApJ, 242, 1183
- Abbott (1982) Abbott, D. C. 1982, ApJ, 259, 282
- Abbott & Lucy (1985) Abbott, D. C. & Lucy, L. B. 1985, ApJ, 288, 679
- Auer & Mihalas (1970) Auer, L. H. & Mihalas, D. 1970, MNRAS, 149, 65
- Carbon (1979) Carbon, D. 1979, ARA&A, 17, 513
- Castor et al. (1975) Castor, J. I., Abbott, D. C., & Klein, R. I. 1975, ApJ, 195, 157
- Crowther et al. (2002) Crowther, P. A., Dessart, L., Hillier, D. J., Abbott, J. B., & Fullerton, A. W. 2002, A&A, 392, 653
- Cunto & Mendoza (1992) Cunto, W. & Mendoza, C. 1992, Rev. Mex. Astron. Astrofis., 23, 107
- Gayley (1995) Gayley, K. G. 1995, ApJ, 454, 410
- Gräfener & Hamann (2003) Gräfener, G. & Hamann, W.-R. 2003, in IAU Symp., Vol. 212, A Massive Star Odyssey: From Main Sequence to Supernova, ed. K. A. van der Hucht, A. Herrero, & E. César (San Francisco: ASP), 190
- Gräfener et al. (1998) Gräfener, G., Hamann, W.-R., Hillier, D. J., & Koesterke, L. 1998, A&A, 329, 190
- Gräfener et al. (2000) Gräfener, G., Hamann, W.-R., & Koesterke, L. 2000, in ASP Conf. Ser., Vol. 204, Thermal and Ionization Aspects of Flows from Hot Stars, ed. H. J. G. L. M. Lamers & A. Sapar (San Francisco: ASP), 215
- Gräfener et al. (2002) Gräfener, G., Koesterke, L., & Hamann, W.-R. 2002, A&A, 387, 244
- Hamann (1985) Hamann, W.-R. 1985, A&A, 148, 364
- Hamann (1986) Hamann, W.-R. 1986, A&A, 160, 347
- Hamann et al. (2003) Hamann, W.-R., Gräfener, G., & Koesterke, L. 2003, in IAU Symp., Vol. 212, A Massive Star Odyssey: From Main Sequence to Supernova, ed. K. A. van der Hucht, A. Herrero, & E. César (San Francisco: ASP), 198
- Hamann & Gräfener (2003) Hamann, W.-R. & Gräfener, G. 2003, A&A, 410, 993
- Hamann & Koesterke (1998) Hamann, W.-R. & Koesterke, L. 1998, A&A, 335, 1003
- Hamann et al. (1992) Hamann, W.-R., Leuenhagen, U., Koesterke, L., & Wessolowski, U. 1992, A&A, 255, 200
- Hamann & Schmutz (1987) Hamann, W.-R. & Schmutz, W. 1987, A&A, 174, 173
- Herald et al. (2001) Herald, J. E., Hillier, D. J., & Schulte-Ladbeck, R. E. 2001, ApJ, 548, 932
- Hillier (1987a) Hillier, D. J. 1987a, ApJS, 63, 965
- Hillier (1987b) Hillier, D. J. 1987b, ApJS, 63, 947
- Hillier (1989) Hillier, D. J. 1989, ApJ, 347, 392
- Hillier (2003) Hillier, D. J. 2003, in IAU Symp., Vol. 212, A Massive Star Odyssey: From Main Sequence to Supernova, ed. K. A. van der Hucht, A. Herrero, & E. César (San Francisco: ASP), 70
- Hillier & Miller (1998) Hillier, D. J. & Miller, D. L. 1998, ApJ, 496, 407
- Hillier & Miller (1999) Hillier, D. J. & Miller, D. L. 1999, ApJ, 519, 354
- Hummer & Mihalas (1988) Hummer, D. G. & Mihalas, D. 1988, ApJ, 331, 794
- Koesterke & Hamann (1995) Koesterke, L. & Hamann, W.-R. 1995, A&A, 299, 503
- Koesterke et al. (2002) Koesterke, L., Hamann, W.-R., & Gräfener, G. 2002, A&A, 384, 562
- Koesterke et al. (1992) Koesterke, L., Hamann, W.-R., & Kosmol, P. 1992, A&A, 255, 490
- Koesterke et al. (2001) Koesterke, L., Hamann, W.-R., & Urrutia, T. 2001, A&A, 379, 224
- Krtička & Kubát (2004) Krtička, J. & Kubát, J. 2004, A&A, 417, 1003
- Kurucz (1991) Kurucz, R. L. 1991, in NATO ASI Series, Vol. 341, Stellar Atmospheres – Beyond Classical Models, ed. L. Crivellary, I. Hubeny, & D. G. Hummer, 441
- Kurucz (2002) Kurucz, R. L. 2002, in AIP Conf. Proc. 636: Atomic and Molecular Data and Their Applications, 134
- Kurucz & Bell (1995) Kurucz, R. L. & Bell, B. 1995, Kurucz CD-ROM No. 23. Cambridge, Mass.: Smithsonian Astrophysical Observatory
- Lépine et al. (1999) Lépine, S., Eversberg, T., & Moffat, A. F. J. 1999, AJ, 117, 1441
- Lépine & Moffat (1999) Lépine, S. & Moffat, A. F. J. 1999, ApJ, 514, 909
- Lépine et al. (2000) Lépine, S., Moffat, A. F. J., St-Louis, N., et al. 2000, AJ, 120, 3201
- Lamers & Leitherer (1993) Lamers, H. J. G. L. M. & Leitherer, C. 1993, ApJ, 412, 771
- Lamers & Nugis (2002) Lamers, H. J. G. L. M. & Nugis, T. 2002, A&A, 395, L1
- Langer (1989) Langer, N. 1989, A&A, 210, 93
- Leuenhagen & Hamann (1994) Leuenhagen, U. & Hamann, W.-R. 1994, A&A, 283, 567
- Leuenhagen et al. (1996) Leuenhagen, U., Hamann, W.-R., & Jeffery, C. S. 1996, A&A, 312, 167
- Lucy (1964) Lucy, L. B. 1964, in First Harvard-Smithsonian Conference on Stellar Atmospheres, ed. E. H. Avrett, O. J. Gingerich, & C. A. Whitney, Smithsonian Astrophysical Observatory Special Report No. 167 (Cambridge, Mass.), 93
- Lucy (2002) Lucy, L. B. 2002, A&A, 384, 725
- Lucy (2003) Lucy, L. B. 2003, A&A, 403, 261
- Lucy & Abbott (1993) Lucy, L. B. & Abbott, D. C. 1993, ApJ, 405, 738
- Mihalas & Hummer (1973) Mihalas, D. & Hummer, D. G. 1973, ApJ, 179, 827
- Mihalas et al. (1976) Mihalas, D., Kunasz, P. B., & Hummer, D. G. 1976, ApJ, 206, 515
- Nahar (1999) Nahar, S. N. 1999, ApJS, 120, 131
- Nahar & Pradhan (1997) Nahar, S. N. & Pradhan, A. K. 1997, ApJS, 111, 339
- Nugis & Lamers (2002) Nugis, T. & Lamers, H. J. G. L. M. 2002, A&A, 389, 162
- Owocki & Gayley (1999) Owocki, S. P. & Gayley, K. G. 1999, in IAU Symp., Vol. 193, Wolf-Rayet Phenomena in Massive Stars and Starburst Galaxies, ed. K. A. van der Hucht, G. Königsberger, & P. R. J. Eenens (San Francisco: ASP), 157
- Owocki & Puls (1999) Owocki, S. P. & Puls, J. 1999, ApJ, 510, 355
- Pauldrach et al. (1986) Pauldrach, A., Puls, J., & Kudritzki, R. P. 1986, A&A, 164, 86
- Pauldrach et al. (2001) Pauldrach, A. W. A., Hoffmann, T. L., & Lennon, M. 2001, A&A, 375, 161
- Pauldrach et al. (1994) Pauldrach, A. W. A., Kudritzki, R. P., Puls, J., Butler, K., & Hunsinger, J. 1994, A&A, 283, 525
- Puls et al. (1996) Puls, J., Kudritzki, R.-P., Herrero, A., et al. 1996, A&A, 305, 171
- Puls et al. (2000) Puls, J., Springmann, U., & Lennon, M. 2000, A&AS, 141, 23
- Rogers & Iglesias (1998) Rogers, F. J. & Iglesias, C. A. 1998, Space Sci. Rev., 85, 61
- Schaerer (1996) Schaerer, D. 1996, A&A, 309, 129
- Schaerer & Schmutz (1994) Schaerer, D. & Schmutz, W. 1994, A&A, 288, 231
- Schmutz (1995) Schmutz, W. 1995, in IAU Symp., Vol. 163, Wolf-Rayet Stars: Binaries, Colliding Winds, Evolution, ed. K. A. van der Hucht & P. M. Williams (Kluwer, Dodrecht, Holland), 127
- Schmutz (1997) Schmutz, W. 1997, A&A, 321, 268
- Schmutz et al. (1989) Schmutz, W., Hamann, W.-R., & Wessolowski, U. 1989, A&A, 210, 236
- Seaton (1987) Seaton, M. 1987, Journal of Physics B Atomic Molecular Physics, 20, 6363
- Seaton et al. (1994) Seaton, M. J., Yan, Y., Mihalas, D., & Pradhan, A. K. 1994, MNRAS, 266, 805
- Seaton et al. (1992) Seaton, M. J., Zeippen, C. J., Tully, J. A., et al. 1992, Rev. Mexicana Astron. Astrofis., 23, 19
- Sellmaier et al. (1993) Sellmaier, F., Puls, J., Kudritzki, R. P., et al. 1993, A&A, 273, 533
- Sim (2004) Sim, S. A. 2004, MNRAS, 349, 899
- Steffen (1990) Steffen, M. 1990, A&A, 239, 443
- The Opacity Project Team (1995) The Opacity Project Team. 1995, The Opacity Project, Vol. 1 (Institute of Physics Publications, Bristol, UK)
- Unsöld (1955) Unsöld, A. 1955, Physik der Sternatmosphären, 2nd edn. (Springer Verlag, Berlin)
- Vink et al. (1999) Vink, J. S., de Koter, A., & Lamers, H. J. G. L. M. 1999, A&A, 350, 181
- Vink et al. (2000) Vink, J. S., de Koter, A., & Lamers, H. J. G. L. M. 2000, A&A, 362, 295