Starburst at the Expanding Molecular Superbubble in M82:
Self-Induced Starburst at the Inner Edge of the Superbubble
Abstract
We present high spatial resolution ( or 43 pc 36 pc at D = 3.9 Mpc) 100 GHz millimeter-wave continuum emission observations with the Nobeyama Millimeter Array toward an expanding molecular superbubble in the central region of M82. The 100 GHz continuum image, which is dominated by free-free emission, revealed that the four strongest peaks are concentrated at the inner edge of the superbubble along the galactic disk. The production rates of Lyman continuum photons calculated from 100 GHz continuum flux at these peaks are an order of magnitude higher than those from the most massive star forming regions in our Galaxy. At these regions, high velocity ionized gas (traced by H41 and [Ne II]) can be seen, and H2O and OH masers are also concentrated. The center of the superbubble, on the other hand, is weak in molecular and free-free emissions and strong in diffuse hard X-ray emission. These observations suggest that a strong starburst produced energetic explosions and resultant plasma and superbubble expansions, and induced the present starburst regions traced by our 100 GHz continuum observations at the inner edge of the molecular superbubble. These results, therefore, provide the first clear evidence of self-induced starburst in external galaxies. Starburst at the center of the superbubble, on the other hand, begins to cease because of a lack of molecular gas. This kind of intense starburst seems to have occurred several times within years in the central region of M82.
1 INTRODUCTION
Messier 82 (NGC 3034, Cigar Galaxy) is known as one of the nearby (3.9 Mpc; Sakai & Madore, 1999), bright irregular galaxies, and, therefore, has been studied by many authors, at many wavelengths, and over many years. Optical observations (Lynds & Sandage, 1963; Shopbell & Bland-Hawthorn, 1998; Ohyama et al., 2002) show remarkable features of kpc-scale filaments extending above and below the disk of this galaxy. Soft X-ray (Watson, Stanger, & Griffiths, 1984; Kronberg, Biermann, & Schwab, 1985; Bregman, Schulman, & Tomisaka, 1995; Tsuru et al., 1997; Strickland, Ponman, & Stevens, 1997), molecular gas (Nakai et al., 1987; Matsushita et al., 2000; Taylor, Walter, & Yun, 2001; Walter, Weiss, & Scoville, 2002), and dust (Kuno & Matsuo, 1997; Alton, Davies, & Bianchi, 1999) observations also show filamentary structures outside the disk region. These observations suggest that the filamentary structures are the result of explosions, which occurred within the nuclear region. The mass-to-luminosity ratio, , of this galaxy is extremely low (, Rieke & Lebofsky, 1979; , Telesco, 1993) as compared with normal galaxies (, Rieke & Lebofsky, 1978) and can be explained by bursts of star formation or a starburst (Rieke & Lebofsky, 1978; Rieke et al., 1980).
The starburst in M82 is believed to be triggered by a tidal interaction with the nearby two-armed spiral galaxy M81. Neutral hydrogen (H I) emission observation toward the M81 group shows that there is a tidal bridge between M81 and M82, suggesting that there is a close encounter between these two galaxies years ago (e.g., Cottrell, 1977; Yun, Ho, & Lo, 1994). Optical and near-infrared imaging and spectroscopic observations toward the disk region ( kpc outside from the galactic center) of M82 indicate that the starburst occurred at this region years ago, corresponds to the episode of the tidal interaction with M81 (O’Connell & Mangano, 1978; Gallagher & Smith, 1999; de Grijs, O’Connell, & Gallagher, 2001; Smith & Gallagher, 2001). Since the present starburst region is located at the center, they suggested that the global starburst in M82 has propagated inward from the disk to the nuclear regions. The evolution of starburst at the nuclear 500 pc region is, on the other hand, still unclear. Some authors suggest the nuclear starburst propagated outward (e.g., Satyapal et al., 1995, 1997; Förster Schreiber et al., 2003), and some inward (e.g., Shen & Lo, 1995).
Interferometric molecular gas observations show an arc-like deviation from rigid rotation in position-velocity (PV) diagrams at pc westward from the galactic nucleus, and this deviation implies the existence of an expanding molecular superbubble (Neininger et al., 1998; Weiss et al., 1999; Wills et al., 1999). The existence of the superbubble was confirmed by imaging the shell-like structure with the size of 260 pc 170 pc (Matsushita et al., 2000; Wills, Pedler, & Muxlow, 2002). The age and the total energy of the superbubble are estimated to be about yr and ergs, which corresponds to the total energy of supernovae. At the center of the superbubble, there is a “2.2 m secondary peak” (a primary peak corresponds to the nucleus; Dietz et al., 1986; Lester et al., 1990), which is dominated by luminous supergiants (Joy, Lester, & Harvey, 1987). Since luminous supergiants are the late phase of OB stars, it is reasonable to suppose that a starburst has occurred at this near-infrared peak in the recent past. Actually, calculations of the initial mass function of this peak suggest that the number of supernovae, which have already exploded within the age of the superbubble, can explain the total energy of the superbubble. It is therefore concluded that this superbubble has been produced as a result of localized starburst at the “2.2 secondary peak” (Matsushita et al., 2000).
Detailed information about the nature of starburst in this region is, however, still not clear, because the central region of M82 is deeply obscured by dust even in the K-band (e.g., , McLeod et al., 1993; , Satyapal et al., 1995; , Telesco et al., 1991: These correspond to , , and , respectively, if we assume ; Draine, 1989). Hence it is very hard to derive detailed information — such as the precise flux of recombination lines — in the optical or near-infrared.
On the other hand, 100 GHz continuum observations are generally dominated by the free-free emission and would not be affected by the dust absorption, as is the case for optical or near-infrared observations. In fact, spectral energy distribution (SED) studies from the infrared to radio wavelength region of M82 indicates that the 100 GHz continuum emission in M82 is dominated by free-free emission (Condon, 1992; Matsuo et al., 1998). A detailed SED study for small-scale structures toward the central region of M82 by Carlstrom & Kromberg (1991) based on their millimeter and centimeter interferometric (BIMA and VLA) observations concluded that the free-free emission dominates even in the small-scale structures of 100 GHz continuum emission (i.e., 100 GHz continuum emission from all the peaks are dominated by free-free emission). Hence, 100 GHz continuum observations can have great advantages for the observation of the central starburst regions in M82, where a large amount of dust exists.
In this paper, we report the structures and properties of the present starburst regions and environment in M82 with our high spatial resolution 100 GHz observations and compare them with previously published data. We also discuss the triggering of new starbursts by the past energetic starburst and the resultant superbubble expansion, namely, self-induced starburst.
2 OBSERVATIONS
We obtained aperture synthesis 100 GHz continuum images toward the central region of M82 with the Nobeyama Millimeter Array during 1997 December – 1998 April. Three (AB, C, and D) configurations of six 10 m antennas, equipped with tunerless SIS receivers (Sunada, Kawabe, & Inatani, 1994), were used for the observations. As back-end, we used an XF-type spectro-correlator Ultra Wide Band Correlator (UWBC; Okumura et al., 2000b), which has a 1 GHz bandwidth and a 6 GHz intermediate frequency. Since the UWBC can process both the upper side band (USB) and the lower side band (LSB), our continuum data were obtained from the USB of the HCN(1 – 0) observations (the rest frequency of the HCN J = 1 – 0 line is 88.632 GHz, and the observed frequency is 88.884 GHz). Hence the central frequency of the continuum observations corresponds to 100.884 GHz. The band-pass calibration was done with 3C273, and 0923+392 was observed every 10 minutes as a phase and amplitude calibrator. The flux scale of 0923+392 was determined by comparisons with Mars and Uranus. The uncertainty in the absolute flux scale is estimated to be 20%.
The data were reduced using the NRO software package “UVPROC II” (Tsutsumi, Morita, & Umeyama, 1997), and the final maps were made and CLEANed with the NRAO software AIPS. We analyzed the 100 GHz continuum data with uniform weighting at the CLEAN process, and the resultant resolution was (43 pc 36 pc at D = 3.9 Mpc). We note that this linear scale of the beam size is similar to the typical diameter of a giant molecular cloud (GMC).
3 RESULTS
3.1 Distribution of 100 GHz Continuum Emission
The 100 GHz continuum map made with uniform weighting is shown in Figure 1. We defined a “peak” as (1) detected in the map with or more and (2) separated from other peaks by more than one beam width. We found seven peaks in the map (Peaks A–G in the figure), and all peaks were aligned along the galactic disk (position angle or P.A. of 76°). The four strongest peaks, D–G, correspond to the two strongest peaks in the previously published lower spatial resolution 100 GHz continuum images (Carlstrom & Kromberg, 1991; Brouillet & Schilke, 1993; Seaquist et al., 1996; Neininger et al., 1998). Other weaker peaks in our map correspond to those in the previously published images. Note that our lower resolution () and higher signal-to-noise ratio map (i.e., natural weighting map; not shown in this paper) is consistent with other published results.
Since the uniform weighting increases the noise level of the map, the diffuse extended emission may be masked by the noise, and the total flux of the 100 GHz continuum emission may decrease compared with the natural weighting image. However, the total flux of the uniform weighting map is, in fact, 80% of that of the natural weighting map, which suggests that most of the flux is not missing. On the other hand, the total flux of our natural weighting map is 0.43 Jy, and the missing flux compared with the single-dish flux ( 0.54 Jy; Jura, Hobbs, & Maran, 1978) is 20%, which is almost comparable with the uncertainty in the absolute flux scale. We therefore did not recover the missing flux and conclude that the high spatial resolution starburst properties, as reported here, are accurate at the 30% level.
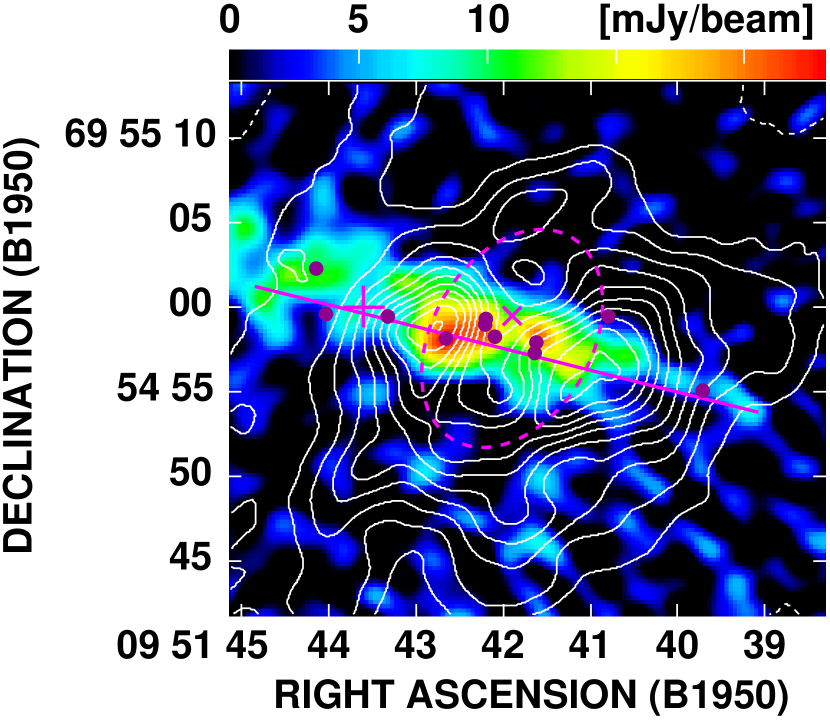
Figure 2 shows the 12CO(1 – 0) superbubble image (contour map; Matsushita et al., 2000) overlaid on the 100 GHz continuum image (colorscale map). The dashed line shows the possible oval structure of the superbubble. This figure shows that the four brightest peaks (D-G) in the 100 GHz continuum image are located at the inner edge of the molecular superbubble along the galactic disk of M82. We also made an 100 GHz continuum intensity plot of the superbubble sliced along the major axis (P.A. = 76°), namely along the galactic disk, of the galaxy to compare with that of the 12CO emission (Fig. 3). The continuum emission has a double-peaked structure in the plot: The intensity is weak at the center of the superbubble (around zero offset in the figure) and has peaks at both sides of the bubble center, which are located around offsets. The plot of the 12CO emission also shows a double-peaked structure. The emission is weak at the center of the bubble, but peaks are located around , outside the peaks of the continuum emission. This figure demonstrates that the 100 GHz emission is located at the inner edge of the molecular superbubble.
Since the 100 GHz continuum emission in M82 is dominated by free-free emission, even in small-scale structures (see §1), these 100 GHz continuum emitting regions represent starburst regions. This distribution, therefore, strongly suggests that the present starburst regions in M82 are concentrated at the inner edge of the molecular superbubble.
3.2 Production Rates of Lyman Continuum Photons
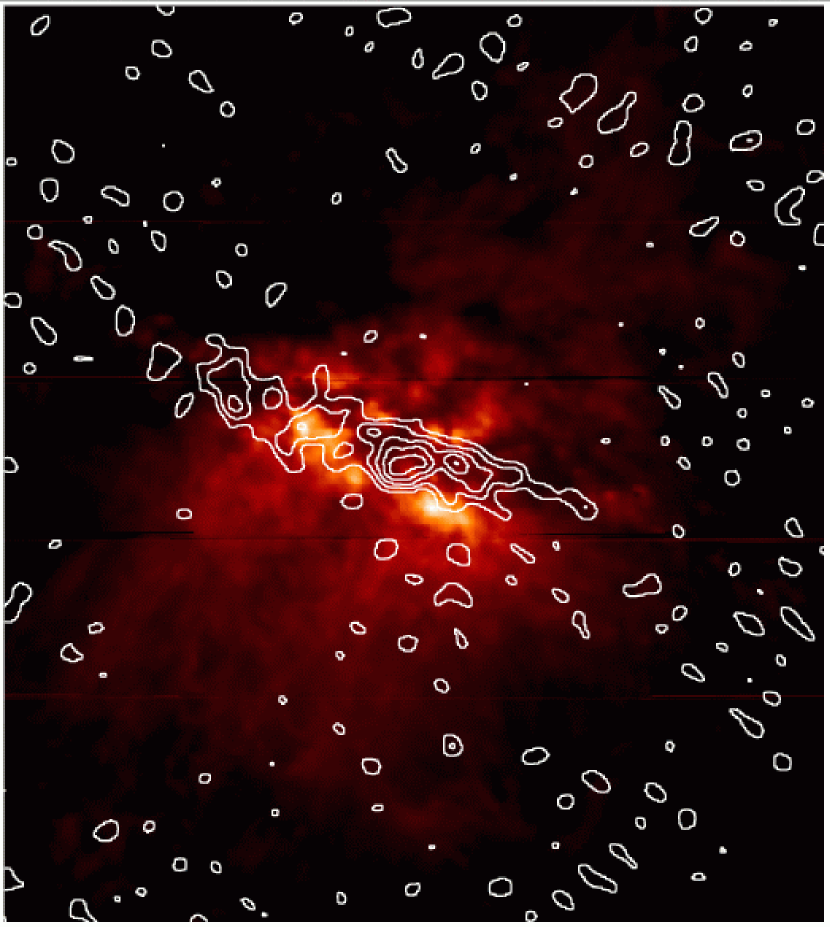
The 100 GHz continuum emission in M82 is dominated by free-free emission, as mentioned above, so that the strength of the emission is directly related to star formation activities like H emission at optical wavelength. Furthermore, 100 GHz continuum emission does not be affected by the dust absorption like the H emission. Figure 4 shows the H image (colroscale map; Ohyama et al., 2002) overlaid on the 100 GHz continuum image (contour map). The map clearly shows that the brightest 100 GHz continuum peaks are totally obscured by dust in the H image, indicating that 100 GHz continuum observation is a strong tool to image the active starburst regions directly.
We therefore use the 100 GHz continuum emission flux (i.e., absorption-free free-free emission flux), , to estimate the production rates of Lyman continuum photons, . The absorption-free can be calculated as
| (1) |
where and are the electron temperature and the observation frequency, respectively (Rubin, 1968; Condon, 1992). We adopted Mpc (Sakai & Madore, 1999) for the distance of M82. Since radio recombination line observations toward the central region of M82 suggest that of the ionized gas (different from hot plasma which can be seen in X-ray emission) ranges between 5,000 K and 10,000 K (Seaquist et al., 1996, 1994; Puxley et al., 1989), we used = 5,000 K and 10,000 K for the calculations.
We substitute the peak flux density of the 100 GHz continuum averaged over the beam size of (43 pc 36 pc) into eq. (1), and derived at the specific regions (Peaks A-G in Fig. 1) in M82 (Table 1). We find that in the present star forming regions averaged over the linear scale of about pc are as high as photons s-1 for the four strong peaks (D–G; the western side of the nucleus) and photons s-1 for other weaker peaks (the eastern side of the nucleus). The uncertainty of is about photons s-1, which corresponds to statistical uncertainty in the continuum map.
To find out the validity of our estimation of , we compared our estimation with those of infrared observations. Förster Schreiber et al. (2001) estimated aperture size using their Br image, which is corrected for extinction of . The at their position B2, which corresponds to our Peak D, is photons s-1, consistent with that of Peak D of photons s-1 (Table 1). Satyapal et al. (1997) also estimated using their Br image, corrected for reddening of about . They found 12 point-like sources at the central 500 pc region using an extinction corrected K-band image, and calculated for with aperture size, similar to our beam size. values for the eastern side of the nucleus show , and those of western side show . The tendency that of the western side is about twice as strong as that of the eastern side is the same as our results. Their absolute values are, however, a factor of a few smaller than our estimation and that of Förster Schreiber et al. (2001). This inconsistency maybe due to their smaller reddening correction. In summary, our estimation using 100 GHz continuum flux and that using infrared emission line data are consistent each other.
4 DISCUSSION
In the previous section, we show that the present starburst regions are strongly concentrated at the inner edge of the expanding molecular superbubble. In this section, we discuss the starburst activities, environment, and history around the superbubble.
4.1 Comparison of Star Formation Activity with Our Galaxy and Nearby Galaxies
Since the linear scale of our beam size is comparable to those of GMCs, it is worth comparing the star forming activity around the superbubble in M82 with those in active star forming GMCs in our Galaxy and nearby galaxies using . Free-free continuum emission is, however, optically thin at 100 GHz, so there may exist some overlap of the starburst regions, since M82 is an edge-on galaxy. We therefore evaluated the effect of overlapping based on the structure of the superbubble and estimated that a few GMCs can overlap at Peaks D and G, since the shell structure is parallel to the line-of-sight. However, there may be none at Peaks E and F, which are close to the bubble center (i.e., the shell structure is perpendicular to the line-of-sight). There is also a possibility that starburst regions around the superbubble overlap with starburst regions in the background disk. This possibility is, however, very small, because stars are formed from molecular gas, and almost all the molecular gas toward the superbubble is dynamically associated with it (Neininger et al., 1998; Weiss et al., 1999; Wills et al., 1999; Matsushita et al., 2000). In addition, radio recombination lines, which also trace star forming regions, toward the superbubble are also dynamically associated with it (see §4.3.2). These discussions indicate that Peaks E and F are starburst regions at the inner edge of the superbubble with no overlap, and we therefore compare at Peaks E and F with those at active star forming GMCs in our Galaxy and nearby galaxies.
At Peaks E and F, are and photons s-1 for = 5,000 K and and photons s-1 for = 10,000 K, respectively (see Table 1). These are an order of magnitude higher than those of active star forming regions in our Galaxy: The most massive and luminous optically visible giant H II region NGC 3603 (Goss & Radhakrishnan, 1969), which is kpc away from the Galactic Center, has of photons s-1 (Smith, Biermann, & Mezger, 1978). The H II region complex G in one of the most luminous star forming regions W51, which is 7.6 kpc away from the Galactic Center (Smith et al., 1978), has of photons s-1 (Okumura et al., 2000a). The diameters of these regions are about 50 pc and 30 pc, respectively (Okumura et al., 2000a), which are almost the same linear scale as Peaks E and F. This comparison indicates that the ongoing starburst regions in M82 are at least 30 times more active in terms of ionizing flux than the active star forming regions in our Galaxy.
Millimeter-wave (3.4 mm or 88 GHz) continuum image toward the center of the nearby spiral galaxy IC 342 show a continuum peak at a star forming GMC (cloud B in Downes et al., 1992). The peak intensity is mJy beam-1 with the beam size of (24 pc 24 pc at D = 1.8 Mpc; McCall, 1989), and seems to be dominated by free-free emission. Substituting these values in Eq. 1, can be calculated as photons s-1 for = 5,000 K and photons s-1 for = 10,000 K. H and Pa emission line observations toward the central region of grand-design spiral galaxy M51 using the WFPC2 and NICMOS instruments on the Hubble Space Telescope depicted more than 1000 H II regions with their typical sizes of pc (Scoville et al., 2001). The fraction of the sizes of H II regions peak around pc, which is independent of their locations (including nuclear, arm, and interarm regions). The of the H II regions with the sizes less than 50 pc show photons s-1. In both galaxies, star formation activities in terms of ionizing flux with the scale of pc show an order of magnitude lower than the starburst GMCs in M82.
Comparisons between starburst GMCs in M82 and star forming GMCs in our Galaxy, M51, and IC 342 suggest that the star formation in M82 is quantitatively different from those in our Galaxy, M51 and IC 342, namely, M82 has an order of magnitude higher star formation efficiency in GMC scale. Recent high angular resolution optical and near infrared observations toward nearby galaxies show many super star clusters (SSCs) with their size at most 10 pc. Our observations are limited by the beam size of pc, thus we cannot compare them directly. It will be interesting to perform sub-arcsec resolution ( pc) 100 GHz continuum observations toward these starburst regions in M82 to resolve SSCs and compare with those of other galaxies in the future. These observations may help to understand what causes the qualitative differences between starburst GMCs in M82 and star forming GMCs in our Galaxy and nearby galaxies.
4.2 Stellar Compositions in the Ongoing Starburst Regions
In the previous section, we estimated the production rates of Lyman continuum photons () from the ongoing starburst regions in M82. Based on this information, it is possible to estimate the stellar compositions in the starburst regions by assuming a mass function (MF).
4.2.1 Mass Function Calculations
We adopted an extended Millar-Scalo MF of with lower and upper mass limits of 1 and 100 M⊙ (Kennicutt, 1983). To estimate the total from all the stars calculated from the MF, the value of from stars with each stellar mass is needed. We used the stellar model of Vacca, Garmany, & Shull (1996), who calculated for the O-type and early B-type stars, and their evolutionary mass model (stellar mass derived from an evolutionary track) for the luminosity class V (main sequence). The reason for using this class is the following: Since the ongoing starburst regions are located just at the inner edge of the superbubble, and these seem to be induced by the past starburst that made the superbubble (see §4.3), it is reasonable to suppose that the present starburst regions are younger than the expanding timescale of the superbubble. The age of the superbubble is about years (Weiss et al., 1999; Matsushita et al., 2000; Wills et al., 2002); hence the starburst should have occurred on less than this timescale, which is similar to or less than the lifetime of early-type stars. It is therefore appropriate to assume that all the stars in the present starburst regions are still on the main sequence.
Since the calculations of the stellar model in Vacca et al. (1996) are done with each spectral type, we interpolated their for the smaller interval of the stellar mass with fourth-order polynomial fitting. The fitting residual is 1.2%, which is much smaller than other errors (e.g., statistical noise and absolute flux error of our observations). The extrapolations for very massive stars and for late-type stars (later than late B-type stars) were done with the same function as the interpolation. Using this “interpolated/extrapolated - stellar mass” relation and the MF explained above, we calculated the stellar compositions for each starburst region (Peaks A-G). The calculated stellar numbers with mass larger than 8 M⊙, which are the progenitors of supernovae, are summarized in Table 1.
We also estimated the dependence of MF slopes and stellar mass limits. If we apply a steeper MF of , which is close to the slope of Miller-Scalo solar neighborhood MF of -3.3 (Miller & Scalo, 1979), the calculated M⊙ stellar numbers will increase about a factor of 2. On the other hand, if we apply a shallower MF of , the calculated M⊙ stellar numbers will decrease about a factor of 2. If we lower the upper mass limit to 50 M⊙, the calculated M⊙ stellar numbers will increase about a factor of 2. Changing the lower mass limit affects to the calculations only slightly, since low mass stars emit small amounts of Lyman continuum photons. Rieke et al. (1993) computed the starburst model for M82, and concluded that the MF model of with the upper mass limit of 80 M⊙ will fit their observations the best. Förster Schreiber et al. (2003) also performed starburst model calculations, and found out that their data are consistent with the MF model of with the upper mass limit of M⊙. In either case, the difference between our and their MF models will not produce an order of magnitude difference in the calculated M⊙ stellar numbers.
There is also a possibility that the superbubble expansion timescale is longer than the previous estimation of years. This timescale is calculated with [the size of the superbubble]/[expansion velocity], but if the acceleration of the molecular gas to the present expansion velocity is gradual (i.e., if the expansion velocity is slow when the superbubble is small), the expansion timescale should be longer than the estimation. If this is the case, some of the highest mass stars should have already been exploded by supernovae, and this effect should be considered in the MF calculations. This effect corresponds to lowering the upper mass limit of the MF calculations and, therefore, increasing the M⊙ stellar numbers. The superbubble expansion timescale shorter than years can also be possible, due to the deceleration of the expanding velocity (Weiss et al., 1999; García-Burillo et al., 2001). In this case, the timescale is shorter than the age of the high-mass (OB type) stars, and we can assume that there are no supernova explosions in the past. Therefore, this case does not affect any MF calculations.
4.2.2 Estimated Supernova Energy Release from the Ongoing Starburst Regions
It is interesting to find out whether the present starburst is more active than the past starburst that made the molecular superbubble. In order to compare the energetics of the present starburst with that of the molecular superbubble, we calculated M⊙ stars, whose lifetime corresponds to the dynamical timescale of the superbubble of years, at Peaks E and F. We found stars for = 5,000 K and stars for = 10,000 K, which corresponds to about supernova explosions with a total energy release of ergs.
The efficiency of the supernova explosion energy input to the bubbles/chimneys varies. A single supernova explosion releases its energy to the surrounding ISM with an efficiency of %, depending on the density of the ISM (Chevalier, 1974). Multiple supernova explosions, on the other hand, release their energy into the ISM more efficiently, with up to 20% of their total energy (McCray & Kafatos, 1987). If we take the efficiency of , bubbles/chimneys with energy of ergs will be produced at Peaks E and F in the future, which is similar to the observed bubbles in our Galaxy or nearby galaxies (e.g., Tenorio-Tagle & Bodenheimer, 1988; Martin, 1998). This energy is, however, a few orders of magnitude lower than that of the molecular superbubble in M82 ( ergs; Matsushita et al., 2000) and suggests that the present starburst regions are less active than the starburst that made the molecular superbubble.
This possibility may not be the case if the expansion timescale of the superbubble is longer than expected. The longer timescale increases the energy release from the present starburst regions owing to the increase in the number of supernovae (see §4.2.1). The energy input into the surrounding ISM, therefore, would be closer to the energy of the present superbubble.
4.3 Induced Starburst at the Inner-Edge of the Superbubble
4.3.1 Structure of the Superbubble
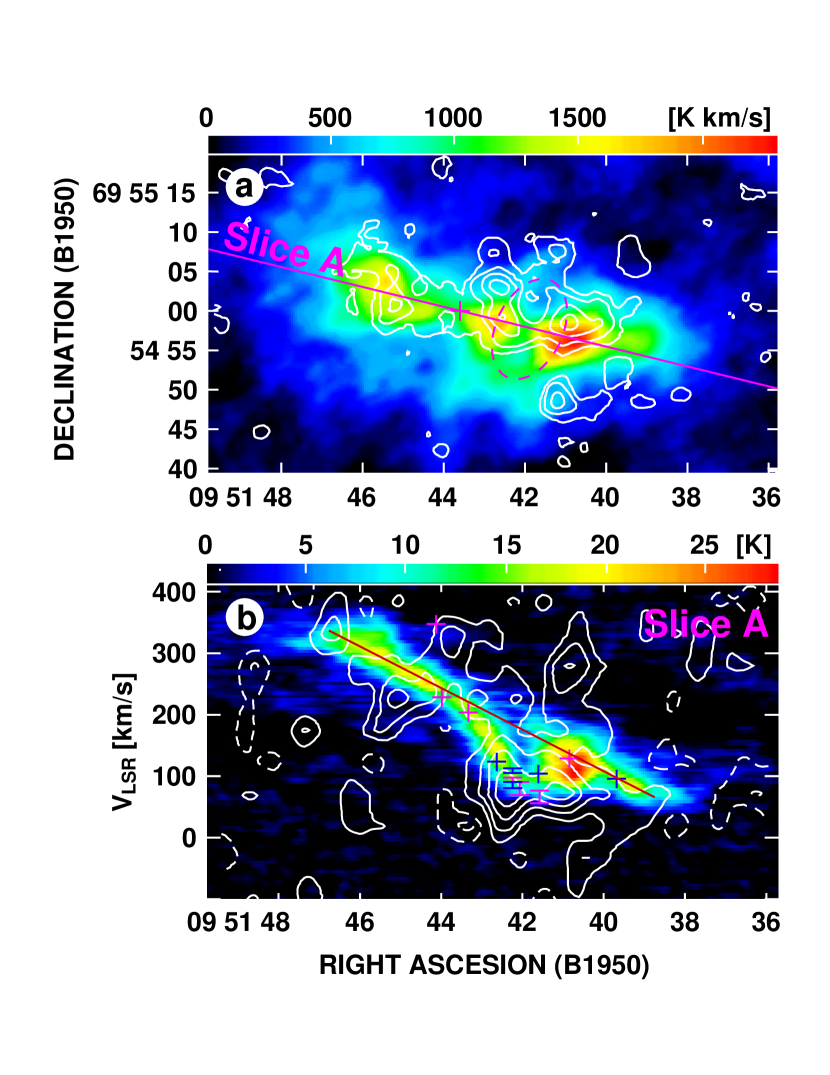
Molecular emission from the superbubble is strong in the southern part, but weak in the northern part. On the other hand, the images of atomic and ionized gas — H I absorption line (Wills et al., 2002), radio recombination line (H41; Seaquist et al., 1996) and forbidden line ([Ne II]; Achtermann & Lacy 1995) — show stronger intensity from the northern part than from the southern part (Fig. 5a; see also Wills et al., 1999, 2002). The shell-like structure detected in the 408 MHz continuum by Wills et al. (1997) clearly shows the complete superbubble structure. These results seem to indicate that the superbubble is not disrupted yet, and the southern part of the superbubble is dominated by molecular gas and the northern part by atomic and ionized gas.
The reason for this asymmetry is not clear. One possibility is that the explosions, which made the superbubble, have occurred preferentially north of the galactic disk. This initial condition suggests that the southern part is rich in molecular gas, but the northern part is not, so that the latter is more likely to be dominated by atomic and ionized gas (i.e., less molecular gas and/or less self-shielding of the molecular gas). Indeed, the large-scale (kpc-scale) H image of M82 shows that the southern outflow is relatively confined to the minor axis of the galaxy, but the northern outflow has a wider opening angle. This difference suggests that the starburst is located slightly north of the galactic disk, and the material distribution asymmetry causes the different collimations in the northern and southern outflows (Shopbell & Bland-Hawthorn, 1998). Such asymmetry in the structure of bubbles can also be seen in other galaxies (e.g., our Galaxy, Normandeau, Taylor, & Dewdney 1996; M101, Kamphuis, Sancisi, & van der Hulst 1991), although their low-density regions are thought to be already disrupted.
4.3.2 Kinematics of Ionized Gas
We compared the position-velocity (PV) diagram of molecular gas with that of a radio recombination line (H41; Seaquist et al., 1996) and found that the deviation from the rigid rotation of the recombination line is larger than that of the molecular gas (Fig. 5b). Similar deviation difference is also seen in the comparison between the molecular gas and the [Ne II] line (Wills et al., 1999). Since the deviation is evidence of the superbubble expansion (Neininger et al., 1998; Weiss et al., 1999; Wills et al., 1999; Matsushita et al., 2000; Wills et al., 2002), the ionized gas is kinematically related to the superbubble, but moves faster than the neutral gas.
4.3.3 Distributions and Kinematics of Masers
We compiled all the observed OH and H2O masers toward M82 (Weliachew, Fomalont, & Greisen, 1984; Baudry & Brouillet, 1996; Seaquist, Frayer, & Frail, 1997) and found that the masers are obviously concentrated at the 100 GHz continuum emitting regions, namely, the intense starburst regions (Fig. 2). In addition, we overplotted the masers on the PV diagram of molecular gas and found that the OH and H2O masers are strongly concentrated at the superbubble with good velocity coincidences (Fig. 5b). Pumping mechanisms for OH masers are collisions ( shocks) and/or IR/UV radiation ( radiation from H II regions), and those for H2O masers are basically shocks (Elitzur, 1992).111Strictly speaking, H2O maser sources need to have (1) high H2 number density of cm-3, (2) high temperature of K, and (3) pumping sources. In our Galaxy, the maser-emitting sources are usually shocked molecular gas, but in the center of galaxies, dense molecular gas disks/tori around active galactic nuclei (AGNs) are also possible, such as H2O megamasers toward the AGN of NGC 4258 (Miyoshi et al., 1995). As mentioned below, since the luminosity of H2O masers in M82 is similar to the Galactic sources, we think H2O masers in M82 are coming from shocked molecular gas. Indeed, observations of our Galaxy indicate that these masers can be seen around H II regions (Gaume & Mutel, 1987; Elitzur, 1992) and at the shock fronts of supernova remnants (Arikawa et al., 1999). Furthermore, masers in M82 are not so luminous as megamasers around AGNs, but much more similar to the Galactic sources (Baudry & Brouillet, 1996; Seaquist et al., 1997). In addition, recent interferometric SiO line observations toward the superbubble suggest that the SiO line may trace shocked regions, and the shocked regions may locate the inner wall of the superbubble (García-Burillo et al., 2001), consistent with our result.
4.3.4 Distribution of Diffuse Hard X-ray Emission
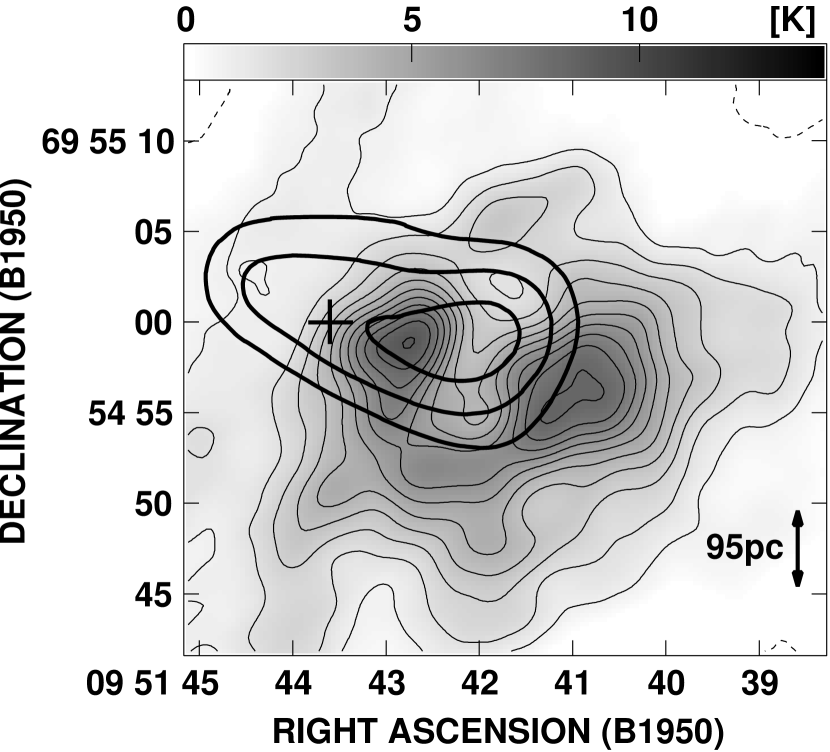
Both inside and outside the superbubble, various X-ray sources can be seen from soft/medium ( keV) to hard components ( keV). The soft and medium components show extended structures, which are believed to originate from hot thermal plasma (Tsuru et al., 1997; Strickland et al., 1997; Griffiths et al., 2000). The soft component corresponds well with the large-scale ionized gas outflows (Watson et al., 1984; Kronberg et al., 1985; Strickland et al., 1997; Shopbell & Bland-Hawthorn, 1998). However, the medium component is much more concentrated (Tsuru et al., 1997), and its peak position is located at the center of the superbubble (Matsushita et al., 2000; Matsumoto & Tsuru, 1999). Most of the hard component, on the other hand, comes from point sources (Tsuru et al., 1997), which are thought to be neutron stars, stellar-mass black holes, and an intermediate-mass black hole (Matsumoto & Tsuru, 1999; Ptak & Griffiths, 1999; Matsushita et al., 2000; Matsumoto et al., 2001; Kaaret et al., 2001). Some fraction of the hard component, however, comes from a diffuse source with an extent of (Griffiths et al., 2000). Figure 6 shows the diffuse hard X-ray image (thick contour map; Griffiths et al., 2000) overlaid on the the 12CO(1 – 0) superbubble image (thin contour with greyscale map; Matsushita et al., 2000). The diffuse hard X-ray emission is extended toward the center of the galaxy, but the peak is located inside of the molecular superbubble. Since the diffuse hard X-ray data do not have any line-of-sight information, we do not know where is the actual location(s) of the emitting source(s), but clearly there is some source toward the inner part of the superbubble. This position correspondence suggests that some of the diffuse hard X-ray component locates inside the superbubble.
This component could be due to hot thermal plasma (Griffiths et al., 2000), which is also supported by 408 MHz observations (free-free absorption has been detected at the superbubble; Wills et al., 1997), but the possibility of inverse Compton scattering cannot be ruled out (Griffiths et al., 2000). Assuming that the diffuse hard X-ray component is caused by hot thermal plasma, we can calculate the velocity of the plasma. The sound speed, i.e., the velocity, of protons, , in the plasma can be expressed as , where is the Boltzmann constant, is temperature (K), and is the proton mass. Since the plasma temperature, , is estimated as keV (Griffiths et al., 2000), the velocity can be calculated as km s-1. This number is times faster than the expansion velocity of the superbubble, hence the superbubble should be closed and the plasma should be overpressurized, if the plasma is in the superbubble. Indeed, the superbubble seems to be closed (§4.3.1), and Griffiths et al. (2000) suggest that the plasma seems to be overpressurized. In addition, the expansion velocity of the ionized gas222In this paper, we used “ionized gas” as K gas that can be seen with recombination lines, and “hot plasma” as K gas that can be seen with thermal X-ray emission, to distinct these two kind of gas. in the superbubble is faster than that of the molecular gas, and masers are concentrated at the superbubble (§4.3). These support the idea that the some of the diffuse hard X-ray component is located inside the superbubble.
As mentioned above, the possibility that the diffuse hard X-ray component might originate from inverse Compton scattering cannot be ruled out (Griffiths et al., 2000). If true, it indicates that nonthermal high-energy electrons are strongly concentrated inside the superbubble, because the diffuse hard X-ray emission peaks at there. The trapping mechanism of the nonthermal high-energy electrons is unclear, but the magnetic field in and around the superbubble may be playing an important role.
4.3.5 Induced Starburst
In summary, the expanding superbubble seems to be still closed, the overpressurized hot plasma may be filling inside of the superbubble, ionized gas is spatially and kinematically correlated with the expansion of superbubble but moves faster, the masers are also spatially and kinematically located at the inner edge of the superbubble, and the free-free emission is located at the inner edge of the superbubble. The configuration of plasma, ionized gas, and superbubble is very similar to that of the expanding supernova remnants in our Galaxy (e.g., White & Long, 1991); recombination lines that traces ionized gas emit from shock-heated gas and the gas evaporate from the surrounding material that forms shell structures. The faster velocity than the surrounding molecular superbubble and the existence of the masers support this idea. These structural and kinematical features therefore suggest that the hot plasma expanded the superbubble, created the shocked regions at the inner-edge of the superbubble, and induced the active starbursts at there.
Sequential star formation in molecular clouds induced by expanding ionized gas ( shocks) has been suggested theoretically (e.g., McCray & Kafatos, 1987; Elmegreen & Lada, 1977). In our Galaxy, this sequential star formation has also been suggested observationally (e.g., Sugitani et al., 1989, 1995; Yamaguchi et al., 1999). In addition, these observational papers suggest that the induced star forming regions tend to make more massive stars than isolated quiescent dark clouds. We therefore conclude that the present starburst (massive star forming) regions in M82 are induced in ways similar to those of the sequential star formation regions in our Galaxy.
At the center of the superbubble, on the other hand, there is almost no molecular gas emission, neither diffuse (12CO) nor dense (HCN), from both spatial and dynamical points of view (Figs. 2, 5b; see also Matsushita et al., 2000). Furthermore, the 100 GHz continuum emission is also weak at this region compared to the inner edge of the superbubble (see Fig. 3). Since stars are believed to be made from molecular clouds, especially from dense parts (e.g., Lada, 1992; Solomon, Downes, & Radford, 1992; Kohno, Kawabe, & Vila-Vilaró, 1999), and free-free (100 GHz continuum) emission is produced by massive stars, these suggest that the starburst at the center of the superbubble begins to cease, and the number of massive stars is decreasing by supernova explosions.
From these results and discussions, we propose an evolution of starburst around the superbubble in M82. First, the energetic explosions occurred as a consequence of the localized starburst at the center of the superbubble (Matsushita et al., 2000). The resultant shock waves ionized the surrounding ISM, produced the hot thermal plasma and ionized gas, and swept them outward. The neutral ISM (e.g., molecular gas), had also been swept outward and produced the expanding molecular superbubble. Most of the molecular gas at the central starburst region was blown away and/or ionized by the energetic explosions and/or by the strong UV radiation from massive stars, so that the starburst begins to cease. The expansion of the superbubble inside the galactic disk, which is rich in ISM, had compressed the ISM and caused a concentration around the superbubble. This concentration appears as double peaks by the edge-brightening effect (Wills et al., 1999), and these double peaks correspond to the well known “central peak” and the inner side of the “SW lobe,” which can be seen in molecular gas images (e.g., Carlstrom & Kromberg, 1991; Shen & Lo, 1995). The inner edge of this concentration is the shock front of the superbubble expansion, which caused the shocked regions and induced star forming regions in the molecular gas, and produced the masers and free-free continuum emissions at these regions. These induced star forming regions correspond to the present starburst regions in M82. This result is the first clear evidence of self-induced starburst in an external galaxy.
The size-scale of this self-induced starburst is rather small, about 200 pc, and located off from the nucleus (see Fig. 2). This localized and offset self-induced starburst may be the cause of inconsistent conclusions of inward/outward starburst propagations (see §1). The detailed studies at various wavelengths with comparing the positions of superbubbles (e.g., Wills et al., 2002) will give us the detailed starburst propagation and evolution mechanisms.
4.4 Starburst Timescale
Recent observations and model calculations suggest that the central region of M82 has experienced at least two starbursts within years. Optical emission line study suggests that the large-scale outflows originate from at least two (Shopbell & Bland-Hawthorn, 1998), maybe several (Martin, 1998) different burst regions. Model calculations based on infrared spectroscopic observations required two starbursts within years. The first starburst can be explained by the large-scale outflows and red supergiants, and the second one by the UV flux (Rieke et al., 1993; Förster Schreiber et al., 2003). The molecular and dust outflows, which can be seen in both interferometric (Matsushita et al., 2000; Walter et al., 2002) and single-dish observations (Nakai et al., 1987; Kuno & Matsuo, 1997; Alton et al., 1999; Taylor et al., 2001), extend not only from the superbubble region, but also everywhere from the molecular disk.
Our observations, on the other hand, show the past starburst, which has made the superbubble (expansion timescale of years; §4.2.1), and the present induced starburst, which is believed to be younger than the expanding timescale of the superbubble (§4.2). In addition, the superbubble still has closed structure (§4.3.1 and 4.3.4). Furthermore, numerical simulations indicate that large-scale outflows are created by energetic starbursts that can produce superbubbles (e.g., Tomisaka & Ikeuchi, 1988).
These observations and simulations indicate that the energetic starbursts in M82, which produced the large-scale outflows, occurred at least twice in this years, and the recent starbursts (the starburst that made the superbubble and the present starburst) occurred on an order-of-magnitude shorter timescale. These indications suggest that several starbursts had occurred in this years. It is not clear whether starbursts occurred intermittently or continously within years or shorter timescale. However, if you average over long timescale, say order of years, starburst in M82 seems occurring continuously, with the self-induced mechanism. This self-induced starburst would continue till most of the molecular gas is consumed by the star formation, blown away from the disk region of the galaxy, and/or is dissociated by strong UV radiation, and this timescale may correspond to the timescale of the whole starburst phenomena of years (e.g., Rieke, 1988; Heckman, 1998).
These self-induced/self-regulating mechanisms would be very important for other starburst galaxies. Recent optical spectroscopic and X-ray observations show that most of starburst galaxies have large-scale outflows (e.g., Lehnert & Heckman, 1996; Martin, 1998; Dahlem et al., 1998). Mid-infrared observations of starburst galaxies indicate that the timescale of most starbursts are years (e.g., Thornley et al., 2000; Vanzi et al., 1998). These results are consistent with those of M82, and strongly suggest that most of the starbursts would have experienced similar starburst evolution as M82.
5 CONCLUSIONS
Our new high spatial resolution 100 GHz continuum (i.e., free-free emission) image in the central region of M82 clearly shows that present starburst regions are strongly concentrated at the inner edge of the expanding molecular superbubble. The Lyman continuum photon numbers from the starburst regions (i.e., the strength of the starburst) are an order of magnitude larger than those in the active high-mass star forming regions in our Galaxy (NGC 3603 and W51) and nearby galaxies (IC 342 and M51).
The internal structure of the present superbubble, from the center, shows a red supergiant star cluster (“2.2 m secondary peak”), overpressurized hot thermal plasma or high energy electrons (diffuse hard X-ray emission), high velocity ionized gas (H41 and [Ne II]), shocked molecular gas (masers and SiO emission) and the present starburst regions (free-free emission), and the expanding molecular superbubble located furthermost outside. This structure and the physical properties of these objects/mediums suggest that the present starburst has been induced by the past starburst that made the superbubble, namely, self-induced starburst. The existence of kpc-scale outflows, a few hundred parsec-scale superbubble, and induced starburst inside the superbubble suggest that the starbursts in M82 have occurred several times in this years. Since the appearance of the starburst (e.g., outflows) in M82 is typical in other starburst galaxies, this starburst mechanism will be very important for the studies of other starburst regions/galaxies and galaxy formation.
References
- Achtermann & Lacy (1995) Achtermann, J. M., & Lacy, J. H. 1995, ApJ, 439, 163
- Alton et al. (1999) Alton, P. B., Davies, J. J., & Bianchi, S. 1999, A&A, 343, 51
- Arikawa et al. (1999) Arikawa, Y., Tatematsu, K., Sekimoto, Y., & Takahashi, T. 1999, PASJ, 51, L7
- Baudry & Brouillet (1996) Baudry, A., & Brouillet, N. 1996, A&A, 316, 188
- Bregman et al. (1995) Bregman, J. N., Schulman, E., & Tomisaka, K. 1995, ApJ, 439, 155
- Brouillet & Schilke (1993) Brouillet, N., & Schilke, P. 1993, A&A, 277, 381
- Carlstrom & Kromberg (1991) Carlstrom, J. E., & Kromberg, P. P. 1991, ApJ, 366, 422
- Chevalier (1974) Chevalier, R. A. 1974, ApJ, 188, 501
- Condon (1992) Condon, J. J. 1992, ARA&A, 30, 575
- Cottrell (1977) Cottrell, G. A. 1977, MNRAS, 178, 577
- de Grijs et al. (2001) de Grijs, R., O’Connell, R. W., & Gallagher, J. S., III 2001, AJ, 121, 768
- Dahlem et al. (1998) Dahlem, M., Weaver, K. A., & Heckman, T. M. 1998, ApJS, 118, 401
- Dietz et al. (1986) Dietz, R. D., Smith, J., Hackwell, J. A., Gehrz, R. D., & Grasdalen, G. L. 1986, AJ, 91, 758
- Downes et al. (1992) Downes, D., Radford, S. J. E., Guilloteau, S., Guélin, M., Greve, A., & Morris, D. 1992, A&A, 262, 424
- Draine (1989) Draine, B. T. 1989, in Infrared Spectroscopy in Astronomy, ed. B. H. Kaldeich (Noordwijk: ESTEC), 93
- Elitzur (1992) Elitzur, M. 1992, Astronomical Masers (Dordrecht: Kluwer)
- Elmegreen & Lada (1977) Elmegreen, B. G., & Lada, C. J. 1977, ApJ, 214, 725
- Förster Schreiber et al. (2001) Förster Schreiber, N. M., Genzel, R., Lutz, D., Kunze, D., & Sternberg, A. 2001, ApJ, 552, 544
- Förster Schreiber et al. (2003) Förster Schreiber, N. M., Genzel, R., Lutz, D., & Sternberg, A. 2003, ApJ, 599, 193
- Gallagher & Smith (1999) Gallagher, J. S., III, & Smith, L. J. 1999, MNRAS, 304, 540
- García-Burillo et al. (2001) García-Burillo, S., Martín-Pintado, J., Fuente, A., & Neri, R. 2001, ApJ, 563, L27
- Gaume & Mutel (1987) Gaume, R. A., & Mutel, R. L. 1987, ApJS, 65, 193
- Goss & Radhakrishnan (1969) Goss, W. M., & Radhakrishnan, V. 1969, Astrophys. Lett., 4, 199
- Griffiths et al. (2000) Griffiths, R. E., Ptak, A., Feigelson, E. D., Garmire, G., Townsley, L., Brandt, W. N., Sambruna, R., & Bregman, J. N. 2000, Science, 290, 1325
- Heckman (1998) Heckman, T. M. 1998, in ASP Conf. Ser. 148, Origins, ed. C. E. Woodward, J. M. Shull, & H. A. Thronson (San Fransisco: ASP), 127
- Joy et al. (1987) Joy, M., Lester, D. F., & Harvey, P. M. 1987, ApJ, 319, 314
- Jura et al. (1978) Jura, M., Hobbs, R. W., & Maran, S. P. 1978, AJ, 83, 153
- Kaaret et al. (2001) Kaaret, P., Prestwich, A. H., Zezas, A., Murray, S. S., Kim, D.-W., Kilgard, R. E., Schlegel, E. M., & Ward, M. J. 2001, MNRAS, 321, L29
- Kamphuis et al. (1991) Kamphuis, J., Sancisi, R., & van der Hulst, T. 1991, A&A, 244, L29
- Kennicutt (1983) Kennicutt, R. C. 1983, ApJ, 272, 54
- Kohno et al. (1999) Kohno, K., Kawabe, R., & Vila-Vilaró, B. 1999, ApJ, 511, 157
- Kuno & Matsuo (1997) Kuno, N., & Matsuo, H. 1997, PASJ, 49, 265
- Kronberg et al. (1985) Kronberg, P. P., Biermann, P., & Schwab, F. R. 1985, ApJ, 291, 693
- Lada (1992) Lada, E. A. 1992, ApJ, 393, L25
- Lehnert & Heckman (1996) Lehnert, M. D., & Heckman, T. M. 1996, ApJ, 462, 651
- Lester et al. (1990) Lester D. F., Carr, J. S., Joy, M., & Gaffney, N. 1990, ApJ, 352, 544
- Lynds & Sandage (1963) Lynds, C. R., & Sandage, A. R. 1963, ApJ, 137, 1005
- Martin (1998) Martin, C. L. 1998, ApJ, 506, 222
- Matsumoto & Tsuru (1999) Matsumoto, H., & Tsuru, T. G. 1999, PASJ, 51, 321
- Matsumoto et al. (2001) Matsumoto, H., Tsuru, T. G., Koyama, K., Awaki, H., Canizares, C. R., Kawai, N., Matsushita, S., & Kawabe, R. 2001, ApJ, 547, L25
- Matsuo et al. (1998) Matsuo, H., Kuno, N., Vila-Vilaró, B., Kashihara, H., & Kawabata, T. 1998, in Central Regions of the Galaxy and Galaxies, IAU Symp. 184, ed. Y. Sofue (Kluwer: Dordrecht), 143
- Matsushita et al. (2000) Matsushita, S., Kawabe, R., Matsumoto, H., Tsuru, T. G., Kohno, K., Morita, K.-I., Okumura, S. K., & Vila-Vilaró, B. 2000, ApJ, 545, L107
- McCall (1989) McCall, M. L. 1989, AJ, 97, 1341
- McCray & Kafatos (1987) McCray, R., & Kafatos, M. 1987, ApJ, 317, 190
- McLeod et al. (1993) McLeod, K. K., Rieke, G. H., Rieke, M. J., & Kelly, D. M. 1993, ApJ, 412, 111
- Miller & Scalo (1979) Miller, G. E., & Scalo, J. M. 1979, ApJS, 41, 513
- Miyoshi et al. (1995) Miyoshi, M., Moran, J., Herrnstein, J., Greenhill, L., Nakai, N., Diamond, P., & Inoue, M. 1995, Nature, 373, 127
- Nakai et al. (1987) Nakai, N., Hayashi, M., Handa, T., Sofue, Y., & Hasegawa, T. 1987, PASJ, 39, 685
- Neininger et al. (1998) Neininger, N., Guélin, M., Klein, U., García-Burillo, S., & Wielebinski, R. 1998, A&A, 339, 737
- Normandeau et al. (1996) Normandeau, M., Taylor, A.R., & Dewdney, P. E. 1996, Nature, 380, 687
- O’Connell & Mangano (1978) O’Connell, R. W., & Mangano, J. J. 1978, ApJ, 221, 62
- Ohyama et al. (2002) Ohyama, Y., et al. 2002, PASJ, 54, 891
- Okumura et al. (2000a) Okumura, S., Mori, A., Nishihara, E., Watanabe, E., & Yamashita, T. 2000a, ApJ, 543, 799
- Okumura et al. (2000b) Okumura, S. K., et al. 2000b, PASJ, 52, 393
- Ptak & Griffiths (1999) Ptak, A., & Griffiths, R. E. 1999, ApJ, 517, L85
- Puxley et al. (1989) Puxley, P. J., Brand, P. W. J. L., Moore, T. J. T., Mountain, C. M., Nakai, N., & Yamashita, T. 1989, ApJ, 345, 163
- Rieke (1988) Rieke, G. H. 1988, in Galactic and Extragalactic Star Formation, ed. R. E. Pudrits, & M. Fich, (Dordrecht: Kluwer), 561
- Rieke & Lebofsky (1978) Rieke, G. H., & Lebofsky, M. J. 1978, ApJ, 220, L37
- Rieke & Lebofsky (1979) Rieke, G. H., & Lebofsky, M. J. 1979, ARA&A, 17, 477
- Rieke et al. (1980) Rieke, G. H., Lebofsky, M. J., Thompson, R. I., Low, F. J., & Tokunaga, A. T. 1980, ApJ, 238, 24
- Rieke et al. (1993) Rieke, G. H., Loken, K., Rieke, M. J., & Tamblyn, P. 1993, ApJ, 412, 99
- Rubin (1968) Rubin, R. H. 1968, ApJ, 154, 391
- Sakai & Madore (1999) Sakai, S., & Madore, B. F. 1999, ApJ, 526, 599
- Satyapal et al. (1995) Satyapal, S., et al. 1995, ApJ, 448, 611
- Satyapal et al. (1997) Satyapal, S., Watson, D. M., Pipher, J. L., Forrest, W. J., Greenhouse, M. A., Smith, H. A., Fischer, J., & Woodward, C. E. 1997, ApJ, 483, 148
- Scoville et al. (2001) Scoville, N. Z., Polletta, M., Ewald, S., Stolovy, S. R., Thompson, R., & Rieke, M. 2001, AJ, 122, 3017
- Seaquist et al. (1994) Seaquist, E. R., Kerton, C. R., & Bell, M. B. 1994, ApJ, 429, 612
- Seaquist et al. (1996) Seaquist, E. R., Carlstrom, J. E., Bryant, P. M., & Bell, M. B. 1996, ApJ, 465, 691
- Seaquist et al. (1997) Seaquist, E. R., Frayer, D. T., & Frail, D. A. 1997, ApJ, 487, L131
- Shen & Lo (1995) Shen, J., & Lo, K. Y. 1995, ApJ, 445, L99
- Shopbell & Bland-Hawthorn (1998) Shopbell, P. L., & Bland-Hawthorn, J. 1998, ApJ, 493, 129
- Smith et al. (1978) Smith, L. F., Biermann, P., & Mezger, P. G. 1978, A&A, 66, 65
- Smith & Gallagher (2001) Smith, L, J., & Gallagher, J. S., III 2001, MNRAS, 326, 1027
- Solomon et al. (1992) Solomon, P. M., Downes, D., & Radford, S. J. E. 1992, ApJ, 387, L55
- Strickland et al. (1997) Strickland, D. K., Ponman, T. J., & Stevens, I. R. 1997, A&A, 320, 378
- Sugitani et al. (1989) Sugitani, K., Fukui, Y., Mizuno, A., & Ohashi, N. 1989, ApJ, 342, L87
- Sugitani et al. (1995) Sugitani, K., Tamura, M., & Ogura, K. 1995, ApJ, 455, L39
- Sunada et al. (1994) Sunada, K., Kawabe, R., & Inatani, J. 1994, Int. J. Infrared Millimeter Waves, 14, 1251
- Taylor et al. (2001) Taylor, C. L., Walter, F., & Yun, M. S. 2001, ApJ, 562, L43
- Telesco (1993) Telesco, C. M. 1993, in Infrared Astronomy, ed. A. Mampaso, M. Prieto, & F. Sánchez (Cambridge: Cambridge University Press), 173
- Telesco et al. (1991) Telesco, C. M., Campins, H., Joy, M., Dietz, K., & Decher, R. 1991, ApJ, 369, 135
- Tenorio-Tagle & Bodenheimer (1988) Tenorio-Tagle, G., & Bodenheimer, P. 1988, ARA&A, 26, 145
- Thornley et al. (2000) Thornley, M. D., Schreiber, N. M. F., Lutz, D., Genzel, R., Spoon, H. W. W., Kunze, D., & Sternberg, A. 2000, ApJ, 539, 641
- Tomisaka & Ikeuchi (1988) Tomisaka, K., & Ikeuchi, S. 1988, ApJ, 330, 695
- Tsuru et al. (1997) Tsuru, T. G., Awaki, H., Koyama, K., & Ptak, A. 1997, PASJ, 49, 619
- Tsutsumi et al. (1997) Tsutsumi, T., Morita, K.-I., & Umeyama, S. 1997, in ASP Conf. Ser. 125, Astronomical Data Analysis Software and Systems VI, ed. G. Hunt & H. E. Payne (San Francisco: ASP), 50
- Vacca et al. (1996) Vacca, W. D., Garmany, C, D., & Shull, J. M. 1996, ApJ, 460, 914
- Vanzi et al. (1998) Vanzi, L., Alonso-Herrero, A., & Rieke, G. H. 1998, ApJ, 504, 93
- Walter et al. (2002) Walter, F., Weiss, A., & Scoville, N. 2002, ApJ, 580, L21
- Watson et al. (1984) Watson, M. G., Stanger, V., & Griffiths, R. E. 1984, ApJ, 286, 144
- Weiss et al. (1999) Weiss, A., Walter, F., Neininger, N., & Klein, U. 1999, A&A, 345, L23
- Weliachew et al. (1984) Weliachew, L., Fomalont, E. B., & Greisen, E. W. 1984, A&A, 137, 335
- White & Long (1991) White, R. L., & Long, K. S. 1991, ApJ, 373, 543
- Wills et al. (2002) Wills, K. A., Pedlar, A., & Muxlow, T. W. B. 2002, MNRAS, 331, 313
- Wills et al. (1997) Wills, K. A., Pedlar, A., Muxlow, T. W. B., & Wilkinson, P. N. 1997, MNRAS, 291, 517
- Wills et al. (1999) Wills, K. A., Redman, M. P., Muxlow, T. W. B., & Pedlar, A. 1999, MNRAS, 309, 395
- Yamaguchi et al. (1999) Yamaguchi, R., Saito, H., Mizuno, N., Mine, Y., Mizuno, A., Ogawa, H., & Fukui, Y. 1999, PASJ, 51, 791
- Yun et al. (1994) Yun, M. S., Ho, P. T. P., & Lo, K. Y. 1994, Nature, 372, 530
| PeakaaPeak positions are indicated in Fig. 1. | R.A. | Dec. | bb100 GHz continuum flux at the peak positions. The beam size is (43 pc 36 pc at D = 3.9 pc; Sakai & Madore, 1999). uncertainty is 2.0 mJy beam-1. | ccProduction rates of Lyman continuum photons calculated with averaged over the beam size. uncertainties are photons s-1 for = 5,000 K, and photons s-1 for = 10,000 K. See text for details. | ddNumber of stars with their masses larger than 8 M⊙, assuming a mass function. uncertainties are for = 5,000 K, and for = 10,000 K. See text for details. | ||
|---|---|---|---|---|---|---|---|
| 69° | [mJy beam-1] | [photons s-1] | |||||
| (B1950) | (B1950) | ( = 5,000 K) | ( = 10,000 K) | ( = 5,000 K) | ( = 10,000 K) | ||
| A | 457 | 55′041 | 13.2 | ||||
| B | 444 | 55′018 | 12.3 | ||||
| C | 431 | 55′013 | 12.6 | ||||
| D | 426 | 54′581 | 23.1 | ||||
| E | 423 | 54′586 | 21.2 | ||||
| F | 416 | 54′583 | 20.2 | ||||
| G | 412 | 54′566 | 15.3 | ||||