Rotation Velocities of Two Low Luminosity Field Galaxies
Abstract
We present H rotation curves of two low luminosity field galaxies with -band absolute magnitudes and (for ; the large error bars reflect distance uncertainties). Most previously studied galaxies in this luminosity range are members of groups defined by brighter galaxies, but these two systems, selected from Blanton et al.’s (2004) sample of low luminosity galaxies in the Sloan Digital Sky Survey (SDSS), appear to have no bright companions. The measured rotation speeds at the outer extent of the H rotation curves, and , are larger than the values of and predicted by extrapolating the inverse Tully-Fisher relation of luminous SDSS galaxies to these faint luminosities. However, a previous HI measurement of the first galaxy shows that it has a gas mass similar to its stellar mass, and the total baryonic mass is consistent with that predicted by McGaugh et al.’s (2000) “baryonic Tully-Fisher relation.” We find -band dynamical mass-to-light ratios within the radii of the last H data points (about 1.8 disk scale lengths in each case) of and , much higher than the values expected for the stellar populations. The dynamical properties of these galaxies, including the rotation speeds and evidence for high gas fractions and dark matter domination within the luminous extent of the galaxy, are consistent with those of previously studied faint galaxies in nearby groups. Further studies of the SDSS sample will allow characterization of low luminosity galaxies over the full range of environments in which they reside.
1 Introduction
The Sloan Digital Sky Survey (York et al., 2000) galaxy redshift survey has an unprecedented combination of large area, depth, and photometric quality, thanks to the combination of a large format camera (Gunn et al., 1998), high throughput multi-object spectrographs (A. Uomoto et al., in preparation), careful calibration procedures (Fukugita et al., 1996; Hogg et al., 2001; Smith et al., 2002), and an efficient series of data reduction and targeting pipelines (Lupton et al., 2001; Stoughton et al., 2002; Strauss et al., 2002; Blanton et al., 2003a; Pier et al., 2003). Recently Blanton et al. (2004a, hereafter B04) have searched the SDSS Second Data Release (DR2; Abazajian et al. 2004a) to identify a population of extremely low luminosity field galaxies. With absolute magnitudes to (for the Hubble parameter adopted throughout this paper), this population represents a range of luminosities that has previously been accessible to systematic study only in the Local Group and in nearby groups and clusters.111The field galaxy survey of Schombert, Pildis, & Eder (1997), based on visual inspection of POSS-II plates and HI confirmation from Arecibo, includes some systems in this luminosity range. We have obtained H rotation curves of two of these objects, using the same methods that we are using for a study of the Tully-Fisher (1977, hereafter TF) relation of more luminous SDSS galaxies (J. Pizagno et al., in preparation, hereafter P04). Both objects appear to be “field” galaxies rather than satellites of brighter systems. Although the sample is small and the data quality limited, these measurements provide one of the first insights into the dynamical properties of this new population.
2 Observations
The galaxies in this paper were selected from the B04 sample according to their availability during an observing run for the P04 project. As detailed in B04 and Blanton et al. (2004b), this low luminosity galaxy sample has been checked for contamination by double stars, errors in the photometric pipeline’s automated deblending, and other complications that are unimportant for the great majority of SDSS galaxies but have a significant impact for low luminosity and low redshift systems. The two galaxies selected for follow-up observations were J123654.9+013654.2 and J091858.60+581407.7. For brevity, we will hereafter refer to these as Galaxy 1 and Galaxy 2, respectively.
Distances for galaxies in the B04 sample are estimated from their redshifts assuming Hubble flow and a model for the local peculiar field based on the IRAS 1.2-Jy redshift survey (Willick et al., 1997). Details of this procedure are described by Blanton et al. (2004b). Because these galaxies have low redshifts (heliocentric values of and , respectively), peculiar velocity uncertainties dominate the distance uncertainties, which in turn dominate the uncertainties in luminosity and dynamically inferred mass-to-light ratios in our discussions below. The Blanton et al. (2004b) procedure yields distances of and to Galaxies 1 and 2, for . The error bars are derived from the peculiar velocity probability function, which includes a local dispersion around the smooth velocity field predicted from the IRAS 1.2-Jy galaxies. The corresponding Petrosian -band absolute magnitudes are and (again for ). Neither galaxy has a bright neighbor () within 0.7 Mpc projected separation and redshift separation. Galaxy 1 is close to NGC 4536 in projection, but the redshift difference, vs. (Grogin, Geller, & Huchra, 1998), makes a physical association unlikely. We conclude that both of these objects are “field” galaxies rather than satellites of brighter parents.
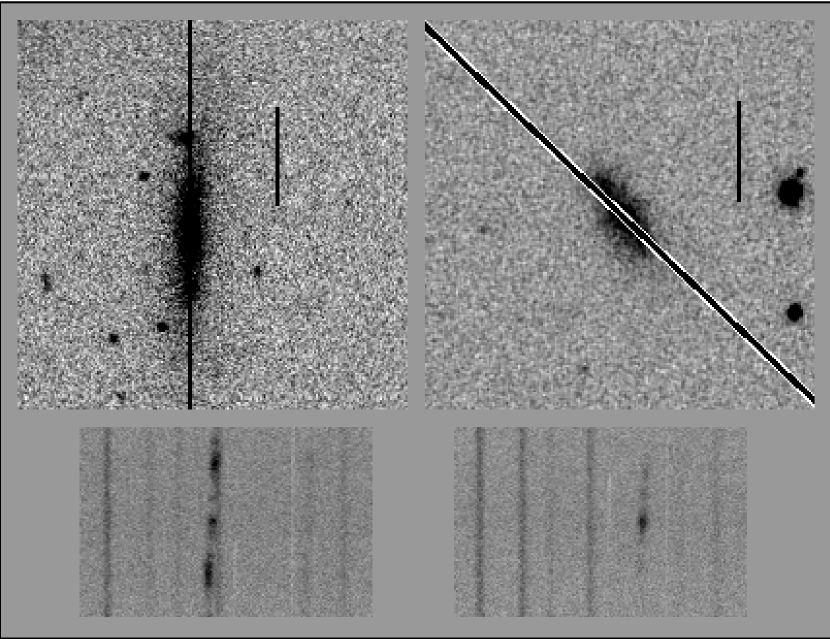
Table 1 lists the magnitudes, redshifts, and distances for Galaxies 1 and 2 along with the colors and axis ratios, exponential disk scale lengths, and rotation speed parameters described below. The top panels of Figure 1 show -band images from the SDSS. A search through the NASA Extragalactic Database (NED) shows an HI observation (from Matthews & van Driel 2000) for the galaxy FGC 1475, which can be identified as our Galaxy 1 on the basis of angular proximity ( difference between the NED and SDSS positions), similar axis ratios, and similarity between the Matthews & van Driel (2000) and SDSS redshifts.
Spectroscopic observations were made with the CCDS long-slit spectrograph, set up to observe redshifted H, at the 2.4 meter MDM telescope during the night of 13 April 2004. We used a slit width with a 600 lines/mm grating in the second order producing a 0.41 Å/pixel dispersion, and a spatial scale. The seeing during the night was .
The H emission lines typically had a total signal-to-noise ratio of , with an intensity weighted velocity centroid uncertainty of 8 km/sec. The dispersion axis was aligned to be perpendicular to the columns of the CCD to an accuracy of 0.1Å, as judged from the telluric lines. This alignment ensures that the H recession velocity is measured to the accuracy of the intensity weighted velocity centroids. The details of the data reduction and rotation curve extraction can be found in P04.
The bottom panels of Figure 1 show the linearized and flat-fielded spectra of both galaxies. Figure 2 presents the extracted rotation curve measurements as observed velocity relative to the continuum center vs. position along the slit in arc-seconds. Following Courteau (1997) and P04, we fit the rotation curve measurements with an arc-tangent function, which has a minimal number of free parameters while still describing the global shape of typical galaxy rotation curves quite well. Specifically, we use a Levenburg-Marquardt minimization routine (Press et. al., 1992) to fit the data with the functional form
| (1) |
where is the central velocity, is the asymptotic circular velocity, is the position along the slit, is the center of the rotation curve (where ), and is the turnover radius at which the rotation curve begins to flatten. The parameter uncertainties are derived from the covariance matrix returned by the Levenburg-Marquardt routine. For Galaxy 1, we allow all four parameters (, , , ) to vary. For Galaxy 2, the best-fit arc-tangent parameters have very large and , so that they effectively describe a straight line over the region covered by the data points. We therefore fit a straight line to the rotation curve instead of an arc-tangent function, simplifying the determination of best-fit parameters and uncertainties. Since Galaxy 2’s rotation curve is more extended on one side, we fix the line’s intercept such that the line goes through the location of the conintuum center at the center of mass velocity.
Figure 2 shows the arc-tangent and linear fits to the data points as smooth solid curves. For Galaxy 1, the outermost data points probe the turnover region of the rotation curve, while for Galaxy 2 they are still linearly rising. Clearly these data do not yield good constraints on the asymptotic circular velocity of a flat rotation curve. However, we find in P04 that the velocity defined by the value of the arc-tangent fit at the radius of the outermost data point often provides a useful measurement of rotation speed even when the observed rotation curve is still rising at this radius. In particular, we find that if we use as the measure of rotation speed in the TF relation, then the observed TF scatter does not increase significantly when we include galaxies that have rising rotation curves in the sample. While the value of is a lower limit to the asymptotic circular velocity, it can be much more robustly measured than from truncated rotation curves like those in Figure 2.
We correct for inclination by using the GALFIT program (Peng et. al., 2002) to fit inclined exponential disks to the -band galaxy images shown in Figure 1. The disk axis ratios and exponential scale lengths are listed in Table 1; formal uncertainties are in and in , though the systematic errors associated with assuming an exponential disk model are probably larger. The inclination corrected velocity is
| (2) |
where 0.19 is the assumed intrinsic axis ratio for an edge-on disk and is the measured -band axis ratio. Different ranges for the intrinsic axis ratio vary by 0.10 to 0.20 depending on galaxy type (Haynes & Giovanelli, 1984). We chose 0.19, typical for spiral galaxies, and note that the range in intrinsic axis ratios causes a small variation (typically 1) in . GALFIT yields a position angle for Galaxy 2 that differs from the SDSS DR2 value by ten degrees, consistent with the visual impression of slight misalignment in Figure 1. We therefore apply a small () correction to the measured assuming a tilted-ring model as described by Beauvais & Bothun (2001; see their eq. 3). Table 1 lists inclination-corrected values including this slit misalignment correction for Galaxy 2.
Matthews & van Driel (2000) report an HI velocity width for Galaxy 1 of , where the subscript indicates a correction for instrumental resolution. They do not give an error bar on , though the total signal-to-noise ratio of the HI line is 4.8, so the uncertainty in the width is probably not negligible. Kannappan, Fabricant, & Franx (2002) compare HI linewidths to optically measured, maximum rotation speeds and report a correlation
| (3) |
in units. Equation (3) predicts , compared to our measured value of . (Note that the inclination correction is negligible for this galaxy.) The two measurements thus appear to be consistent within the observational errors (allowing for a few percent uncertainty in the measured ), though the somewhat higher value inferred from the HI data could reflect a continuing rise of the rotation curve beyond the radius probed by our H measurements.
3 Discussion
How do our measured rotation speeds compare to expectations based on the TF relation defined by more luminous galaxies? In P04, we use a sample of 170 galaxies with to measure the forward ( vs. ) and inverse ( vs. ) TF relations in the SDSS bands. For the -band inverse relation, we fit
| (4) |
with and the constant chosen to yield minimal correlation between the errors in and . We find and , yielding predicted values of for Galaxies 1 and 2 of and , respectively. The uncertainties in and in the TF slope both contribute significantly to the errors on , and both contributions are non-linear. We have computed upper error bars by separately varying by and by and adding the corresponding values of in quadrature; we follow an analogous procedure for the lower error bar. The predicted rotation speeds are well below the measured values of and , though marginally compatible in the latter case because of the large observational errors. Dotted curves in Figure 2 show rotation curves with the same parameters as the solid curves but scaled by . Despite the uncertainties in the measurements, it is clear that the galaxies are rotating substantially faster than predicted by an extrapolation of the inverse TF relation to these faint magnitudes. To match the observed rotation speeds while maintaining the P04 normalization at would require an inverse TF slope of , compared to the slope of measured in the bright galaxy regime.
We can use our measurements to estimate dynamical mass-to-light ratios within the radius of the outermost H data point in each galaxy. We use the simple mass estimator
| (5) |
ignoring possible corrections for asymmetric drift or non-circular motions, which would be small compared to our observational error bars. The values of are 19 and 11 arc-seconds for Galaxies 1 and 2, respectively, corresponding to 1.7 and 1.8 times the exponential scale lengths measured by GALFIT. At our estimated distances of Mpc and Mpc, the physical values of are kpc (Galaxy 1) and kpc (Galaxy 2). We measure the fraction of -band light within for each galaxy and correct the values of in Table 1 accordingly, by 0.24 and 0.14 magnitudes. We do not apply any internal extinction corrections. Adopting , we find for Galaxy 1 and for Galaxy 2. Because and the fractional uncertainties in these quantities are substantial, we compute the upper error bar by separately varying by and by and adding the two changes in quadrature, and we follow an analogous procedure for the lower error bar. The value for Galaxy 1 is much higher than the value expected for a stellar population with the observed color of the galaxy (Bell et al., 2003), so this system is strongly dominated by dark matter within . The case for dark matter domination in Galaxy 2 is less clear because of the large uncertainty in , though the central value again corresponds to a large ratio of dark matter to stellar mass within . (The Bell et al. [2003] models imply a stellar mass-to-light ratio of for Galaxy 2’s color.) While all disk galaxies become dark matter dominated at sufficiently large radii, these low luminosity systems appear to have high dark matter fractions even within two disk scale lengths.
To put our measurements in the context of previous results, Figure 3 plots inclination corrected circular velocities against -band absolute magnitude for our galaxies (filled circles with error bars) and for galaxies with HI line widths and from Coté, Carignan, & Freeman (2000; open squares), Begum & Chengalur (2004; open circles), and HI line widths from Carignan & Freeman (1988; open triangle). For our galaxies, we use as the indicator of circular velocity, and we convert the (AB) -band luminosity to the (Vega) -band luminosity using the galaxy color and , obtained using the -correction code of Blanton et al. (2003b). For Coté, Carignan, & Freeman (2000) we use the value of listed in their tables, and for Begum & Chengalur (2004) and Carignan & Freeman (1988) we estimate visually from the plotted rotation curves. We have not attempted to put observational error bars on the literature data points because this would require a detailed assessment of the uncertainties in the distance measurements, which use a somewhat different method in each case. Coté, Carignan, & Freeman (2000) observe galaxies in the Sculptor and Centaurus A groups and assign group distances based on a variety of indicators (see Coté et al. 1997 and references therein). Begum & Chengalur (2004) assign both of their galaxies to the NGC 4696 group on the basis of proximity and adopt a distance based on the brightest stars (Huchtmeier et al., 2000). Carignan & Freeman (1988) use a combination of group assignment and brightest stars to infer the distance of DDO 154.
The solid line in Figure 3 shows the -band inverse TF relation extrapolated to the low luminosity regime. We convert the -band relation of P04 to -band using , appropriate for a galaxy with . Dotted lines show relations with the slope varied by . For bright galaxies, the intrinsic scatter about the mean relation is dex in (P04), smaller than the dex observational error bar on Galaxy 1. As noted earlier (on the basis of -band data), Galaxy 1 is rotating substantially faster than the extrapolated TF relation predicts, while the large error bar on leaves Galaxy 2 marginally consistent with the TF extrapolation. The rotation speed of Galaxy 1 appears reasonably in line with that of the other dwarf galaxies, while the rotation speed of Galaxy 2 is noticeably low, perhaps because the optical rotation curve is still rising steadily at our outermost data point. All of these systems are rotating faster than the TF extrapolation predicts; equivalently, they are fainter than predicted given their rotation speeds.
McGaugh et al. (2000) show that low luminosity galaxies are fainter than predicted by the (forward) TF relation defined by bright galaxies, consistent with the result shown in Figure 3. However, faint galaxies are often gas rich, and they show that adding the gas masses inferred from HI observations to the stellar masses leads to a linear relation between and over four decades in baryonic mass , extending down to a few . For our Galaxy 1, Matthews & van Driel (2000) report an HI flux integral of 1.24 Jy, which implies an HI mass to optical luminosity ratio of in -band, or roughly equal mass in neutral gas and stars. This ratio is below the median of found (in -band) by Pildis, Schombert, & Eder (1997), but within the range spanned by their data. Simply doubling the luminosity of Galaxy 1 and thus shifting it rightwards by 0.75 mag in Figure 3 would not move it onto the P04 inverse TF relation. However, McGaugh et al. (2000) find a steep slope for the (forward) baryonic mass TF relation, and the baryonic mass of inferred for Galaxy 1 at a distance of 9.9 Mpc agrees respectably with the value predicted by their fitted relation for , given the substantial error bars on both the predicted and measured values.
The luminosity-velocity relations and mass-to-light ratios of low luminosity galaxies offer clues to the role of supernovae and photoionization in regulating star formation, since these feedback effects are generally expected to be stronger in lower mass halos (see, e.g., Dekel & Silk 1986; Quinn, Katz, & Efstathiou 1996; Thoul & Weinberg 1996; Benson et al. 2002; Somerville 2002). The influence of feedback may be different in galaxies that are central objects of their parent dark matter halos and in galaxies that are satellites in more massive halos — semi-analytic models and hydrodynamic simulations predict systematically different properties for these two populations (Kauffmann, White, & Guiderdoni, 1993; Cole et al., 1994; Somerville & Primack, 1999; Berlind et al., 2003; Zheng et al., 2004). Most of the very low luminosity galaxies studied to date have been discovered or investigated because they are members of groups or clusters defined by brighter galaxies. The two galaxies studied in this paper are not satellites of bright neighbors, but their properties are roughly in line with those of satellite dwarfs. The B04 sample drawn from the SDSS provides the opportunity to study such faint galaxies in detail over the full range of environments in which they appear. Our present investigation represents a start on this broader program.
References
- Abazajian et al. (2004a) Abazajian, K., et al. 2004a, AJ, 128, 502
- Beauvais & Bothun (2001) Beauvais, C. & Bothun, G. 2001, ApJS, 136, 41
- Begum & Chengalur (2004) Begum, A. & Chengalur, J. N. 2004, A&A, 424, 509
- Bell et al. (2003) Bell, E. F., McIntosh, D. H., Katz, N., & Weinberg, M. D. 2003, ApJS, 149, 289
- Benson et al. (2002) Benson, A. J., Lacey, C. G., Baugh, C. M., Cole, S., & Frenk, C. S. 2002, MNRAS, 333, 156
- Berlind et al. (2003) Berlind, A. A., Weinberg, D. H., Benson, A. J., Baugh, C. M., Cole, S., Davé, R., Frenk, C. S., Jenkins, A., Katz, N., & Lacey, C. G. 2003, ApJ, 593, 1
- Blanton et al. (2003a) Blanton, M. R., Lupton, R. H., Maley, F. M., Young, N., Zehavi, I., & Loveday, J. 2003a, AJ, 125, 2276
- Blanton et al. (2003b) Blanton, M. R., et al. 2003b, AJ, 125, 2348
- Blanton et al. (2004a) Blanton, M. R., et al. 2004a, AJ, submitted, astro-ph/0410164 (B04)
- Blanton et al. (2004b) Blanton, M. R., et al. 2004b, AJ, submitted, astro-ph/0410166
- Carignan & Freeman (1988) Carignan, C. & Freeman, K. C. 1988, ApJ, 332, L33
- Cole et al. (1994) Cole, S., Aragon-Salamanca, A., Frenk, C. S., Navarro, J. F., & Zepf, S. E. 1994, MNRAS, 271, 781
- Coté, Carignan, & Freeman (2000) Coté, S., Carignan, C., & Freeman, K. C. 2000, ApJ, 120, 3027
- Coté et al. (1997) Coté, S., Freeman, K. C., Carignan, C., & Quinn, P. J. 1997, AJ, 114, 1313
- Courteau (1997) Courteau, S. 1997, AJ, 114, 2402
- de Blok, McGaugh, & Rubin (2001) de Blok, W. J. G., McGaugh, S. S., & Rubin, V. C. 2001, AJ, 122, 2396
- Dekel & Silk (1986) Dekel, A., & Silk, J. 1986, ApJ, 303, 39
- Fukugita et al. (1996) Fukugita, M., Ichikawa, T., Gunn, J. E., Doi, M., Shimasaku, K., & Schneider, D. P. 1996, AJ, 111, 1748
- Grogin, Geller, & Huchra (1998) Grogin, N. A., Geller, M. J., & Huchra, J. 1998 ApJS, 199, 277
- Gunn et al. (1998) Gunn, J. E., et al. 1998, AJ, 116, 3040
- Haynes & Giovanelli (1984) Haynes, M. P., & Giovanelli, R. 1984, AJ, 89, 758
- Hogg et al. (2001) Hogg, D. W., Schlegel, D. J., Finkbeiner, D. P., & Gunn, J. E. 2001, AJ, 122, 2129
- Huchtmeier et al. (2000) Huchtmeier, W. K., Karachentsev, I. D., Karachentseva, V. E., & Ehle, M. 2000, A&AS, 141, 469
- Kannappan, Fabricant, & Franx (2002) Kannappan, S. J., Fabricant, D. G., & Franx, M. 2002, AJ, 123, 2358
- Kauffmann, White, & Guiderdoni (1993) Kauffmann, G., White, S. D. M., & Guiderdoni, B. 1993, MNRAS, 264, 201
- Lupton et al. (2001) Lupton, R., Gunn, J. E., Ivezić, Ž., Knapp, G. R., Kent, S., & Yasuda, N. 2001, in ASP Conf. Ser. 238, Astronomical Data Analysis Software and Systems X, ed. F. R. Harnden, Jr., F. A. Primini, and H. E. Payne (San Francisco: Astr. Soc. Pac.), p. 269, astro-ph/0101420
- Marchesini et. al. (2002) Marchesini, D., D’Onghia, Chincarini, G., Firmani, C., Conconi, P., Molinari, E., & Zacchei, A. 2002, ApJ, 575, 801
- Matthews & van Driel (2000) Matthews, L. D., & van Driel, W. 2000, A&AS, 143, 421
- McGaugh et al. (2000) McGaugh, S. S., Schombert, J. M., Bothun, G. D., & de Blok, W. J. G. 2000, ApJ, 533, L99
- Peng et. al. (2002) Peng, C. Y., Ho, L. C., Impey C. D., Rix, H.-W. 2002, AJ, 124, 266
- Pier et al. (2003) Pier, J. R., Munn, J. A., Hindsley, R. B., Hennessy, G. S., Kent, S. M., Lupton, R. H., & Ivezić, Ž. 2003, AJ, 125, 1559
- Pildis, Schombert, & Eder (1997) Pildis, R. A., Schombert, J. M., & Eder, J. 1997, ApJ, 481, 157
- Press et. al. (1992) Press, W. H., Teukolsky, S. A., Vettering, W. T., & Flannery, B. P. 1992, Numerical Recipes (Cambridge: Cambridge Univ. Press)
- Quinn, Katz, & Efstathiou (1996) Quinn, T., Katz, N., & Efstathiou, G. 1996, MNRAS, 278, L49
- Schombert, Pildis, & Eder (1997) Schombert, J. M., Pildis, R. A., & Eder, J. 1997, ApJS, 111, 233
- Smith et al. (2002) Smith, J. A., et al. 2002, AJ, 123, 2121
- Somerville (2002) Somerville, R. S. 2002, ApJ, 572, L23
- Somerville & Primack (1999) Somerville, R. S., & Primack, J. R. 1999, MNRAS, 310, 1087
- Stoughton et al. (2002) Stoughton, C., et al. 2002, AJ, 123, 485
- Strauss et al. (2002) Strauss, M.A., et al. 2002, AJ, 124, 1810
- Thoul & Weinberg (1996) Thoul, A. A. & Weinberg, D. H. 1996, ApJ, 465, 608
- Tully & Fisher (1977) Tully, R. B., & Fisher, J. R. 1977, A&A, 54, 661
- Willick et al. (1997) Willick, J. A., Strauss, M. A., Dekel, A., & Kolatt, T. 1997, ApJ, 486, 629
- York et al. (2000) York, D. G. et al. 2000, AJ, 120, 1579
- Zheng et al. (2004) Zheng, Z., Berlind, A. A., Weinberg, D. H., Benson, A. J., Baugh, C. M., Cole, S., Davé, R., Frenk, C. S., Katz, N., & Lacey, C. G. 2004, ApJ, submitted, astro-ph/0408564
| Galaxy | b/a | ||||||||
|---|---|---|---|---|---|---|---|---|---|
| J123654.9+013654.2 | 16.11 | 0.41 | 594 | 11.2 | 0.20 | ||||
| J091858.60+581407.7 | 16.84 | 0.31 | 1157 | 6.2 | 0.40 |
Note. — Velocity units (for , , and ) are . Distances and absolute magnitudes are computed assuming , using a model of the local peculiar velocity field as described in the text. All the magnitudes are corrected for Galactic foreground extinction.