-SDSS Normal and Star-Forming Galaxies I: X-ray Source Properties of Galaxies Detected by in SDSS DR2
Abstract
We have cross-correlated X-ray catalogs derived from archival ACIS observations with a Sloan Digital Sky Survey (SDSS) Data Release 2 (DR2) galaxy catalog to form a sample of 42 serendipitously X-ray detected galaxies over the redshift interval . This pilot study will help fill in the “redshift gap” between local X-ray-studied samples of normal galaxies and those in the deepest X-ray surveys. Our chief purpose is to compare optical spectroscopic diagnostics of activity (both star-formation and accretion) with X-ray properties of galaxies. Our work supports a normalization value of the X-ray-star-formation-rate (X-ray-SFR) correlation consistent with the lower values published in the literature. The difference is in the allocation of X-ray emission to high-mass X-ray binaries relative to other components such as hot gas, low-mass X-ray binaries, and/or AGN. We are able to quantify a few pitfalls in the use of lower-resolution, lower signal-to-noise optical spectroscopy to identify X-ray sources (as has necessarily been employed for many X-ray surveys). Notably, we find a few AGN that likely would have been misidentified as non-AGN sources in higher-redshift studies. However, we do not find any X-ray hard, highly X-ray-luminous galaxies lacking optical spectroscopic diagnostics of AGN activity. Such sources are members of the “X-ray Bright, Optically Normal Galaxy” (XBONG) class of AGN.
1 Introduction
X-ray emission in galaxies has at a basic level two origins: gravitational potential energy release from accretion processes and thermal emission from hot gas. Accretion processes may be divided among three main systems: where a lower mass ( ), and correspondingly longer-lived ( Gyr), star accretes onto either a neutron star or black hole (low-mass X-ray binary; hereafter LMXB), where a higher mass ( ) and thus shorter-lived ( yr) star accretes onto a neutron star or black hole (high-mass X-ray binary; hereafter HMXB), and finally where accretion occurs onto a nuclear supermassive (106–108 ) black hole (active galactic nucleus; hereafter AGN). Hot gas is produced through a combination of stellar mass loss and supernovae, and this phase is often the dominant one in the interstellar media (ISM) of galaxies. Indeed, one of the more notable results in X-ray studies of galaxies was finding the expected interstellar-medium (ISM) component of elliptical galaxies (Forman et al., 1979). The ISM in ellipticals is largely invisible at radio and optical wavelengths and had for a time presented a mass-conservation problem given the expected output from stellar winds. The hot ISM in galaxies with younger stellar populations may be highly extended, as supernova and massive stellar winds give rise to large-scale outflows (superwinds; Heckman et al., 1990). For the moment ignoring AGN, it is thus expected that in early-type galaxies, with older stellar populations, we will find that X-ray emission is dominated by LMXBs and hot ISM. In late-type galaxies, we expect a mix of emission from hot gas, LMXBs, and HMXBs with starburst galaxies having a great amount of both hot gas and HMXBs. The hot gas component is typically X-ray soft (dominating at keV) whereas the X-ray binary emission is more X-ray hard (dominating the total X-ray emission at keV).
It appears that, as expected, the properties of X-ray binaries are correlated with star formation rate (hereafter SFR) in many nearby ( Mpc) galaxies studied intensively with Chandra (e.g., the X-ray Luminosity Functions of the binaries appear to obey scaling laws based upon SFR; Kilgard et al., 2002; Colbert et al., 2004). The total X-ray emission from binary systems may be written as a linear combination of the young population associated with SFR and the older population associated with stellar mass (i.e.,; David et al., 1992; Colbert et al., 2004). In galaxies with a higher ratio of SFR to stellar mass, where the LMXB component is expected to be negligible, the total X-ray luminosity may be dominated by HMXBs and it may be possible to use the total X-ray luminosity, neglecting other contributions, as an SFR indicator (e.g., Gilfanov et al., 2004a). Indeed, there have been indications that the total X-ray luminosity of a galaxy may serve as a star-formation diagnostic at higher redshift (, Mpc) (e.g., Grimm et al., 2003; Bauer et al., 2002). Of cosmological interest, it also appears that X-ray emission from distant Lyman Break galaxies may be similar to galaxies in the nearby Universe (e.g., Brandt et al., 2001; Seibert et al., 2002; Nandra et al., 2002; Reddy & Steidel, 2004).
The X-ray band holds much promise as an independent probe of SFR. For instance, it has been shown that one of the chief uncertainties in the determination of the power-law index of the Initial Mass Function (hereafter IMF) arises mostly from unresolved binary star systems (Kroupa, 2001). Theoretical models of the production of accreting X-ray binary systems, which are probed through X-ray observations of star-forming galaxies, are sensitively dependent upon properties of the binaries in galaxies (e.g. Sipior et al., 2004). It is thus possible that as both the models and the empirical X-ray/SFR relations improve we may develop a probe that is particularly sensitive to the binary populations in galaxies. Interesting conclusions regarding the evolution of the “binary IMF” have been discussed in Norman et al. (2004).
Constraining the X-ray/SFR relation requires understanding the X-ray components of galaxies that are not directly associated with current star formation. There have been fairly different approaches to this problem. For instance, Grimm et al. (2003) select galaxies with high ratios of SFR to stellar mass (hereafter SFR/M∗) claiming that they can then reject the LMXB component more easily. Grimm et al. (2003) claim that the - relation is linear only at higher SFR ( yr-1) where high-mass X-ray binaries (HMXBs) dominate the X-ray emission in galaxies. At lower SFR, they claim that the HMXB - relation becomes non-linear due to small number statistics (Gilfanov et al., 2004b). Four other groups have found that the - relation is linear from low to high SFR (Bauer et al., 2002; Ranalli et al., 2003; Colbert et al., 2004; Persic et al., 2004). Both Persic et al. (2004) and Colbert et al. (2004) include galaxies with lower SFR/M∗ values and make direct accommodation for the LMXB component. Additionally, Colbert et al. (2004) uses only the resolved point source population so that the hot gas and nuclear (AGN) component may be rejected. Persic et al. (2004) use X-ray spectral fits to reject emission from hot gas and AGN. Bauer et al. (2002), whose work is at higher redshift, select optical emission-line galaxies which do not show signs for AGN activity. The result is that there is also quite a spread in the normalization of the - relation; published values differ by approximately a factor of five. This difference appears to lie with the way in which one treats the LMXB and AGN X-ray “contamination” in the total X-ray luminosity of galaxies.
Understanding this relationship is also quite important for the study of distant galaxies, where AGN contamination may be much more difficult to constrain due to the dilution of AGN optical spectral features by the host galaxy light (e.g., Moran et al., 2002). High- classifications are also more difficult due to the inaccessibility of the H emission line, a useful discriminator between true absorption-line dominated (passive) galaxies and those which contain highly obscured AGN (e.g., Goto et al., 2003). There is even an extreme class of objects referred to as “X-ray Bright, Optically-Normal Galaxies” (XBONGS) which have optical absorption-line dominated spectra but very high hard X-ray luminosities (Comastri et al., 2002). Any census of AGN activity in the optical waveband must be concerned with the frequency of XBONG-type objects.
Systematic methods for separating X-ray-detected galaxies dominated by AGN emission from those dominated by starburst emission have recently seen a breakthrough with e.g., the Bayesian analysis of Norman et al. (2004). This work has allowed the first normal/starburst galaxy X-ray luminosity function to be constructed at and (Norman et al., 2004). There is clear (and expected) evolution in this XLF, which has a lognormal shape, similar to FIR luminosity functions. The evolution appears to be consistent with the expected evolution of SFR. As such high- normal galaxy XLF studies continue to improve, we may hope to detect subtle evolutionary differences between e.g., the X-ray and FIR in order to constrain e.g., X-ray binary evolution over long timescales. Such work critically depends upon a thorough understanding of the relative contributions of X-ray emission associated with SFR, AGN or quiescent populations in galaxies.
There remains a problem: there still is no suitable normal galaxy sample constructed in the nearby () Universe with which to make comparisons with high-redshift X-ray work (e.g., Hornschemeier et al., 2003; Norman et al., 2004). The observational expense of studying extremely local ( Mpc) galaxies to sufficient depth to probe both diffuse X-ray gas and the binary LF (down to erg s-1, thus reaching neutron-star binaries) is great; exposures of ks are typically required. Currently there are no sufficiently large ( galaxies) samples complete in any particular observational property (optical magnitude and/or morphology, starburst properties like the ratio of SFR/mass, etc.). Also, while the range of SFR sampled in X-ray-SFR studies to date has been quite large, it has in some cases been heavily biased towards higher star-formation rates (SFR). The studies aforementioned have typical average SFRs of M⊙ yr-1, going up to M⊙ yr-1. This makes probing the possible transition to non-linear - quite difficult. Also, there have been heterogeneous methods used to measure stellar mass and SFR. For instance, Grimm et al. (2003) were forced to use approximately 10 separate FIR studies of nearby galaxies in order to derive SFRs, and for the same galaxies the FIR flux estimate often differed by factors of several. Reliable UV, H, and radio SFR estimates are not always available for the same galaxy. This is expected to change dramatically with well-observed nearby-Universe samples such as the Spitzer Infrared Nearby Galaxies Survey (Kennicutt et al., 2003). Finally, there is some concern about “distance-distance” biases introduced by the large range in distances sampled by some of these studies. For instance, many studies place high- galaxies () from the Deep Fields on the same correlation fits as galaxies in the nearby Universe ( Mpc). However, strong bias is only expected when the range in flux is quite small whereas the distance range is large; for most studies this is not a serious problem.
It is thus critical to observe galaxies with moderate SFR values (–10 M⊙ yr-1) as well as galaxies with no evidence for current star formation. Since the observational challenge at higher redshift is separating the type-2 AGN from the normal/star-forming galaxies, low-to-moderate luminosity type 2 AGN should also be included. The sample should have uniformly measured SFRs and stellar masses and some highly accurate diagnostic of accretion activity. With these requirements in mind, we have turned to the Sloan Digital Sky Survey (SDSS) Data Release 2 (DR2) catalog and the X-ray Observatory archive to search for a sample of X-ray-detected galaxies near . DR2 is the second major survey-quality data release of the SDSS (April 2004; Abazajian et al., 2003).
At the space density of galaxies with reaches deg-2, so that one would expect galaxies in each ACIS-I field of view (). The SDSS is covering ,000 square degrees to this optical depth. The typical SDSS galaxy redshifts () are local enough to provide a calibration sample for the high-redshift studies of galaxies. We are working towards providing the missing calibration of the X-ray properties of galaxies at by studying a uniform sample of SDSS galaxies with serendipitous detections.
The major advantage of the SDSS is its uniformity; all galaxies have been observed with the same telescope and spectrograph; there is no ambiguity about optical filters or other calibration issues. The spectroscopic coverage of galaxies in the SDSS DR2 over its ,600 square degree area is complete down to (Stoughton et al., 2002). has the sensitivity to reach galaxies with (typical of e.g., luminous dusty starbursts, Alexander et al. 2002) in the 0.5–2 keV band at with 40 ks of ACIS exposure.111The magnitude here is the SDSS -band filter. Thus the depths of coverage of many ACIS observations should be sufficient to place significant constraints on the galaxies with SDSS spectra.
Our work on individually X-ray detected SDSS galaxies is quite complementary to existing work. There have been some initial promising results on spiral galaxies from statistical analysis of galaxies (not individually detected) using a combination of shallow ( ks) observations and the 2dF redshift survey (Georgakakis et al., 2003). Georgakakis et al. (2004) have also carried out a focused program to identify optically bright, X-ray faint objects which are typically quiescent galaxies (e.g. Hornschemeier et al., 2003), reporting on constraints on X-ray galaxy number counts at bright X-ray fluxes using SDSS and . Our study only selects against Type-I AGN and unresolved sources, we make no exclusion of sources with higher X-ray-to-optical flux ratios (which may include some dusty starburst galaxies and higher-mass elliptical galaxies). Our focus on optically selected, individually X-ray detected galaxies also complements other serendipitous programs which are driven by X-ray selection and naturally favor AGN (e.g., the Multiwavelength Project, ChaMP; Green et al., 2004).
The purpose of this paper is to compare optical activity diagnostics such as emission-line ratios with the X-ray properties of galaxies. The ultimate goal of our studies will be to assemble a complete field galaxy sample; this paper is a pilot study which works towards that ultimate goal (in fact, although we avoid cluster centers, a significant fraction of the galaxies are in cluster environments). Our chief emphasis is on the X-ray/SFR relation, but we also explore the X-ray properties of quiescent galaxies and AGN. A future paper will cover the normal galaxy SDSS XLF.
The cosmology assumed in this paper is km s-1 Mpc-1, , .
2 Sample Construction
2.1 X-ray data
Our primary goal is to characterize the X-ray emission from star-forming (non-AGN) galaxies in the SDSS DR2 database. To accomplish this, we require sensitivity to detect such galaxies at the median SDSS redshift of . We only consider observations of at least 30 ks, which ensures that we reach 0.3–8 keV X-ray luminosities of erg s-1(assuming ). Based on the Ranalli et al. (2003) SFR/X-ray relation, which is for the total X-ray luminosity, this would correspond to a SFR sensitivity of at least 6 yr-1. observations significantly shorter than this would not be useful for our purposes.
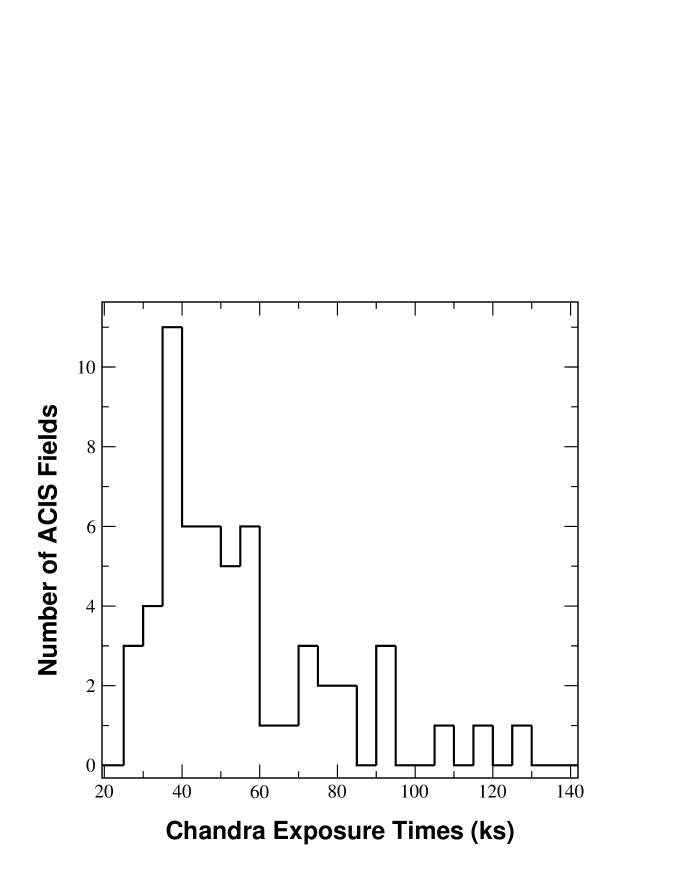
We queried the archive for ACIS non-gratings observations of at least 30 ks depth as of May 2004. We then used various SDSS cross-correlation and finding chart tools (publicly available through the main SDSS website222The SDSS SkyServer website is http://cas.sdss.org/. to ascertain that 53 fields fell within the SDSS DR2 spectroscopic footprint. Figure 1 gives the distribution of exposure times for these 53 fields; 24 of the fields had X-ray detected SDSS galaxies in them.
These 53 X-ray datasets were reduced using the XASSIST333See http://xassist.pha.jhu.edu suite of software tools (Ptak & Griffiths, 2003). XASSIST uses the basic data reduction steps recommended by the CXC “threads.” The data are reprocessed to level 2 event files starting from the level 1 events and useful auxiliary products such as exposure maps are created. The optional 0.5 pixel position randomization was not performed. After reprocessing, each CCD is treated as a different detector and individual CCD data are processed separately. For data processing, PI values were constrained to be in the range 14–548, corresponding to the energy range 0.3–8.0 keV.
Sources are detected using the CIAO routine WAVDETECT (Freeman et al., 2002), with the detection probability set at . Background flares were removed by fitting the background light curve with a constant and excluding times where the background level deviated by more than 10 from the mean (such a conservative limit was chosen since the background is typically negligible for point-like Chandra sources). An image extracted for each source was then fit with an elliptical Gaussian model plus sloping background model using Poissonian statistics (i.e., the Cash “C” statistic). This provides an improved estimate of the extent and total count rate. The significance of each source is then re-assessed based on the total source counts and local background derived from the spatial fit. Sources with Poisson probabilities below the 95% level are deleted from the source list. Response matrices are then created for each source to estimate the source flux assuming a power-law model with and the Galactic value at the local of the source (determined using the FTOOL “nh”). We then visually inspected the sources to look for problems such as proximity to CCD chip gaps (resulting in some re-processing) and/or proximity to bright X-ray sources (a few sources were rejected).
As a sanity check, we compared the X-ray catalog produced by XASSIST with the published X-ray catalog for the Deep Field-North (CDF-N Alexander et al., 2003), and found that of the 160 X-ray sources identified by XASSIST, 138 have matches in the deeper CDF-N catalog. The ones that do not have matches in many cases show signs of X-ray variability with higher S/N in the individual shorter observations. The astrometry in the two catalogs matched to within 5. This offset may easily be explained as the difference between the astrometric corrections of Alexander et al. (2003) and our “raw” coordinates.
2.2 Optically-derived Galaxy Parameters from SDSS DR2
The X-ray observed galaxies in this sample were drawn from the SDSS DR2 ‘main’ galaxy sample (Strauss et al., 2002). Details concerning the spectral characterization (emission-line measurement, etc.), stellar mass estimation, and star-formation rate estimates may be found in Kauffmann et al. (2003b), Kauffmann et al. (2003a), Brinchmann et al. (2004b) and Tremonti et al. (2004). These high-quality measurements were made for 211,894 galaxies and are now publicly available (a synopsis of the data products and of the project is given in Brinchmann et al., 2004a, hereafter “the SDSS DR2 sample”). This group made made a number of improvements over the standard SDSS spectroscopic pipeline in e.g., emission-line flux measurements from continuum-subtracted spectra.
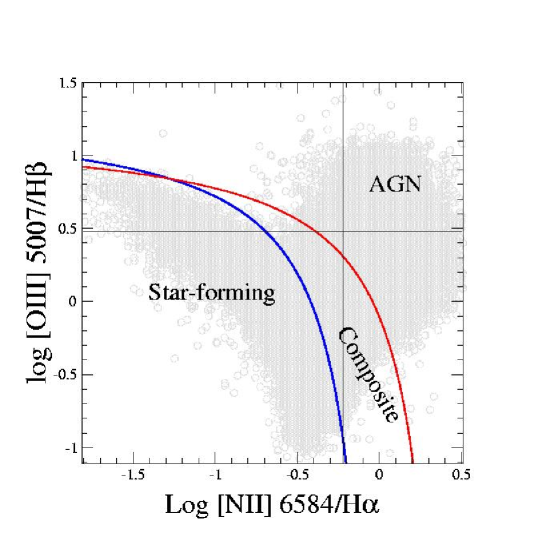
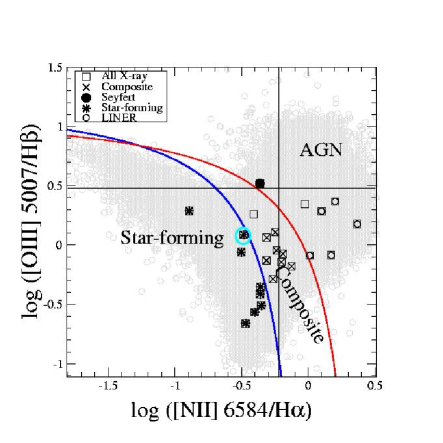
The standard emission-line ratios (e.g., and ) were used to characterize the galaxy spectra; such line ratio diagrams are often referred to as “BPT diagrams” after Baldwin, Phillips, & Terlevich (1981). Higher values of () generally indicate AGN activity, with discriminating between Low Ionization Nuclear Emission-line Regions (LINER; Heckman, 1980) and Seyfert-type objects (LINERs have ). Kauffmann et al. (2003a) have suggested two lines of demarcation (see Figure 2) between AGN and starburst galaxies in the BPT diagram which broadly separate galaxies into three classes: AGN, star-forming galaxies, and AGN/star-forming composites. The top line is the theoretical upper bound for starburst galaxy emission-line ratios from Kewley et al. (2001). Galaxies with values to the right (above) this line in the BPT diagram are expected to have appreciable contribution from an AGN to their emission-line flux. The second boundary, below which AGN activity is not expected and galaxies are typically star-forming galaxies, is a modified version of the Kewley et al. (2001) line given by (Kauffmann et al. 2003a; see Figure 2). The optical classification of galaxies between these lines is AGN-starburst “composite”. Composite galaxies are expected to have % of their [OIII] luminosity density and % of their H luminosity density arising from an AGN (Brinchmann et al., 2004b).
One problem encountered in any star formation study is that the SFR cannot be measured directly. A large number of star formation indicators have been theoretically or empirically calibrated at wavelengths ranging from the UV to the radio. In this work we adopt the total (i.e. aperture-corrected) SFRs of Brinchmann et al. (2004b). These SFRs are derived from the optical nebular lines (principally H) for galaxies classified as star-forming, and from the 4000Å break for galaxies classified as AGN. The majority of previous X-ray/SFR studies have relied on far-infrared (FIR) SFR estimates. However, Kewley et al. (2002) demonstrated that H and FIR SFR estimates agree to 10% when proper account is made for attenuation.
For a full description of the SFRs the reader is referred to Brinchmann et al. (2004b); we briefly summarize the methodology here. The star formation rate within the SDSS fiber apertures is estimated from the strong optical emission lines ([OII], [OIII], H, H, [NII], [SII]) using a Bayesian approach and a grid of nebular models (Charlot & Longhetti, 2001). The SFR is estimated simultaneously with the metallicity, ionization parameter, dust attenuation, and dust-to-metal ratio in order to account for variations in the unattenuated H/H ratio and the conversion between H luminosity and SFR. This approach differs from the standard Kennicutt (1998) translation between H and SFR but there is good agreement in the mean conversion factor (see Figures 7 and 8 of Brinchmann et al. 2004b). For galaxies harboring an AGN, the SFR in the fiber is estimated from the D4000 spectral index, a measure of the 4000 Å break. This secondary SF indicator is calibrated consistently from the star-forming galaxy sample. Because the SDSS fibers only encompass /3 of the galaxy light, the SFRs must be aperture corrected. The galaxy colors outside of the fiber aperture are used to estimate this correction. Brinchmann et al. (2004b) adopt a Kroupa IMF (Kroupa, 2001). To convert to a Salpeter (1955) IMF between 0.1 and 100 , one would multiply the Brinchmann SFRs by a factor of 1.5. In this paper we correct the SFRs of our comparison sample (see §2.3) to the Kroupa IMF.
2.3 SFR measurements of the comparison studies
There are five studies which we compare in this work (in order of discussion): Colbert et al. (2004), Persic et al. (2004), Bauer et al. (2002), Ranalli et al. (2003) and Grimm et al. (2003). All of the SFR measurements may be traced back to the FIR-SFR calibration of Kennicutt (1998), which is based upon the “standard” Salpeter IMF discussed above. However, in this section we aim to quantify the differences and uncertainties in order to uncover any real disagreement among the various X-ray/SFR relations.
Colbert et al. (2004) and Persic et al. (2004) used Kennicutt (1998) FIR-SFR conversions. However, both made some additional correction to the IRAS FIR luminosity. Colbert et al. (2004) added the ultraviolet luminosity to the IRAS FIR luminosity to produce a “corrected” FIR luminosity (which is higher than the directly measured FIR by up to a factor of 2) and then apply a bolometric correction of a factor of 1.4 (thus their FIR luminosities may be up to 40% higher than IRAS FIR luminosities). Persic et al. (2004) note that at lower SFR, non-SF-related emission such as cirrus may be present and use the -band luminosity to make this correction (a “minor” 14% correction). Therefore, both these studies (Colbert and Persic) are based upon IRAS fluxes with a 14–40% correction factor applied.
Ranalli et al. (2003) used the Kennicutt (1998) FIR-SFR conversion (based upon the standard Salpeter IMF) and the Condon (1992) radio-SFR conversion. Inspection of the Ranalli equations indicates consistency with the Kennicutt (1998) calibration despite the Condon (1992) radio-SFR conversion factor being for high-mass stars ( ) rather than for the more inclusive mass range for the Salpeter IMF (0.1–100 ).
Bauer et al. (2002) use the radio-SFR relation of Yun et al. (2001), who derive the FIR-radio correlation and then use the Kennicutt (1998) FIR-SFR relation to derive a radio-SFR conversion. The Yun et al. (2001) SFR-radio normalization is lower than the Condon (1992) normalization in the sense that Yun predicts less radio emission per unit SFR by a factor of . Since the Yun SFRs are for the standard Salpeter IMF over a 0.1–100 interval but the Condon (1992) SFRs are for a narrower mass interval ( only), this difference in the calibration of the 1.4 GHz estimator is as expected. Thus, Bauer et al. (2002) uses a 1.4 GHz estimator that appears consistent with the rest of the FIR measures and with the standard Salpeter IMF.
Grimm et al. (2003) is somewhat more difficult to compare with the others. The FIR-SFR conversion used is the same Kennicutt (1998) conversion used by the others, but their measurements are much more heterogeneous than the other authors. Grimm et al. (2003) have searched the literature for SFR measurements in nearby galaxies at H, ultraviolet, FIR, and radio wavelengths. The H-SFR conversion they use, from Rosa-González et al. (2002), is 40% higher than Kennicutt (1998) in the sense that the derived Grimm SFRs would be higher using the Rosa-González et al. (2002) value. The radio conversion they use is from Condon (1992), but they use the thermal radio-SFR conversion factor rather than the non-thermal (which are different by an order of magnitude). There appear to be relatively few radio measurements in the Grimm paper, so this appears not to matter. Thus it appears that H measurements could result in SFR measurements that are up to 40% higher than the other authors, but these are not always used in their estimates.
2.4 -SDSS source matching
In the 53 ACIS fields there are 338 “well-observed” SDSS DR2 galaxies with . Our definition of well-observed is that covered at least 95% of the galaxy’s 50%-encircled light radius (we use the Petrosian 50% encircled-light radius in the -band) and that the galaxy was observed at a off-axis angle . Including galaxies with off-axis angles larger than resulted in few additional detections.
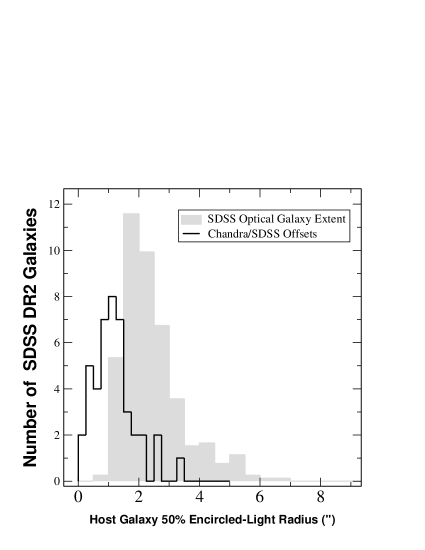
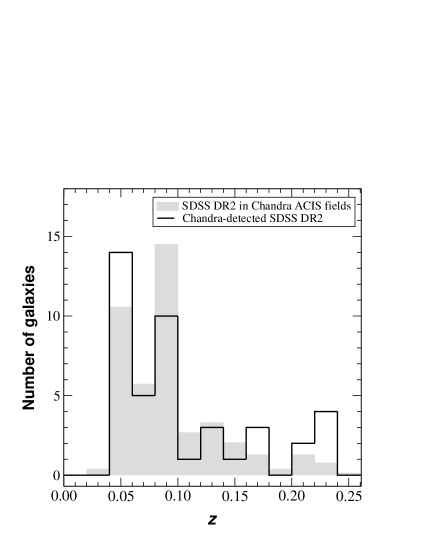
The SDSS astrometry is excellent (5) and as mentioned in § 2.1, the X-ray positions from XASSIST are accurate to better than . The optical extent of the SDSS galaxies was typically larger than either of these two positional errors (the median galaxy radius was 2; see Figure 3a). SDSS galaxies were considered matched to an X-ray source if the X-ray source position was within the optical 50% encircled-light radius (we used the Petrosian radius in the -band). We found that 42 galaxies contained X-ray detections and the X-ray detections were typically well within the optical galaxy extent (see Figure 3a). None of these 42 sources were the primary target of the X-ray observation but there is clearly some bias towards cluster members, as indicated in the redshift distribution in Figure 3b. We randomly offset the SDSS galaxy source positions by 20′′ and 30′′ to evaluate the false-match probability and found that false match is expected among the 42 galaxies. The X-ray and optical properties of these 42 galaxies are given in Table 1, including the X-ray fluxes, redshifts, absolute magnitudes, and optical spectroscopic classifications. The X-ray source SDSS spectra and images are shown in Figure 4. The median number of 0.5–8 keV X-ray counts per source is just 18.2, so we do not present X-ray spectroscopic results in this paper.
We have examined these sources carefully to ascertain that they are not affected by instrumental problems such as proximity to a chip gap in the ACIS camera and/or proximity to any bright X-ray source. The Galactic column density along the various lines of sight to these galaxies are fairly low, the maximum is cm-2, the mean and standard deviation is cm-2. X-ray fluxes are corrected for Galactic absorption.
There are published results on 37 X-ray-detected normal and starburst galaxies in the CDF-N (Hornschemeier et al., 2003) so we again used this field to test our results. These 37 CDF-N X-ray detected galaxies are typically at higher redshifts and thus below the optical flux limit of SDSS (median mag). Three of the four SDSS DR2 galaxies in this field were X-ray undetected in our sample (which did not use the full combined depth of the CDF-N). One additional source is detected in the full 2 Ms depth of (Hornschemeier et al., 2003) and the final two were at large off-axis angles where the effective exposure time is low. This illustrates that the extreme depth of the CDF-N is not necessary for this kind of lower redshift work and also shows the necessity of building up large areal coverage to probe the relatively sparse galaxy population at .
3 Results
3.1 Optical Galaxy Classification
The majority of the -detected SDSS DR2 galaxies are “emission-line” galaxies but the precise number depends upon the significance cutoff used for the emission line flux. Note that all classifications are based upon continuum-subtracted spectra and that the optical spectroscopic apertures typically cover % of the host galaxy.
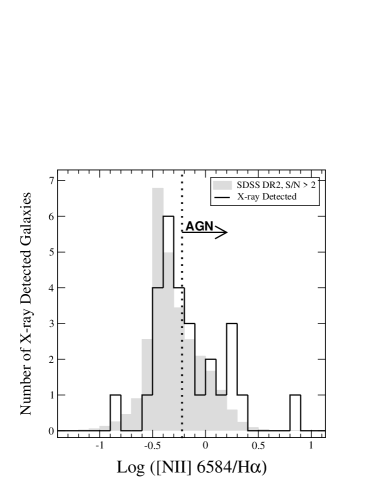
The emission-line ratios for both the X-ray detected galaxies and the full SDSS DR2 galaxy sample are shown in Figure 5a and their classifications based upon those ratios are given in Table 2. Galaxies are classified if they have all four emission lines ([OIII], H, [NII], H) detected at ; there are 24 galaxies matching this criteria (see Table 2). It is also possible to use the ratio alone (see Figure 5b) as a coarse AGN discriminator; this yields an additional 3 emission-line galaxies, all of which are classified as AGN. Note that at high-redshift, H would be unobservable so these galaxies would likely have been misclassified.
There are thus 24 emission-line galaxies (ELGs), three lower-significance ELGs (with only [NII] and H detected above ), and 15 galaxies which appear to be absorption-dominated to fairly strict limits.
3.2 X-ray/SFR Correlations
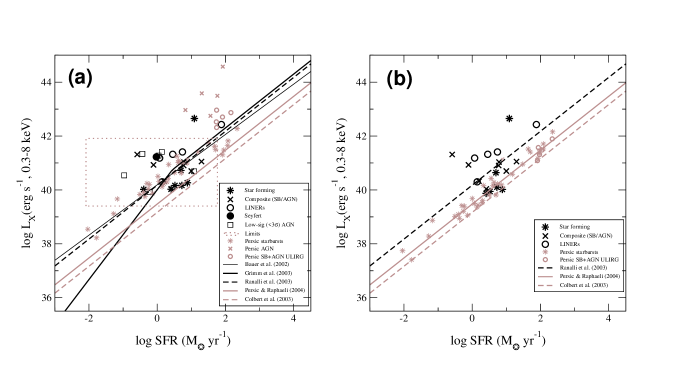
In Figure 6 we show the total integrated X-ray luminosity in the 0.3–8 keV band for the -detected ELGs plotted against SFR as measured by Brinchmann et al. (2004b). We also show the correlations between SFR and X-ray emission found by several other authors. We have adjusted these various correlations to the 0.3–8 keV bandpass. We assumed a power-law for conversion; the correction is a factor of from the 2–8 keV bandpass to the 0.3–8 keV bandpass. In Section 2.3 we describe the various SFR measurements used by these other authors; their methods yield differences of up to 50% in SFR. In Figure 6 we divide the SFRs from the comparison studies (Colbert, Persic, Grimm, etc.) by a factor of 1.5 to account for the Kroupa IMF. The Colbert SFRs were additionally divided by a factor of 1.4 to remove the bolometric correction over SFRs derived purely from IRAS fluxes.
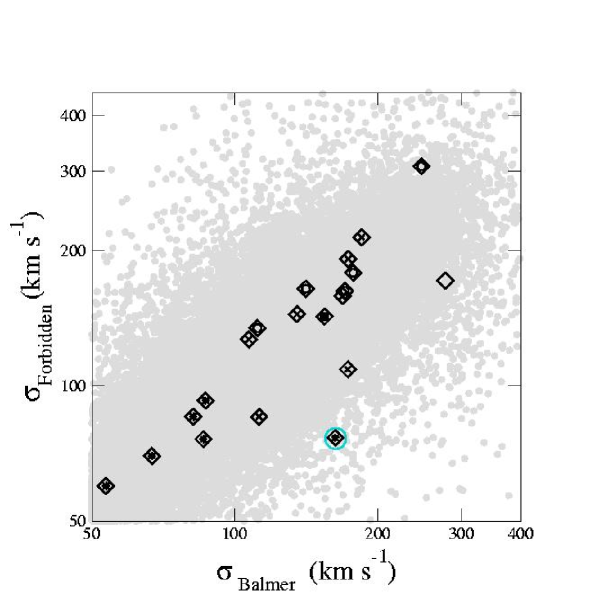
There are seven pure “star-forming” galaxies in our sample based upon emission-line ratio diagnostics alone. There is one clear outlier among the X-ray-detected “star-forming” galaxies in Figure 6 (X102348.48+040552.4; it is marked in cyan in the BPT diagram of Figure 5) that has a much higher X-ray luminosity than is expected based upon its SFR. Inspection of its optical spectrum reveals that it is a Narrow-Line Seyfert 1 (NLS1; see Figure 4). If one compares the width of the Balmer lines in this spectrum with the widths of the forbidden lines, the Balmer width is found to be much larger. Thus while optical emission line ratio diagnostics are fairly good at separating AGN from star-forming galaxies, we find that the additional information afforded by line widths is quite critical. We have plotted the Balmer vs. forbidden line widths for all the emission-line galaxies in Figure 7. As can be seen, there are only three other sources with Balmer widths that are appreciably larger than the forbidden line widths; these three are composite galaxies (or deemed to be low signal-to-noise AGN).
Correcting for the likely LMXB contribution using the stellar mass estimates from Kauffmann et al. (2003a) and the LMXB mass constant of Colbert et al. (2004) brings five of the six remaining star-forming galaxies into agreement with the Persic et al. (2004) line; one of these has such a low SFR that all of its X-ray emission is explained by LMXB emission (it thus does not appear in the second panel of Figure 6. There remains only one “star-forming” galaxy besides the NLS1 that has a higher value of X-ray emission than expected from the Colbert relation. This galaxy, X150944.45+570434.5, is in a particularly clean field (there is a QSO in the field, but no large scale structure, etc.). The source has no detected 2-8 keV counts and thus does not show evidence for harboring an AGN.
3.3 Galaxies with Absorption-line Dominated Optical Spectra
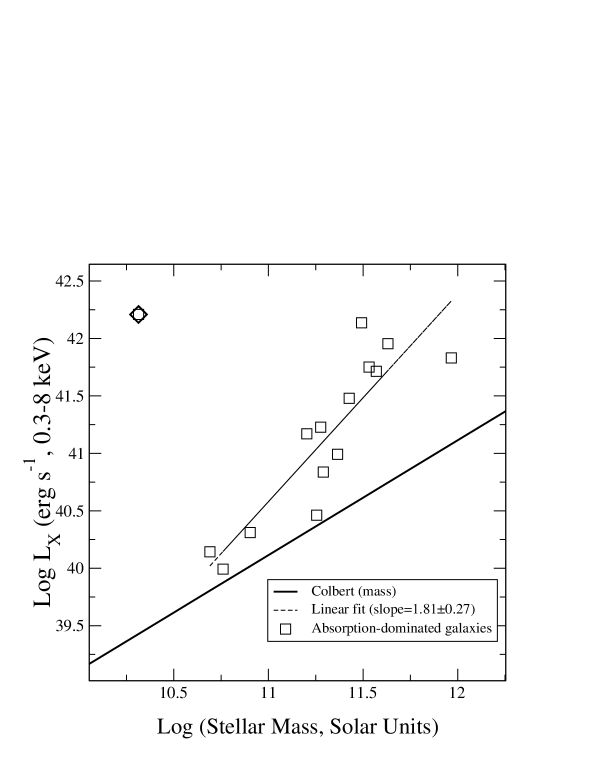
There are 15 galaxies which lack emission lines at the 2 level. Expecting that these galaxies do not have much current star-formation, we plot their total X-ray luminosities versus their host galaxies’ stellar masses (Figure 8; the masses are the medians of the probability distributions of dust-corrected mass for each galaxy from Kauffmann et al., 2003b). The total X-ray luminosities exceed that expected from X-ray binaries alone. The -mass relation is consistent with the – relation of Fabbiano et al. (1992) which was attributed to the X-ray emission from hot gas in galaxies.
The spectrum of the one outlier in the absorption-dominated galaxy X-ray/mass plot, X171206.83 640830.7, does not show any sign of AGN emission (see Figure 4) and has been previously reported as a post-starburst galaxy by Davis et al. (2003). The X-ray emission is extremely soft (, see Figure 9) and the X-ray luminosity is quite high ( erg s-1) but the source is detected in the 2–8 keV band as well with erg s-1(2–8 keV). There is no detected SFR within the aperture (no H emission) and the estimated current SFR for the entire galaxy is 0.6 yr-1, with a 97.5% upper limit at yr-1 (Brinchmann et al., 2004b). The contribution from either an evolved component or current star-formation to the hard X-ray luminosity is estimated to be . Davis et al. (2003) indicate that this source may be variable, having declined in soft X-ray flux by a factor of several since observations in 1993 and 1994; they therefore suggest that this source is either an AGN or a bright Ultra-Luminous X-ray source (ULX; e.g., Colbert & Ptak, 2002). Our continuum-subtracted optical spectra place strong constraints on the AGN nature of this object (we do not detect any AGN signature) and if the lack of emission lines were due to obscuration, we might have expected to see evidence in the X-ray spectrum, which we do not (see Figure 9). So we explore the post-starburst nature of this object in more detail.
Kauffmann et al. (2003b) calculate burst mass fractions for such galaxies. The median of the mass fraction distribution indicates that 10% of the mass was produced in a burst, corresponding to . However, as noted in Kauffmann et al. (2003b), there is an age/mass degeneracy: a large burst that occurred long ago is indistinguishable from a smaller burst that occurred more recently. The distribution of the mass fraction actually extends from zero to 65%, the zero case corresponds to the stellar mass having been formed a long time ago (Gyr). We adopt the median value of 10% acknowledging that there is some significant uncertainty.
Sipior et al. (2004) model the X-ray binary population resulting from a 10 yr-1 starburst lasting 20 Myr; the 2–10 keV luminosity of such a burst has a peak near erg s-1 10 Myr after the burst has ended (assuming a Salpeter IMF), declining to erg s-1by 1 Gyr after the burst. If X171206.83+640830.7 were a post-starburst galaxy with 10% of its mass formed in a 20 Myr interval, the implied star-formation would be 150 yr-1 (scaling by a factor of 1.5 to account for the Kroupa IMF). Assuming we observe X171206.83+640830.7 very soon after the burst (near the X-ray maximum at burst+10 Myr) then scaling the Sipior et al. (2004) curves yields an SFR of yr-1, which within errors is very consistent. We find the coarse agreement between likely post-starburst nature of this galaxy and the X-ray emission encouraging.
However, the lack of emission lines indicate that this source must be viewed much more than 10 Myr after its peak in X-ray luminosity. Since the peak X-ray luminosity would be even higher than observed now, the implied evolved starburst strength would be scaled upward by nearly an order of magnitude. A more plausible explanation for the high X-ray luminosity, given the X-ray variability, is that this is an extremely X-ray luminous accreting binary. Such a source would thus be the most X-ray luminous Ultraluminous X-ray source (ULX; see e.g., Fabbiano et al., 2003) ever detected.
3.4 AGN Activity and XBONGS
There are 19 galaxies in this sample which may be classified as AGN (see Table 2). Their ratios span the range found for nearby Seyfert 2 galaxies (e.g., Pappa et al., 2001). About 12 of the galaxies are at the upper end of the expected range, indicating possible Compton-thick obscuration (). The statistics on the hardness ratios for these 12 objects [ratio of (H-S)/(H+S) where H=2–8 keV counts and S=0.5–2 keV soft counts] are not sufficient to test for a correlations with (as was done for a nearby sample of Seyferts in Pappa et al., 2001). We will be exploring these high AGN in more detail in a future paper (A. Hornschemeier et al., in preparation).
There are three AGN with no detected [OIII]/H but H/[NII] ratios indicating they are AGN. These three sources are candidate “XBONGS” (X-ray Bright, Optically Normal Galaxies) which is an observational class of AGN found in deep X-ray surveys with no optical signature for AGN activity. Similar objects at higher redshift (in deeper surveys) would likely have been classified as absorption-dominated galaxies due to the inaccessibility of the H and [NII] emission lines. These three candidate XBONG galaxies do not, however, have high X-ray luminosities ( erg s-1, 0.3–8 keV). Thus they do not appear to be the observational analogs to XBONGS found in hard X-ray surveys (e.g., Comastri et al., 2002). There are similarly no extremely hard, X-ray luminous sources among the 15 X-ray detected absorption-dominated X-ray-detected galaxies. There are a total of 103 absorption-dominated galaxies in all of the fields at off-axis angles (13 of the 15 X-ray detected absorption-line galaxies are at off-axis angle . Thus we do not find any galaxies which show signs for extremely luminous AGN in the X-ray band that show no optical signature of activity in the high signal-to-noise SDSS spectra.
4 Conclusions
We have conducted a pilot study of 42 SDSS DR2 galaxies serendipitously detected in the X-ray band. The high signal-to-noise SDSS spectra afford detailed activity diagnostics that are often missing in the deepest surveys.
Among X-ray detected galaxies which show no signs for AGN activity (15 absorption-dominated galaxies and 7 star-forming galaxies), the X-ray emission is naturally explained by a combination of LMXBs, HMXBs, and hot ISM. Thus, we do not find evidence for AGN that are missed in the SDSS spectroscopic analysis. Our work thus supports that of others (e.g., Moran et al., 2002) that fairly simple observational effects may make X-ray detected AGN appear as XBONGS at higher-redshift. Among the 19 SDSS galaxies which have AGN signatures in their optical spectra, the - ratios are found to be coarsely consistent with Seyfert 2’s in the nearby Universe.
We do find four instances where galaxies might have been misclassified in lower signal-to-noise optical spectra. A NLS1’s line widths clearly reveal the presence of an AGN while its emission-line ratios are similar to that of a starburst galaxy. Three other galaxies have pure absorption-dominated optical spectra blueward of H but exhibit H and [NII] emission typical of AGN. All three of these galaxies would not have been identified as AGN above .
The detection of X-ray emission from a post-starburst galaxy indicated that the burst mass fraction calculated from the optical spectroscopic models may be in agreement with the expected X-ray emission from a starburst. However, the likely evolved nature of the post-starburst (the age of which is poorly constrained) indicates that the X-ray luminosity is quite excessive given the magnitude of the starburst. This one object is not sufficient to test the models but is strongly suggestive that a large sample of post-starburst galaxies (perhaps with stronger constraints on the burst mass fractions) may have a strong impact on the modeling of accreting binary systems. It may also be an excellent way to search for young ULX sources as this galaxy appears to harbor a variable X-ray source. We are able to rule out that this post-starburst galaxy is an AGN to very strong limits from optical spectroscopy.
We have made an effort to compare the various -SFR relationships in the literature. We find that differences among e.g., bolometric corrections and IMF account for up to a 50% difference in the SFR relationships. Any difference greater than this level must then be attributed to e.g., a different treatment of the contributions of AGN vs. star-formation. Our analysis supports the lower normalization of the -SFR relation after proper account of AGN activity and contributions from evolved stellar populations are made.
References
- Abazajian et al. (2003) Abazajian, K., et al. 2003, AJ, 126, 2081
- Alexander et al. (2002) Alexander, D. M., Aussel, H., Bauer, F. E., Brandt, W. N., Hornschemeier, A. E., Vignali, C., Garmire, G. P., & Schneider, D. P. 2002, ApJ, 568, L85
- Alexander et al. (2003) Alexander, D. M., et al. 2003, AJ, 126, 539
- Baldwin et al. (1981) Baldwin, J. A., Phillips, M. M., & Terlevich, R. 1981, PASP, 93, 5
- Bauer et al. (2002) Bauer, F. E., Alexander, D. M., Brandt, W. N., Hornschemeier, A. E., Vignali, C., Garmire, G. P., & Schneider, D. P. 2002, AJ, 124, 2351 (Paper XII)
- Brandt et al. (2001) Brandt, W. N., Hornschemeier, A. E., Schneider, D. P., Alexander, D. M., Bauer, F. E., Garmire, G. P., & Vignali, C. 2001, ApJ, 558, L5 (Paper VII)
- Brinchmann et al. (2004a) Brinchmann, J., Charlot, S., Heckman, T. M., Kauffmann, G., Tremonti, C., & White, S. D. M. (astro-ph/0406220)
- Brinchmann et al. (2004b) Brinchmann, J., Charlot, S., White, S. D. M., Tremonti, C., Kauffmann, G., Heckman, T., & Brinkmann, J. 2004b, MNRAS, 351, 1151
- Charlot & Longhetti (2001) Charlot, S., & Longhetti, M. 2001, MNRAS, 323, 887
- Colbert et al. (2004) Colbert, E. J. M., Heckman, T. M., Ptak, A. F., Strickland, D. K., & Weaver, K. A. 2004, ApJ, 602, 231
- Colbert & Ptak (2002) Colbert, E. J. M., & Ptak, A. F. 2002, ApJS, 143, 25
- Comastri et al. (2002) Comastri, A., et al. 2002, ApJ, 571, 771
- Condon (1992) Condon, J. J. 1992, ARA&A, 30, 575
- David et al. (1992) David, L. P., Jones, C., & Forman, W. 1992, ApJ, 388, 82
- Davis et al. (2003) Davis, D. S., Miller, N. A., & Mushotzky, R. F. 2003, ApJ, 597, 202
- Fabbiano et al. (1992) Fabbiano, G., Kim, D.-W., & Trinchieri, G. 1992, ApJS, 80, 531
- Fabbiano et al. (2003) Fabbiano, G., Zezas, A., King, A. R., Ponman, T. J., Rots, A., & Schweizer, F. 2003, ApJ, 584, L5
- Forman et al. (1979) Forman, W., Schwarz, J., Jones, C., Liller, W., & Fabian, A. C. 1979, ApJ, 234, L27
- Freeman et al. (2002) Freeman, P. E., Kashyap, V., Rosner, R., & Lamb, D. Q. 2002, ApJS, 138, 185
- Georgakakis et al. (2003) Georgakakis, A., Georgantopoulos, I., Stewart, G. C., Shanks, T., & Boyle, B. J. 2003, MNRAS, 344, 161
- Georgakakis et al. (2004) Georgakakis, A. E., Georgantopoulos, I., Basilakos, S., Plionis, M., & Kolokotronis, V. 2004, MNRAS, 354, 123
- Gilfanov et al. (2004a) Gilfanov, M., Grimm, H.-J., & Sunyaev, R. 2004a, MNRAS, 347, L57
- Gilfanov et al. (2004b) Gilfanov, M., Grimm, H.-J., & Sunyaev, R. 2004b, MNRAS, 351, 1365
- Goto et al. (2003) Goto, T., et al. 2003, PASJ, 55, 771
- Green et al. (2004) Green, P. J., et al. 2004, ApJS, 150, 43
- Grimm et al. (2003) Grimm, H.-J., Gilfanov, M., & Sunyaev, R. 2003, MNRAS, 339, 793
- Heckman (1980) Heckman, T. M. 1980, A&A, 87, 152
- Heckman et al. (1990) Heckman, T. M., Armus, L., & Miley, G. K. 1990, ApJS, 74, 833
- Hornschemeier et al. (2003) Hornschemeier, A. E., et al. 2003, AJ, 126, 575
- Kauffmann et al. (2003a) Kauffmann, G., et al. 2003a, MNRAS, 346, 1055
- Kauffmann et al. (2003b) Kauffmann, G., et al. 2003b, MNRAS, 341, 33
- Kennicutt (1998) Kennicutt, R. C. 1998, ApJ, 498, 541
- Kennicutt et al. (2003) Kennicutt, R. C., et al. 2003, PASP, 115, 928
- Kewley et al. (2001) Kewley, L. J., Dopita, M. A., Sutherland, R. S., Heisler, C. A., & Trevena, J. 2001, ApJ, 556, 121
- Kewley et al. (2002) Kewley, L. J., Geller, M. J., Jansen, R. A., & Dopita, M. A. 2002, AJ, 124, 3135
- Kilgard et al. (2002) Kilgard, R. E., Kaaret, P., Krauss, M. I., Prestwich, A. H., Raley, M. T., & Zezas, A. 2002, ApJ, 573, 138
- Kroupa (2001) Kroupa, P. 2001, MNRAS, 322, 231
- Moran et al. (2002) Moran, E. C., Filippenko, A. V., & Chornock, R. 2002, ApJ, 579, L71
- Nandra et al. (2002) Nandra, K., Mushotzky, R. F., Arnaud, K. A., Steidel, C. C., Adelberger, K. A., Gardner, J. P., Teplitz, H. I., & Windhorst, R. A. 2002, in 33 pages, 5 figures, Accepted for Publication in ApJ., 5215
- Norman et al. (2004) Norman, C., et al. 2004, ApJ, astro-ph/0402140
- Pappa et al. (2001) Pappa, A., Georgantopoulos, I., Stewart, G. C., & Zezas, A. L. 2001, MNRAS, 326, 995
- Persic et al. (2004) Persic, M., Rephaeli, Y., Braito, V., Cappi, M., Della Ceca, R., Franceschini, A., & Gruber, D. E. 2004, A&A, 419, 849
- Ptak & Griffiths (2003) Ptak, A., & Griffiths, R. 2003, in ASP Conf. Ser. 295: Astronomical Data Analysis Software and Systems XII, 465
- Ranalli et al. (2003) Ranalli, P., Comastri, A., & Setti, G. 2003, A&A, 399, 39
- Reddy & Steidel (2004) Reddy, N. A., & Steidel, C. C. 2004, ApJ, 603, L13
- Rosa-González et al. (2002) Rosa-González, D., Terlevich, E., & Terlevich, R. 2002, MNRAS, 332, 283
- Salpeter (1955) Salpeter, E. E. 1955, ApJ, 121, 161
- Seibert et al. (2002) Seibert, M., Heckman, T. M., & Meurer, G. R. 2002, AJ, 124, 46
- Sipior et al. (2004) Sipior, M. S., Eracleous, M., & Sigurdsson, S. 2004, ApJsubmitted (astro-ph/0308077)
- Stoughton et al. (2002) Stoughton, C., et al. 2002, AJ, 123, 485
- Strauss et al. (2002) Strauss, M. A., et al. 2002, AJ, 124, 1810
- Tremonti et al. (2004) Tremonti, C. A., et al. 2004, ApJ(astro-ph/0405537)
- Yun et al. (2001) Yun, M. S., Reddy, N. A., & Condon, J. J. 2001, ApJ, 554, 803
| XASSIST ID | SDSS-XR | Counts/Error | 0.3–8 keV Flux | Redshift | M | SFRb | [ OIII ] Lum. | mass | Type |
|---|---|---|---|---|---|---|---|---|---|
| (′′) | (erg cm-2 s-1) | (yr-1) | () | () | |||||
| X004146.77-092313.0 | 0.2 | 18.4 | 4.2 | 0.059 | -21.72 | -0.97 | 10.9 | AGN(H only) | |
| X011238.24+152804.5 | 1.3 | 10.2 | 2.0 | 0.043 | -21.36 | -0.22 | 10.6 | AGN() | |
| X011253.91+153607.9 | 1.1 | 18.8 | 3.5 | 0.041 | -21.98 | -0.94 | 10.7 | Absorption | |
| X011254.04+153248.9 | 0.3 | 22.1 | 4.1 | 0.046 | -22.57 | 0.17 | 10.9 | Absorption | |
| X011259.50+153528.4 | 1.4 | 18.9 | 8.5 | 0.041 | -21.78 | 0.41 | 6.21 | 10.9 | Composite |
| X011313.86+152938.2 | 1.0 | 18.3 | 3.3 | 0.230 | -23.91 | 0.17 | 11.6 | Absorption | |
| X011319.63+152926.2 | 2.5 | 10.2 | 1.9 | 0.049 | -21.15 | 0.41 | 6.56 | 10.4 | Star-forming |
| X011454.23+003026.0 | 0.6 | 10.2 | 2.2 | 0.044 | -21.71 | -0.94 | 10.8 | Absorption | |
| X011454.22+001812.1 | 0.7 | 7.7 | 2.3 | 0.044 | -22.31 | -0.39 | 5.32 | 11.1 | Star-forming |
| X011508.79+001557.7 | 0.8 | 12.4 | 3.4 | 0.043 | -21.39 | 0.52 | 6.67 | 10.6 | Star-forming |
| X011515.78+001248.8 | 0.3 | 188.5 | 53.7 | 0.045 | -22.45 | 0.74 | 5.69 | 11.1 | LINER |
| X011519.39+001357.2 | 0.3 | 15.4 | 4.3 | 0.089 | -21.59 | -0.11 | 5.64 | 10.6 | Composite |
| X011520.87+001534.1 | 0.6 | 16.7 | 4.5 | 0.043 | -21.84 | 0.15 | 6.07 | 10.8 | LINER |
| X085224.96+511211.6 | 1.7 | 116.9 | 12.9 | 0.073 | -21.53 | -0.03 | 7.15 | 10.6 | Seyfert |
| X085232.43+512414.3 | 1.2 | 50.0 | 7.4 | 0.125 | -23.49 | -0.17 | 11.4 | Absorption | |
| X093414.33+611735.7 | 1.7 | 44.4 | 10.9 | 0.208 | -23.71 | -0.01 | 11.5 | Absorption | |
| X095249.26+515305.5 | 1.0 | 81.7 | 19.7 | 0.215 | -24.30 | 1.88 | 6.39 | 11.8 | LINER |
| X102328.09+040917.3 | 1.4 | 6.3 | 1.3 | 0.069 | -21.11 | 0.72 | 6.58 | 10.2 | Star-forming |
| X102348.48+040552.4 | 1.4 | 791.7 | 180.9 | 0.099 | -22.08 | 1.09 | 6.93 | 10.9 | “Star-forming”, NLS1d |
| X103258.09+573106.4 | 0.8 | 13.9 | 4.3 | 0.045 | -21.01 | 0.20 | 5.22 | 10.3 | Composite |
| X103259.76+575321.9 | 0.3 | 18.1 | 5.3 | 0.123 | -23.10 | 0.45 | 5.89 | 11.2 | LINER |
| X111256.55+554056.9 | 3.4 | 17.4 | 2.6 | 0.055 | -22.05 | 0.88 | 5.87 | 10.8 | Star-forming |
| X122139.70+491953.7 | 2.2 | 14.6 | 2.0 | 0.125 | -22.60 | 0.78 | 6.53 | 10.9 | Composite |
| X122930.53+032942.4 | 1.5 | 31.7 | 10.1 | 0.078 | -22.09 | 0.07 | 5.75 | 11.0 | LINER |
| X123649.03+620439.9 | 1.0 | 21.3 | 1.5 | 0.113 | -23.25 | 1.08 | 11.4 | AGN(H only) | |
| X124240.63+024020.4 | 0.4 | 114.0 | 12.0 | 0.086 | -22.82 | -0.44 | 11.1 | AGN() | |
| X143821.88+034013.2 | 0.2 | 23.6 | 4.5 | 0.225 | -24.66 | 1.72 | 12.0 | Absorption | |
| X143826.34+033859.4 | 0.7 | 19.1 | 3.4 | 0.235 | -23.75 | 0.28 | 11.5 | Absorption | |
| X150554.29+013535.5 | 1.1 | 10.6 | 1.9 | 0.170 | -23.48 | 0.97 | 11.2 | Absorption | |
| X150944.45+570434.5 | 1.0 | 11.9 | 0.9 | 0.150 | -22.35 | 0.69 | 6.51 | 10.8 | Star-forming |
| X163608.18+410505.4 | 1.8 | 11.3 | 1.4 | 0.170 | -22.71 | 0.78 | 7.89 | 11.2 | Composite |
| X163615.46+405714.7 | 0.8 | 19.7 | 2.4 | 0.169 | -23.34 | 0.04 | 11.5 | AGN(H only) | |
| X163629.56+410221.6 | 1.4 | 288.2 | 39.0 | 0.047 | -21.33 | -0.59 | 6.18 | 10.5 | Composite |
| X163953.65+465226.4 | 1.2 | 24.6 | 6.0 | 0.225 | -23.89 | -0.14 | 11.6 | Absorption | |
| X170209.18+641220.7 | 2.0 | 30.1 | 6.4 | 0.084 | -23.04 | 1.30 | 8.04 | 11.2 | Composite |
| X171206.83+640830.7 | 1.1 | 402.1 | 96.5 | 0.082 | -21.01 | -0.21 | 10.3 | Absorption | |
| X171232.43+640008.7 | 1.3 | 16.6 | 3.8 | 0.085 | -22.82 | -0.51 | 11.3 | Absorption | |
| X171254.28+635930.2 | 2.6 | 7.2 | 1.7 | 0.083 | -23.13 | -0.40 | 11.3 | Absorption | |
| X171303.84+640700.7 | 1.1 | 23.7 | 6.1 | 0.081 | -22.85 | -0.28 | 11.4 | Absorption | |
| X171329.16+640247.6 | 1.1 | 71.3 | 17.0 | 0.078 | -23.44 | 0.13 | 11.5 | AGN() | |
| X221722.73+002107.0 | 1.7 | 17.1 | 2.2 | 0.095 | -22.12 | 1.00 | 6.39 | 11.0 | Composite |
| X234817.93+010615.2 | 2.1 | 18.7 | 7.8 | 0.093 | -23.30 | -0.39 | 11.3 | Absorption |
| Optical spectral typea | Number of X-ray detected galaxies | |||
|---|---|---|---|---|
| classb | classb | H onlyc | ||
| Star-forming | 7 | 7 | ||
| Composite | 8 | 9 | ||
| LINER | 5 | 6 | ||
| Seyfert | 1 | 1 | ||
| Total Emission Line: | 21 | 24 | 27c | |
| Absorption | 21 | 18 | 15 | |
| TOTAL | 42 | 42 | 42 | |