Molecular abundance ratios as a tracer of accelerated collapse in regions of high mass star formation?
Abstract
Recent observations suggest that the behaviour of tracer species such as and is significantly different in regions of high and low mass star formation. In the latter, is a good tracer of mass, while is not. Observations show the reverse to be true in high-mass star formation regions. We use a computational chemical model to show that the abundances of these and other species may be significantly altered by a period of accelerated collapse in high mass star forming regions. We suggest these results provide a potential explanation of the observations, and make predictions for the behaviour of other species.
1 Introduction
Molecular lines are effective probes of physical conditions in star forming regions. The abundances of molecules and their line profiles give information on the physical state of the gas and its likely evolution during the collapse to form a star (Rawlings et al., 1992). Methods based on molecular lines have been used together with dust continuum emission to probe regions of low-mass and of high-mass star formation (Pirogov et al., 2004). Recent work has shown that tracer species may be significantly depleted in the central parts of dense cores. In low-mass star forming regions, CS and CO do not trace the gas mass in the central cores (Aikawa et al., 2001; Bergin et al., 2001; Redman et al., 2002; Tafalla et al., 2002; Aikawa et al., 2003), but is an excellent tracer of the dust continuum emission (Caselli et al., 1999, 2002; Bergin et al., 2001). One possible explanation, therefore, is that the molecules which drive the nitrogen chemistry do not freeze-out on to dust grains as readily as some other species, and the species derived from , notably , remain present in the gas to higher densities and trace its mass, as does the dust continuum emission.
In high-mass star forming regions, however, the situation is unclear. The epoch most readily studied is the so called hot core phase, in which a characteristic chemistry signifies the operation of processes unlike those in quiescent clouds. This chemistry arises from the evaporation of molecules that had been frozen out on dust grains during the long cold period of collapse; they are then released back to the gas phase when the newly formed massive star warms its environment so that the ices sublimate.
Recent molecular line observations (Pirogov et al., 2003, 2004; Zinchenko et al., 2004) of high-mass-star forming cores show differences between the CS and distributions. In a survey of sources in regions of high-mass star formation, Pirogov et al. find that the CS and dust emission distributions are very similar, and differ significantly in many cases from the distributions; the abundance falls near massive young stellar objects, on scales up to a parsec where the temperature, relative to the rest of the cloud and to the CS peak, does not change significantly. The variation in relative intensity can be about one order of magnitude, larger than could be accounted for by excitation or opacity effects, and is seen in approximately one-third of the sources. A detailed study is, however, expected to reveal significant differences in the majority of the sources. Zinchenko et al. have also discussed the behaviour of some other molecules in dense cores in high-mass star forming regions. In summary, in contrast to its behaviour in low-mass star-forming regions where traces mass very well, in regions of high-mass star formation is a poor tracer of mass.
Here, we focus on the exciting new results concerning CS and . Why is there a complete reversal of the behaviour between regions of formation of high-mass stars (in which CS is apparently a good tracer of core mass) and of low mass stars (in which is apparently a good tracer of core mass)? We offer a possible explanation in terms of the differing dynamical state of the two types of region, and with a detailed computational model of high-mass star formation we obtain results that are consistent with the observations.
2 Observations
Here, we briefly review the observations reported in detail elsewhere (Pirogov et al., 2003, 2004; Zinchenko et al., 1995, 1998, 2004). (1-0) emission was observed in 2000 - 2001 at the Onsala 20 m telescope and at SEST. CS(2-1) has also been observed at SEST and Onsala. CS(5-4) emission was observed at SEST and also with (5-4) at the NRAO 12 m telescope. 35 sources were observed in the Onsala/SEST (1-0) surveys, and about 20 of these were later observed in dust continuum emission at SEST using the SIMBA bolometer array and at IRAM 30m with the MAMBO array. The CS is found to correlate well with the dust emission, while and CS appear to be poorly correlated in many cases. Several sources were mapped also in HCN, HNC, HCO+, CH3OH, and several other species. The gas kinetic temperatures were estimated from CH3C2H observations. The most complete data sets were obtained for S255 and S187. Inferred temperatures for S255 from the CH3C2H observations are about 35 K, both at the CS and emission peaks, somewhat warmer than cold cloud conditions.
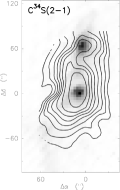
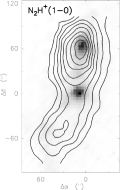
As an example, in figure 1 we show and (1-0) maps of S255 overlaid on the map of the dust continuum emission at 1.3mm. Both maps were obtained at Onsala with Nyquist sampling (HPBW/2=20” grid spacing). The emission is presumed to be optically thin. The peak optical depth for (1-0) in S255 is 0.5 (Pirogov et al. 2003).
The dust continuum data shows two peaks, almost equal in intensity. The distribution is similar, although the emission at the southern peak is somewhat stronger. The is very different; the northern component is much stronger in this line than the southern one.
The nature of these two components is different. The southern one is associated with a luminous cluster of IR sources, whereas toward the northern one an ultracompact H II region (G192.58-0.04) was detected. This object is extremely red in the mid-IR band and Crowther & Conti, and Mezger et al. derived almost exactly the same dust masses and temperatures for both components from 1.3 mm and m observations. Their dust temperatures are very close to the gas kinetic temperature referred to above. We interpret the northern source as a HII region, and the southern as a young high-mass protostellar candidate. It is this latter class of object that we model in this paper.
3 Rapid collapse of cores in high-mass star forming regions
While cores in low-mass star forming regions are generally quiescent (Myers and Benson, 1983; Evans et al., 2002), regions of high-mass star formation are dynamically active. We therefore explore the possibility that additional external pressures arising from this dynamical activity acting on a core can enhance the rate of collapse above the natural free-fall rate. We do not consider the possible mechanisms for this enhanced rate of collapse in detail. In fact, such an enhancement could be due to compression by shocks that are sufficiently weak that they have little effect on the temperature. Free-fall is conventionally assumed to be the limiting rate in regions of low-mass star formation. For convenience, we use the free-fall collapse law described in Rawlings et al. (1992) and we specify the enhancement of collapse in high-mass star forming regions by setting a larger value of the inverse time constant in the free-fall collapse equation which relates density and time. The change in number density, , as collapse proceeds from initital density to a final density is then given by
| (1) |
where , and are time, the gravitational constant and the mass of the hydrogen atom respectively. Values of which are greater than 1 allow accelerated collapse to be simulated.
Though the collapse law is in reality somewhat different, the adoption of the enhanced free-fall description allows us to explore the qualitative response of the chemistry to more rapid collapse. The timescale of the collapse compared to the timescale of freeze-out is more important for the chemical results than the other details of the collapse history. The effect of an enhanced collapse rate should be that high gas densities would be achieved rapidly, before the effects of freeze-out dominate the chemistry.
The primary formation route for is through the reaction between and which also produces molecular hydrogen. The molecule reacts with species such as , C, O or CO to form and a positive ion. It is easy to see, therefore, that the abundance in the gas phase of these removal agents will be critical in determining the abundance of present.
In particular, we explore the hypothesis that high densities would be reached before molecules that are important as removal agents are fully depleted in the gas phase. If this is indeed the case, then abundances should be reduced in such circumstances, while the higher gas density promotes gas phase chemistry producing, in particular, CS, through reactions such as the interaction of and HCS, or between atomic carbon and diatomic molecules such as SO. In the canonical model with free fall collapse, molecules such as CS freeze out of the gas phase before being destroyed in further reactions.
We expect, therefore, that in accelerated collapse, CS should be enhanced while is reduced, compared to canonical calculations, and use this prediction to test our hypothesis. We use a chemical model similar to that used in Viti & Williams (1999) to describe the formation and chemistry of high mass star formation. The model in Viti & Williams (1999) is a two stage calculation: the first stage starts from a fairly diffuse ( 300 cm-3) medium in atomic form (apart from a fraction of hydrogen in H2), and undergoes a collapse until densities typical of hot cores are reached ( 107 cm-3). During this phase the temperature is 10K. The collapse follows the single-point free-fall evolution according to equation 1 (as used by Rawlings et al. 1992). During this time, atoms and molecules from the gas freeze onto the grains and they hydrogenate where possible. The advantage of this approach is that the ice composition is not assumed but it is self-consistently derived by a time dependent computation of the chemical evolution of the gas/dust interaction process.
The adopted initial abundances are 1.0, 0.075, 4.4510-4, 1.7910-4, 8.5210-5, 1.4310-6 and 5.1210-6 respectively, for H, He, O, C, N, S and Mg. The chemical network is taken from the UMIST rate 99 database 111www.rate99.co.uk (Le Teuff, Millar & Markwick 2000). We follow the chemical evolution of 168 species involved in 1857 gas-phase and grain reactions. At the end of Stage I 99 per cent of the gas is frozen out.
The second stage follows the chemical evolution of the remnant core, after the protostar is born. However, for most of our runs, we only make use of Stage I, as we are interested in the pre-stellar evolution of the core, given that all analyzed objects show temperatures around 30 K. We have run several models exploring the effect of a two-phase collapse where we employ a free-fall collapse up to a critical density, (a free parameter), followed by collapse at an enhanced rate (up to 4 times the free-fall rate, i.e. in equation 1) until a final density of 107 cm-3 is reached.
For some of our models, we also run Stage II, as described in a recent development of the Viti & Williams (1999) model (Viti et al. 2004): we simulate the effect of the presence of an infrared source in the centre of the core or in its vicinity by subjecting the core to a time-dependent increase in the gas and dust temperature up to 50 K, followed by partial evaporation of grains, according to the prescription contained in Viti et al. (2004). In these runs, the temperature increase begins once a density is reached.
The parameter choices for our calculations are given in Table 1.
We find, as expected, that enhancing the collapse rate above free-fall increases the CS abundance and reduces the abundance. The shift in each case is about half of one order of magnitude. The results for collapse rate enhancements differ significantly from the results for free-fall, but not dramatically for enhancements by factors of 2 - 4 or for accelerations triggered at different densities. In Fig. 2 we show the ratio of the CS and abundances as a function of time for the cases (free-fall), and (enhanced collapse rate). There is a substantial enhancement in the ratio in cases in which the collapse rate is enhanced. The enhancement is not observed when the freeze-out of molecules is removed from the simulation, supporting the hypothesis that the change in abundance observed is associated with freeze-out. In order to ensure that our results could not be replicated simply by allowing complete depletion, a run was completed in which the rate of collapse was decelerated by a factor of 10. In this case the abundance was found to drop rapidly to zero before depletion is significantly advanced; therefore the observations cannot be explained by decelerated collapse.
We have investigated the effect of heating to the observed temperatures of 35-50K following the method of Viti et al., where the temperature of the core is increased monotonically following a power law and where the evaporation of a fraction of mantle species (in a single step) occurs when the temperature for a particular desorption event is reached (Collings et al., 2004). Heating was initiated in the final stages of collapse; the results were insensitive to the density at which temperature increase began. Figure 3 shows that the increase in CS and decrease in abundances are not significantly affected by the incorporation of heating into the simulation.
4 Discussion and Conclusions
Recent observational data on cores in regions of high-mass star formation show the exciting and unexpected results opposite in character to that found in regions of low-mass star formation. We have suggested that the enhancement of CS and reduction in abundance found in regions of high-mass star formation may be related to the high dynamical activity in these regions which could enhance the rate of collapse of cores above the free-fall rate. Consequently, high gas densities would be achieved before freeze-out had removed the molecules responsible for loss, while the high densities promote CS formation. We have demonstrated using a computational chemical model that the predicted effects are indeed recovered for plausible parameter choices. We have shown that these results are not particularly sensitive to the particular enhancement rate adopted, above a factor of twice the free-fall rate. The observational results also give some information about variations of other molecules with respect to high density tracers. Our model confirms that HCN, for example, is similar to CS in its distribution, as found by Pirogov et al. However, our model predicts SO would have a distribution similar to , whereas the observations of S255 show it to be much closer to CS. (See Table 2). As yet, data on the distribution of SO abundance is available only for S255 and so it is not clear whether this result is significant or restricted to this source. As with most molecules, the effect of accelerated collapse on SO will be both to increase the rate of production and to prevent the removal of other possible reaction partners from the gas phase. This discrepancy between theory and observation for SO suggests that our classification of molecules into two classes of species, each of which is primarily affected by only one of these mechanisms, is over-simplistic for molecules at the centre of complex reaction networks. Should further SO observations confirm the S255 results, a detailed analysis of the behaviour of sulfur-bearing species in our model will be necessary.
The temperatures found in these cores are somewhat warmer than normally found in dense cores. We have examined the results from computational chemical models in which the initial warming stages of the hot core phase is permitted, up to temperatures of around 30 - 50 K, according to the prescription contained in Viti et al.(2004) The results reported here are not significantly changed.
We conclude that the results of the model investigated are consistent with the rather limited observational data. This first investigation of the effects of accelerated collapse on the chemical abundances of species in high mass star formation regions suggests a possible explanation of the observations considered, and provides an important route for future observational and theoretical work.
Acknowledgments
C.J.L. is supported by a PPARC studentship. SV acknowledges individual financial support from a PPARC Advanced Fellowship. D.A.W. thanks the Leverhulme Trust for the Leverhulme Emeritus Award. I.Z. was partly supported by the Russian Foundation for Basic Research grant 03-02-16307. P.C. acknowledges support from the MIUR project ”Dust and Molecules in Astrophysical Environments”
References
- Aikawa et al. (2001) Aikawa, Y., Ohashi, N., Inutsuka, S., Herbst, E., Takakuwa, S., 2001, ApJ, 552, 639
- Aikawa et al. (2003) Aikawa, Y., Ohashi, N., Herbst, E., 2003, ApJ, 503, 906
- Bergin et al. (2001) Bergin E.A., Ciardi, D.R., Lada C.J., Alves J., Lada, E.A., 2001, ApJ, 557,209
- Caselli et al. (1999) Caselli, P., Walmsley, C. M., Tafalla, M., Dore, L., Myers, P. C., 1999, ApJ, 523, L165
- Caselli et al. (2002) Caselli, P., Walmsley, C. M., Zucconi, A., Tafalla, M., Dore, L., Myers, P. C., 2002, ApJ,565,331
- Collings et al. (2004) Collings M P, Anderson M P, Dever J W, McCoustra M R S, Williams D A, 2004 MNRAS, in press
- Crowther & Conti (2003) Crowther, P.A. & Conti, P.S., 2003, MNRAS, 343, 143
- Evans et al. (2002) Evans, N.J., Rawlings J.M.C., Shirley Y.L., Mundy, L.G., 2001, ApJ, 557, 193
- Fontani et al. (2002) Fontani, F., Cesaroni, R., Caselli, P., Olmi, L., 2002, A& A, 389, 603
- Le Teuff, Millar & Markwick (2000) Le Teuff, Y.H., Millar, T.J., Markwick, A.J., A&AS,146,147
- Mezger et al. (1988) Mezger, P. G., Chini, R., Kreysa, E., Wink, J. E., Salter, C. J.,1988,A&A,191, 44
- Myers and Benson (1983) Myers, P.C.,Benson, P.J. 1983, ApJ, 266, 309
- Pirogov et al. (2003) Pirogov, L., Zinchenko, I., Caselli, P., Johansson, L. E. B.,Myers, P. C. 2003, A&A,405,639
- Pirogov et al. (2004) Pirogov L., Zinchenko I., Caselli P., Johansson L.E.B., Myers P. In Preparation
- Rawlings et al. (1992) Rawlings J.M.C., Hartquist, T.W., Menten, K.M., Williams, D.A., 1992, MNRAS, 255, 471
- Redman et al. (2002) Redman, M.P., Rawlings, J.M.C., Nutter, D.J., Ward-Thompson, D., Williams, D.A., 2002, MNRAS, 337, L17
- Tafalla et al. (2002) Tafalla, M., Myers, P.C., Caselli, P., Walmsley, C.M., Comito, C., 2002, ApJ, 569, 815
- Viti et al. (2004) Viti S, Collings M P, Dever J W, McCoustra M R S, Williams D A, 2004, in press, MNRAS astro-ph 0406054
- Viti and Williams (1999) Viti S, Williams D. A., 1999, MNRAS, 305, 755
- Zinchenko et al. (1995) Zinchenko, I., Mattila, K., Toriseva, M., 1995, A&AS, 111, 95
- Zinchenko et al. (1998) Zinchenko, I., Pirogov, L., Toriseva, M., 1998, A&AS, 133, 337
- Zinchenko et al. (2004) Zinchenko I., Pirogov L., Caselli P., Johansson L.E.B., Myers P., Turner B. In preparation


| Run | Temp. Rise? | |||
| A | 1.0 | No | N/A | |
| B | 2.0 | No | N/A | |
| C | 3.0 | No | N/A | |
| D | 4.0 | No | N/A | |
| E | 2.0 | Yes | ||
| F | 1.0 | Yes | ||
| G | 2.0 | Yes | ||
| H | 3.0 | Yes | ||
| I | 4.0 | Yes | ||
| J | 2.0 | No | N/A | |
| K | 2.0 | No | N/A | |
| L | 2.0 | No | N/A | |
| M | 0.1 | Yes |
| -like | CS-like |
|---|---|
| HCN | |
| OCS | |
| SO | |