Propagation and Signatures of Ultra High Energy Cosmic Rays
Abstract
We study the extragalactic protons with universal spectrum, which is independent of mode of propagation, when distance between sources is less than the propagation lengths, such as energy attenuation length or diffusion length (for propagation in magnetic fields). The propagation features in this spectrum, the GZK cutoff, dip and bump, are studied with help of modification factor, which weakly depends on the generation spectrum index . We argue that from the above features the dip is the most model-independent one. For the power-law generation spectrum with the dip is very well confirmed by the data of all existing detectors, which gives the strong evidence for extragalactic protons propagating through CMB. We develop the AGN model for origin of UHECR, which successfully explains the observed spectra up to eV and transition from galactic to extragalactic cosmic rays. The calculated spectrum has the GZK cutoff, and the AGASA excess of events at eV needs another component, e.g. from superheavy dark matter. In case of weak extragalactic magnetic fields this model is consistent with small-angle clustering and observed correlation with BL Lacs.
1 Introduction
The systematic study of Ultra High Energy Cosmic Rays (UHECR) started in late fifties after construction of Volcano Ranch (USA) and Moscow University (USSR) arrays. During next 50 years of research the origin of UHE particles, which hit the detectors, was not well understood. At present due to the data of the last generation arrays, Haverah Park (UK), Yakutsk (Russia), Akeno and AGASA (Japan), and Fly’s Eye and HiRes (USA) [1] we are probably very close to understanding the origin of UHECR, and the data of Auger detector [2] will undoubtedly substantially clarify this problem.
On the theoretical side we have an important clue to understanding the UHECR origin: the interaction of extragalactic protons, nuclei and photons with CMB, which leaves the imprint on UHE proton spectrum, most notably in the form of the Greisen-Zatsepin-Kuzmin (GZK) [3] cutoff.
We shall shortly summarize the basic experimental results and the
results of the data analysis, important for understanding of UHECR
origin (for a review see [4]).
(i) The
spectra of UHECR are measured [1] with good accuracy at 1
- 100 EeV, and these data have a power to reject or confirm some
models. The discrepancy between the AGASA and HiRes data at EeV might have the statistical explanation [5].
(ii) The mass composition at EeV (as well as
below) is badly known (for a review see [6]). The different
methods give the different mass composition, and the same methods
disagree in different experiments. Probably the most reliable
method of measuring the mass composition is given by elongation
rate (energy dependence of maximum depth of shower )
measured by the fluorescent method. The data of Fly’s Eye in 1994
[1] favored iron nuclei at 1 EeV with a gradual
transition to the protons at 10 EeV. The further development of
this method by the HiRes detector, which is the extension of Fly’s
Eye, shows the transition to the proton composition already at
1 EeV [7].
(iii) The arrival directions
of particles with energy eV show the
small-angle clustering within the angular resolution of detectors.
AGASA found 3 doublets and one triplet among 47 detected particles
[8] (see the discussion [9]). In the combined
data of several arrays [10] there were found 8
doublets and 2 triplets in 92 events. The stereo HiRes data
[11] do not show small-angle clustering for 27 events
at eV, maybe due to limited statistics.
Small-angle clustering is most naturally explained in case of
rectilinear propagation as a random arrival of two (three)
particles from a single source [12]. This effect has been
calculated in Refs. [13, 14, 15, 16, 17]. In the last
four works the calculations have been performed by MC method and
results agree well. According to [17] the density of the
sources, needed to explain the observed number of doublets is
Mpc-3. In [16] the best
fit is given by Mpc-3 and the
large uncertainties (in particular due to ones in observational
data) are emphasized.
(iv) There have been
recently found the statistically significant correlations between
direction of particles with energies eV
and directions to AGN of the special type - BL Lacs [18]
(see also the criticism [19] and the reply [20]).
The items (iii) and (iv) favor rectilinear
propagation of primaries from the point-like extragalactic sources,
presumably AGN. This statement provokes many questions:
Is rectilinear propagation the only solution to clustering (e.g. does it appear in propagation of protons in strong magnetic
fields)? In case the correlation with AGN is true, what are the
primaries (protons in weak magnetic field or neutral particles)?
In this paper we shall analyse the origin of UHECR in two steps. In the first one we will use only most reliable observational data, namely the energy spectra and fluxes under the most conservative assumption that primaries are extragalactic protons. We shall calculate spectra for propagation in weak and reasonably strong magnetic fields, and demonstrate the strong evidence in favor of protons as the primaries at energies 1 - 80 EeV. This part of analysis is almost model independent. In the second step we shall include the data (iii) and (iv) and formulate our model. In the framework of our model we shall discuss the connection between galactic and extragalactic components of cosmic rays, and the problem with superGZK particles, i.e. ones at EeV.
2 Three problems of UHECR
1. SuperGZK particles at eV.
“The AGASA excess”, namely 11 events with energy higher than
eV, cannot be explained as extragalactic
protons, nuclei or photons. While the spectrum up to eV is well explained as extragalactic protons with the
GZK cutoff, the AGASA excess should be described as another
component of UHECR, most probably connected with the new physics:
superheavy dark matter, new signal carriers, like e.g. light
stable hadron and strongly interacting neutrino, the Lorentz
invariance violation etc.
The problem with superGZK particles is seen in other detectors, too.
Apart from the AGASA events, there are five others: the golden FE
event with eV, one HiRes event with
eV and three Yakutsk events
with eV. No sources are observed in the
direction of these particles at the distance of order of attenuation
length. The most severe
problem is for the golden FE event: with attenuation length
Mpc and the homogeneous magnetic field 1 nG
on this scale, the
deflection of particle is only . Within this angle
there are no remarkable sources at distance Mpc [21].
2. Transition from galactic to extragalactic cosmic
rays.
All measurements agree with the existence of the
proton knee at energy about eV and with
increasing of the mean atomic number A of the primaries
as energy grows up to eV. If the knee is due to
rigidity-dependent propagation (diffusion) or rigidity-dependent
acceleration, the iron nuclei should have a knee at eV, as it is indeed observed by KASCADE (see Section 6
for the details). On the other hand, the ankle at eV, discovered in late 70s in the Haverah Park data
[22], is traditionally considered as transition from
galactic to extragalactic cosmic rays.
How the gap between eV and eV is filled?
This problem was studied in [23]. We shall consider it in
Section 6.
Acceleration to eV.
Acceleration to eV is sufficient for present observations. It can happen
that future observations, e.g. by EUSO , will indicate to
considerably higher .
The conservative shock acceleration mechanism can provide eV only for selected astrophysical objects, such as AGN [24] and GRBs [25]. However, there are many other mechanisms of accelerations which are not developed mathematically as good as the shock acceleration but which in principle can accelerate particles to much higher energies and to be very powerful. They include unipolar induction, operating in the accretion discs, jets from black holes and fast-rotating pulsars, acceleration in strong e-m waves in vacuum and plasma, and different types of plasma acceleration mechanisms (see [26] for a review). Therefore, acceleration of particles to eV does not look forbidden. The more restrictive problem is a presence of such accelerators nearby our galaxy or inside it. However, discovery of particles with eV will imply either “new” acceleration mechanisms or top-down scenarios.
One can find more discussion of UHECR problems in review [27].
3 Propagation theorem and the universal spectrum
As numerical simulations show (see e.g. [28, 29]), the
propagation of UHE protons in strong magnetic fields changes the
energy spectrum (for physical explanation of this effect see
[30]). The influence of magnetic field on spectrum depends on
the separation of the sources . The propagation
theorem reads:
For uniform distribution of sources
with separation much less than characteristic lengths of

propagation, such as attenuation length
and the diffusion length , the diffuse spectrum of
UHECR has an universal (standard) form independent of mode of
propagation.
For the proof see [30]. We
shall illustrate this theorem by convergence of the spectrum
calculated in the diffusion approximation to the universal
spectrum (see below), when the distance between sources, ,
becomes small. In Fig. 1 the diffuse spectra are
calculated in the diffusion approximation for the strong magnetic
field (100 nG on the basic scale 1 Mpc) for different distances
between sources indicated in the figure. The universal spectrum is
shown by the solid line. All spectra correspond to the same
emissivity . For d= 50 Mpc the diffusive spectrum (black
boxes) is quite different from the universal one. When d=10 Mpc
(stars) both spectra are very similar, and at d=3 Mpc (crosses)
they become indistinguishable. In the case of the reasonable
fields, 1 - 10 nG, the diffusive spectra are universal for all
reasonable separations
.
*[1mm] Universal spectrum.
One can
calculate the spectrum from conservation of number of particles in
the comoving volume (protons change their energy but do not
disappear). For the number of UHE protons per unit comoving
volume, , one has:
| (1) |
where is an age of the universe, is a generation energy at age , is the generation rate per unit comoving volume, which can be expressed through emissivity , the energy release per unit time and unit of comoving volume at , as
| (2) |
where describes possible
cosmological evolution of the sources. In the case of the
power-law generation, , with
normalization
constant for .
From Eq.(1) one obtains the diffuse flux as
| (3) |
where
| (4) |
analytic expression for is given in [31].
The spectrum (3) is referred to as universal spectrum. Formally it is derived from conservation of particles and does not depend from propagation mode (see Eq. (1)). But in fact, the homogeneity of the particles, tacitly assumed in this derivation, implies the homogeneity of the sources, and thus the condition of validity of universal spectrum is a small separation of sources. The homogeneous distribution of particles in case of homogeneous distribution of sources and inhomogeneous magnetic fields follows from the Liouville theorem (see Ref. [30]).
4 Spectrum features from proton interaction with CMB
The extragalactic protons propagating through CMB produce signatures in the form of three spectrum features: GZK cutoff, dip and bump. The dip is produced due to -production and bump – by pile-up protons accumulated near beginning of the GZK cutoff.
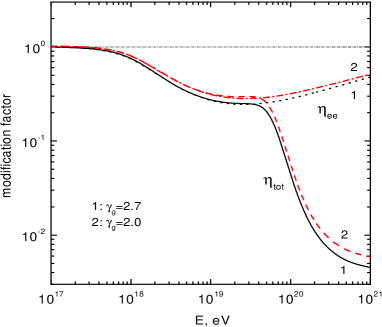
Modification factor is defined as a ratio of the spectrum , with all energy losses taken into account, to unmodified spectrum , where only adiabatic energy losses (red shift) are included.
| (5) |
For the power-law generation spectrum one has
Modification factor is less model-dependent quantity than the spectrum. In particular, it should depend weakly on , because both numerator and denominator in Eq. (5) include . Further on we shall consider the non-evolutionary case .

The modification factor in Fig. 2, as expected, depends weakly on , but the shape of the GZK cutoff is strongly model-dependent: it is more flat in case of local overdensity of the sources, and more steep in case of their local deficit.
The dip is a more reliable signature of interaction of protons with CMB: its shape is fixed and has rather complicated form to be imitated by other mechanism. The protons in the dip are collected from the large volume with the linear size about 1000 Mpc and therefore the assumption of uniform distribution of sources within this volume is well justified. In contrast to this well predicted and specifically shaped feature, the cutoff, if discovered, can be produced as the acceleration cutoff (steepening below ). Since the shape of both, GZK cutoff and acceleration cutoff, is model-dependent, it will be difficult to argue in favor of any of them. The problem of identification of the dip depends on the accuracy of observational data, which should confirm the complicated shape of this feature. Do the present data have the needed accuracy? We shall address to this question in the next Section.
Let us now come over to the bump. We see no indication of the bump in Fig. 2 at merging of and curves, where it should be located. The absence of the bump in the diffuse spectrum can be easily understood. The bump is clearly seen in the spectrum of a single remote source [32, 33]. These bumps, located at different energies, produce a flat feature, when they are summed up in the diffuse spectrum. This effect can be illustrated by the Fig. 3 from Ref. [32]. In Fig. 3 the diffuse flux is calculated in the model where sources are distributed uniformly in the sphere of radius (or ). When are small (between 0.01 and 0.1) the bumps are seen in the diffuse spectra. When radius of the sphere becomes larger, the bumps merge producing the flat feature in the spectrum. If the diffuse spectrum is plotted as this flat feature looks like a pseudo-bump.
5 Dip as the signature of proton interaction with CMB
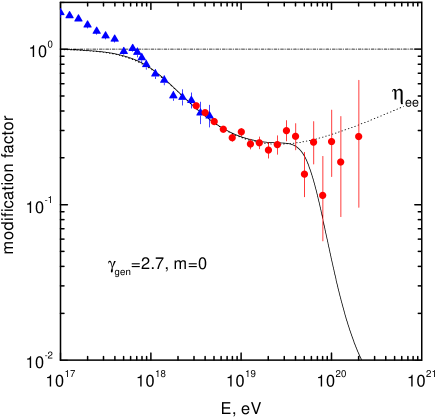
The comparison of the calculated modification factor with that obtained from the Akeno-AGASA data, using , is shown in Fig. 4. From Fig. 4 one observes the excellent agreement of predicted and observed modification factors for the dip. By definition . In Fig. 4 one sees that at . It signals about appearance of another component of cosmic rays, which is most probably galactic cosmic rays. The condition means the dominance of the new (galactic) component, the transition occurs at higher energy.
To calculate for the confirmation of the dip by Akeno-AGASA data, we choose the energy interval between eV (which is somewhat arbitrary in our analysis) and eV (the energy of intersection of and ). In calculations we used the Gaussian statistics for low-energy bins, and the Poisson statistics for the high energy bins of AGASA. It results in . The number of Akeno-AGASA bins is 19. We use in calculations two free parameters: and the total normalization of spectrum. In effect, the confirmation of the dip is characterised by for d.o.f=17, or /d.o.f=1.12.
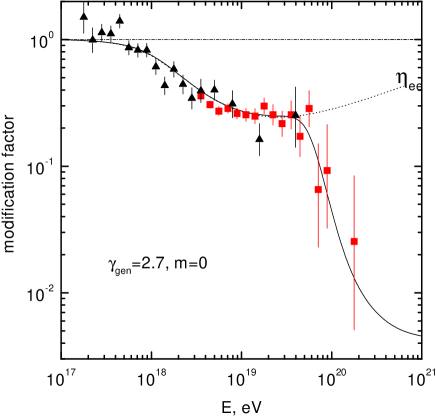
In Fig. 5 the comparison of modification factor with the HiRes data is shown. The agreement is also good.
The good agreement of the shape of the dip with observations is a strong evidence for extragalactic protons interacting with CMB. This evidence is confirmed by the HiRes data on the mass composition, which favor the protons (see Fig. 6).

6 AGN model
We will consider the AGN model phenomenologically, i.e. not specifying the acceleration mechanism and assuming that space
density of AGN satisfies the universal spectrum. The data on
small-angle clustering and correlation with AGN will be involved
in the analysis. We shall consider density of the sources and
their luminosities, spectra, transition from galactic to
extragalactic cosmic rays and the problem of superGZK
particles.
Spectra.
We will calculate the
extragalactic proton spectra following ref. [34, 35], in
the model with the following assumptions.
We assume the generation spectrum of a source as the standard one, , up to energy , and more steep, at higher energies. This complex spectrum might imply two mechanisms of acceleration: the shock acceleration with and some other mechanism working at higher energies. Thus, the generation function in Eq. (2) is determined by the following :
| (6) |
with normalization constant given by
| (7) |
The diffuse flux is given by Eq. (3).
We consider the non-evolutionary model, , with , with eV and with most conservative maximum acceleration energy eV.
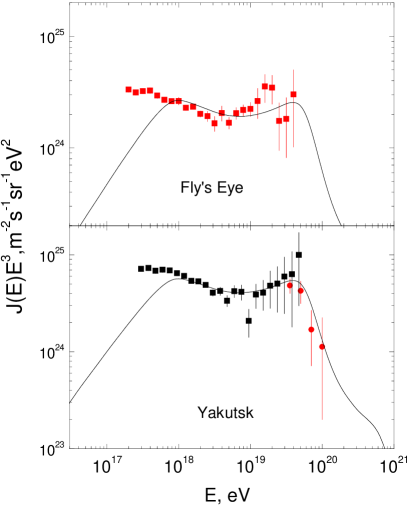
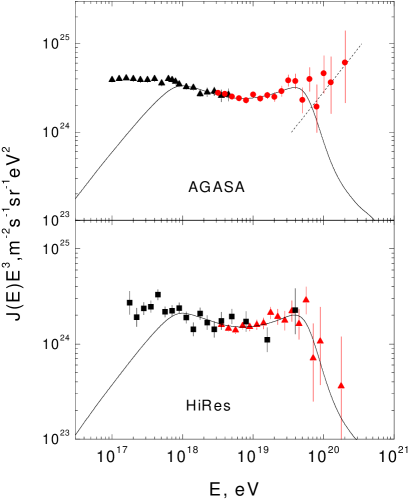
The calculated spectra are presented in Figs. 7 and 8 in comparison with the data of AGASA, Fly’s Eye, HiRes and Yakutsk arrays. The normalization of all spectra needs somewhat different emissivity . The normalization to the AGASA data is given by erg/Mpc3yr. As Fig. 9 shows, the Akeno-AGASA and HiRes I - HiRes II data agree in the spectrum and flux, when the energies are shifted by the factors and for the AGASA and HiRes data, respectively. Such shift is allowed by systematic errors in energy determination for each detector. The joint spectrum is fitted well by the calculations with erg/Mpc-3yr.
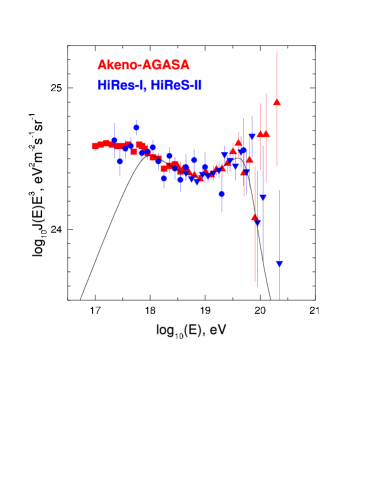
However, at eV there is substantial
disagreement in the data of both detectors. Statistical significance
of this contradiction was not evaluated by the collaborations of both
experiments. This problem will be resolved soon by the Auger detector.
Transition to the galactic cosmic rays.
In agreement
with all other measurements, the KASCADE data (see Fig.
10) show the gradual transition to heavy nuclei at
energies above the proton knee GeV. The
KASCADE data are in a reasonable agreement with
rigidity-propagation models or rigidity-acceleration models,
according to which the positions of nuclei knees are given by
, shown in Fig. 10 by vertical arrows.
According to this picture, after the iron knee, GeV, the CR flux should decrease steeply with
energy, as in the rigidity-propagation
models, where is the diffusion coefficient in the galaxy.
The all-particle KASCADE-Akeno spectrum in Fig. 10 does
not show this steepening, and we interpret it as the compensation
of the flux by extragalactic protons, which become the dominant
component at GeV. If transition
from galactic to extragalactic component occurs at GeV, it should reveal itself as a faint
feature in all-particle spectrum, because both components,
galactic and extragalactic, have similar spectra. Indeed, the
difference between spectral indices of the all-particle Akeno
spectrum and extragalactic proton spectrum of our model is equal
to .
Such faint spectral feature is well known. It is the second knee, whose position varies from GeV to GeV in different experiments (Fly’s Eye - GeV, Akeno - GeV, HiRes - GeV and Yakutsk - GeV). The second knee in the Akeno spectrum is seen in Fig. 11.
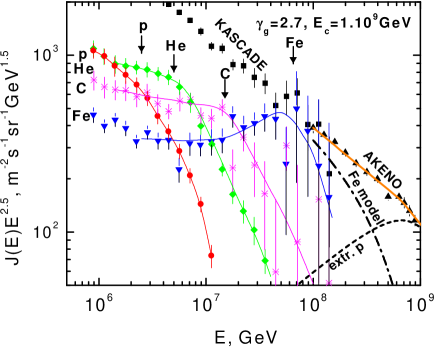
Assuming that the total flux at GeV is given by galactic iron nuclei and extragalactic protons, we calculated [35] the flux of galactic iron nuclei, subtracting the flux of extragalactic protons, as given by our model, from all-particle spectrum of Akeno. The resulting spectra of iron nuclei are shown in Fig. 10 for GeV and for three values of in Fig. 11. The latter spectra are not exactly power-law, but in the power-law approximation they can be roughly characterised by for spectrum , for spectrum , and for spectrum . These spectra, especially and are consistent with the Hall diffusion, which predicts (see [35]).
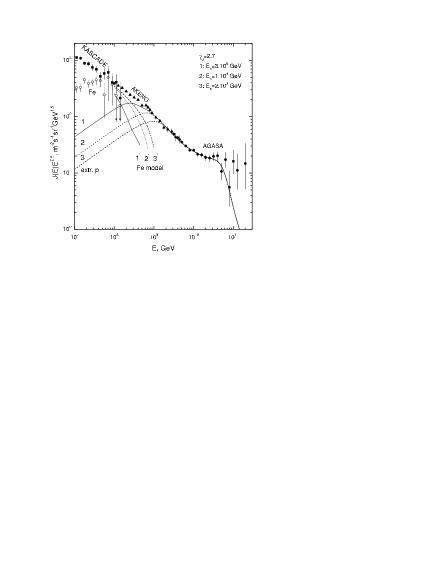
From Fig. 11 one can see, that while transition from the galactic to extragalactic component in all-particle spectrum is characterised by a faint feature, this transition is quite sharp when the iron and proton spectra are resolved (the intersection of curves , and ).
The fraction of iron in the total flux decreases as energy increases from eV to eV, changing from about to (the predicted fraction depends on , see [35]).
An interesting prediction of [35] is the visibility of
galactic sources at eV. If galactic
sources accelerate particles to energies higher than eV, their “direct” flux can be seen, while the produced
diffuse flux should be small, because of short confinement time in
the galaxy. If generation spectrum is dominated by protons, the
“direct” flux must be seen as the protons, while the diffuse
galactic flux is presented by heaviest nuclei. Due to multiple
scattering of protons in the magnetic fields, the galactic point
sources should be observed as the extensive sources with typical
angular size at distance kpc. At
higher energies and smaller distances these sources are seen as
the point-like ones.
SuperGZK particles from
SHDM
As Figs. 7 and 8
show, the spectrum of our model agrees with the HiRes, Yakutsk and
Fly’s Eye data, but does not agree with the AGASA data at eV. The AGASA excess needs for its explanation
another component. We will discuss here UHECR from superheavy dark
matter (SHDM) as a possible candidate (see also [37]).
SHDM as a source of UHECR without GZK cutoff has been suggested and studied in Refs. [38]. SHDM is comprised by quasi-stable particles with masses GeV. They are efficiently produced at post-inflationary epoch (for the review see [39]). X-particles are accumulated in the galactic halo with overdensity , and this effect provides the absence of the GZK cutoff.
The spectra of particles produced in X-particle decay have been recently reliably calculated by three independent groups and by two different methods [40, 41]. As the main results, these calculations give almost power-law spectrum with and the increased ratio of nucleons to photons [41].
With this spectrum the SHDM model can explain only the AGASA excess at eV, as shown in Fig. 12.

There are two main signatures of UHECR from SHDM:
(i) The dominance of primary photons with ratio
.
(ii) Excess of particles from the direction of the Galactic Center.
The first signature has been studied recently [42],
using the AGASA data. Note, that
only events with eV are relevant. The recent
theoretical prediction, , substantially
changes the conclusions of [42].
From 11 events at eV, muons were
detected only in 6 showers: 4 with two muon detectors fired (cut
A) and 2 more with one muon detector fired (cut B) (are other 5
showers muon-poor or muon signal in the detectors are absent due
to fluctuations?). From Fig. 2 of Ref. [42] one sees
only two events (cut A), where muon content contradicts to
photon-induced showers, with two more which are marginally
consistent with photon-induced showers, and with two more located
in the zone allowed for the photon-induced showers. With
ratio given above the number of proton-induced showers
is predicted to be 2.75 - 3.63 in a good agreement with 2 (or even
4) showers with the hadronic muon content. As to arrival
distribution with account of geomagnetic absorption and LPM
suppression of showers from unabsorbed photons, we think that more
detailed theoretical calculations and better statistics is needed
for the reliable conclusions. However, we agree with the final
conclusion of the paper [42]: “Above eV
no indication of -ray dominance is found in both
(1000) and arrival direction distributions”.
The second signature (ii) is reliably predicted (it is
caused by DM distribution in the halo) and will be tested soon by
the Auger detector. The absence of anisotropy centered by the
Galactic Center excludes the SHDM model as explanation of the
AGASA excess.
AGN as UHECR sources.
We will
accept here the MHD simulation [43] of magnetic fields in
various universe structures. These simulations favor relatively
weak magnetic fields in the structures, namely of the order of
0.1 nG in typical filaments and of 0.01 nG in the voids, the
magnetic field in the Local Universe is also weak (notice,
however, the simulations [44] in which stronger magnetic
fields are obtained). With magnetic fields from simulations
[43], protons with eV propagate
quasi-rectilinearly and the small-angle clustering is most
naturally explained with the density of the sources given
[17, 16] as
| (8) |
with some uncertainties as indicated in [16]. Correlation with BL Lacs [18] indicates directly to AGN as the sources of UHECR.
With and erg/Mpc3yr, the CR-luminosity of a source is erg/s. Both and correspond well to relatively powerful AGN.
In vicinity of Milky Way at redshift , or Mpc, there are 12 AGN, including such powerful Seyferts as NGC
4051, NGC 4151, NGC 1068 and radiogalaxy Cen A. It corresponds to
density , consistent with the
density above. At redshift ( Mpc),
there are 19 Seyferts and radiogalaxies which results in
, also in agreement with the
discussed density. We will remind that attenuation length of
proton with eV is 135 Mpc, and with eV is 32 Mpc. The Auger detector with large statistics at
eV will have the good chances to observe
some of these sources.
Acceleration.
In
Eq. (6) we assumed the generation spectrum as at and at with
eV. This spectrum implies two
mechanisms of acceleration. The shock acceleration responsible for
the standard spectrum has . The second
(hypothetical) mechanism is assumed to work at . As a result, the generation spectrum has some feature
near , which we very approximately describe by
Eq. (6). The second component can be due to acceleration
in the jet. A pinch acceleration mechanism which works in jet
plasma was suggested in [45]. Particles are accelerated
with spectrum , where , i.e. exactly as we assume. The maximum energy
is connected with maximum current at discharge and can be higher than eV.
7 Conclusions
We developed the most conservative scenario for the observed UHECR as extragalactic protons.
There are three signatures of UHE protons propagating through CMB: GZK cutoff, bump and dip. While bump is argued to be absent in the diffuse spectra and presence of the GZK cutoff is questioned by the AGASA data, the dip is confirmed with very good accuracy by the AGASA and HiRes data (see Figs. 4, 5).
The predictions for the dip in terms of modification factor are very weakly model-dependent: its shape varies but little with in the interval , the assumption of homogeneity in distribution of the sources is well justified, because UHE protons are collected from the large distances of order Mpc, and its shape is valid for both weak and reasonably strong magnetic fields. For conversion of the observed spectra into modification factor two free parameters are needed: and normalization. For 19 energy bins of the Akeno-AGASA data and two free parameters, the agreement is characterised by and d.o.f.=1.12 for d.o.f.=17.
Modification factor must satisfy . At , as Fig. 4 shows, , which signals about appearance of galactic CR component at energy higher, but not much than given above. This conclusion agrees with recent data of HiRes (see Fig. 6) which show that proton component becomes dominant at eV.
In our model we assume AGN as the sources, with generation spectrum given by Eq. (6). With emissivity erg/Mpc3yr this spectrum describes well the AGASA, HiRes, Fly’s Eye and Yakutsk data. The galactic flux of iron nuclei, calculated in energy range eV from extragalactic flux of our model and all-particle Akeno spectrum agrees well with iron-nuclei flux measured by KASCADE. The spectrum shape is consistent with the Hall diffusion.
Our spectrum has the GZK cutoff and it is consistent with HiRes, Fly’s Eye and Yakutsk data. For the explanation of the AGASA excess at eV another component of UHECR is needed. In this paper we discuss UHECR from SHDM as such component. The calculated spectrum agrees well with observations. We argue that with predicted ratio of primary photons to protons , SHDM does not contradict the AGASA observations [42].
Acknowledgements
We are grateful to our coauthors, Roberto Aloisio and Bohdan Hnatyk, for the pleasure of the joint work and for many fruitful discussions.
References
- [1] M. Takeda et al. [AGASA collaboration], astro-ph/0209422; N. Hayashida et al. [AGASA collaboration], Phys. Rev. Lett. 73, 3491 (1994); K. Shinozaki et al. [AGASA collaboration], Astrophys. J. 571, L117 (2002); T. Abu-Zayyad et al. [HiRes collaboration], astro-ph/0208243; D. J. Bird et al. [Fly’s Eye collaboration], Ap. J. 424, 491 (1994); A. V. Glushkov et al. [Yakutsk collaboration], JETP Lett. 71, 97 (2000); M. Ave et al [Haverah Park collaboration], Astrop. Phys. 19, 61 (2003).
- [2] J. W. Cronin, Proceedings of ICRC 2001.
- [3] K. Greisen, Phys. Rev. Lett. 16, 748 (1966); G. T. Zatsepin and V. A. Kuzmin, JETP Lett. 4, 78 (1966).
- [4] M. Nagano and A. Watson, Rev. Mod. Phys. 72, 689 (2000).
- [5] D. De Marco, P. Blasi and A. Olinto, Astrop. Phys. 20, 53 (2003).
- [6] A. Watson, these Proceedings.
- [7] G. Archbold and P. V. Sokolsky, Proc. of 28th International Cosmic Ray Conference, 405 (2003); G. Thompson, These Proceedings.
- [8] M. Takeda [AGASA collaboration], Ap. J. 522, 225 (1999).
- [9] C. B. Finley and S. Westerhoff, Astrop. Phys. 21, 359 (2004).
- [10] Y. Uchihori et al., Astrop. Phys. 13, 151 (2000).
- [11] R. U. Abbasi et al., astro-ph/0404137.
- [12] S. L. Dubovsky, P. G. Tinyakov and I. I. Tkachev, Phys. Rev. Lett. 85, 1154 (2000).
- [13] Z. Fodor and S. Katz, Phys. Rev. D 63, 23002 (2001).
- [14] H. Yoshiguchi, S. Nagataki, K. Sato, Ap. J. 592, 311 (2003).
- [15] H. Yoshiguchi, S. Nagataki, K. Sato, astro-ph/0404411.
- [16] P. Blasi and D. De Marco, Astrop. Phys. 20, 559 (2004).
- [17] M. Kachelriess and D. Semikoz, astro-ph/0405258.
- [18] P. G. Tinyakov and I. I. Tkachev, JETP Lett. 74, 445 (2001).
- [19] N. W. Evans, F. Ferrer and S. Sarkar, Phys. Rev. D 69, 128302 (2004).
- [20] P. G. Tinyakov, I. I. Tkachev, astro-ph/0301336.
- [21] J. W. Elbert and P. Sommers, Ap. J. 441, 151 (1995).
- [22] G. Cunningham et al, Ap. J. 236, L75 (1980).
- [23] J. R. Hoerandel, Astroparticle Phys. 19, 193 (2003).
- [24] P. L. Biermann and P. A. Strittmatter, Ap. J. 322, 643 (1987).
- [25] E. Waxman, Phys. Rev. Lett. 75, 386 (1995); M. Vietri, Ap. J. 453, 883 (1995).
- [26] V. S. Berezinsky, S. V. Bulanov, V. A. Dogiel, V. L. Ginzburg and V. S. Ptuskin, Astrophysics of Cosmic Rays, North-Holland 1990.
- [27] A. V. Olinto, Phys. Rep. 333, 329 (2000).
- [28] G. Sigle, M. Lemoine and P. Biermann, Astrop. Phys. 10, 141 (1999).
- [29] H. Yoshiguchi et al, Ap. J. 586, 1211 (2003).
- [30] R. Aloisio and V. Berezinsky, astro-ph/0403095.
- [31] V. Berezinsky, A. Z. Gazizov, S. I. Grigorieva, hep-ph/0204357.
- [32] V. S. Berezinsky and S. I. Grigorieva, Astron. Astroph. 199, 1 (1988).
- [33] T. Stanev et al, Phys. Rev. D 62, 093005 (2000).
- [34] V. Berezinsky, A. Z. Gazizov, S. I. Grigorieva, astro-ph/0210095.
- [35] V. Berezinsky, S. I. Grigorieva, B. I. Hnatyk, astro-ph/0403477.
- [36] K.-H. Kampert et al (KASCADE-Collaboration), Proceedings of 27th ICRC, volume ”Invited, Rapporteur, and Highlight papers of ICRC”, 240 (2001).
- [37] R. Aloisio, These Proceedings.
- [38] V. Berezinsky, M. Kachelrieß and A. Vilenkin, Phys. Rev. Lett. 79, 4302 (1997); V. A. Kuzmin and V. A. Rubakov, Phys. At. Nucl. 61, 1028 (1998); M. Birkel, S. Sarkar, Astropart. Phys. 9, 297-309 (1998); V. Berezinsky, P. Blasi, A. Vilenkin, Phys. Rev. D 58, 103315 (1998).
- [39] V. A. Kuzmin and I. I. Tkachev, Phys. Rep. 320, 199 (1999); V. Berezinsky, Nucl. Phys. (Proc. Suppl.) B 87, 387 (2000).
- [40] V. Berezinsky and M. Kachelriess, Phys. Rev. D 63, 034007 (2001); S. Sarkar and R. Toldra, Nucl. Phys. B 621, 495 (2002); C. Barbot and M. Drees, Phys. Lett. B 533, 107 (2002);
- [41] R. Aloisio, V. Berezinsky and M. Kachelrieß, Phys. Rev. D69, 094023 (2004).
- [42] K. Shinozaki et al. (AGASA collaboration), Ap. J. 57, L117 (2002).
- [43] K. Dolag, D. Grasso, V. Springel, I. Tkachev, astro-ph/0310902.
- [44] G. Sigl, F. Miniati, T. A. Ensslin, Phys. Rev. D 68, 043002 (2003); G. Sigl, F. Miniati, T. A. Ensslin, astro-ph/0401084.
- [45] V. V. Vlasov, S. K. Zhdanov, B. A. Trubnikov, Plasma Physics 16, 1457 (1990).