The He II Lyman alpha forest: evaluation of simulated data
Abstract
Using an artificial H I Ly spectrum we simulate the corresponding He II forest with fixed values of and a Doppler parameter consisting of a thermal and a turbulent part. In addition metal lines with line strengths and line density as expected in the case of HS 1700+6416 are superimposed. FUSE-like noise is added. The analysis of the simulated spectra in terms of Doppler profiles recovers the input He IIH I with a scatter by a factor of 10. About 10 % have significantly lower -values for various reasons. The majority of the extremely high -values (up to 1000) are evidently caused by metal lines. We conclude that part of the scatter in of previous analyses of the He II forest in HE 2347-4342 can be regarded as an artifact. However, we confirm that the correlation between small column densities (in voids) and high -values is not a methodical artifact and appears to be a true phenomenon.
Hamburger Sternwarte, Universität Hamburg, Gojenbergsweg 112, 21029 Hamburg, Germany
1. Introduction
Using the column density ratio He IIH I the sources and fluctuations of the intergalactic ionizing continuum can be examined observing the He II Ly forest. Following theoretical predictions is expected to be in the range of (Haardt & Madau 1996; Fardal, Giroux, & Shull 1998) assuming the diffuse background radiation of quasars. Recent analyses of the resolved He II Ly forest towards the QSO HE 2347-4342 reveal values of ranging from 1 to (Kriss et al. 2001; Shull et al. 2004; Zheng et al. 2004). Therefore, the authors suggest that the intergalactical UV background radiation is strongly variable on very small scales requiring the dominance of local sources. However, the scatter can only be explained partly by the different spectral indices of QSOs (Telfer et al. 2002), since the observed scales are much smaller than the typical distances between AGN. Another finding is that absorbers in H I voids show higher -values, a phenomenon that is not yet understood.
On the basis of simulated spectra we investigate, whether the typical quality of the present data is sufficient to recover a constant , and which effects are produced artificially by the analysis technique. Furthermore, we examine the impact of additional metal line absorption on the results.
2. Creating and evaluating the artificial datasets
We generate an artificial Ly forest in the redshift range , which corresponds to the wavelength coverage of the lower FUSE detector segment. The column density distribution function with is adopted from Kirkman & Tytler (1997). The Doppler parameter distribution is described by a truncated Gaussian with km s-1, km s-1, and km s-1 as observed towards HS 1700+6416 in good agreement with Hu et al. (1995). In addition, the parameters of the simulated line sample are correlated by following Misawa (2002). The resolution of and the signal-to-noise ratio of were chosen to match the characteristic of high-resultion spectra taken with VLT/UVES or Keck/HIRES.
The He II Ly forest is computed from the artificial H I data using , the mean value as found by Kriss et al. (2001), and a temperature of , which is cooler than the average measured by Ricotti, Gnedin, & Shull (2000), but consistent with km s-1. Tests with higher temperatures reveal no difference in the results. Metal absorption lines were added with strength and distribution as expected in the spectrum of HS 1700+6416. Line parameters were taken from the observed FUSE spectrum of this QSO. The resolution of and the signal-to-noise ratio of were chosen to match the typical values of real data.
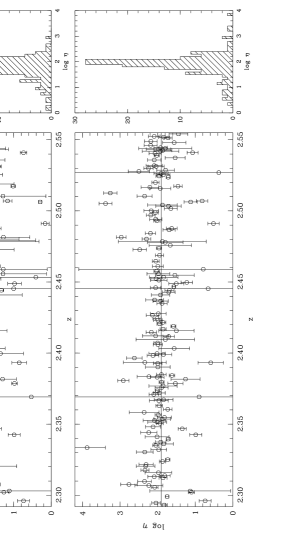
The artificial H I Ly forest was analyzed by fitting Doppler profiles. The statistical properties of the sample are recovered. The He II Ly forest lines were treated the same way using the derived H I parameters. We fixed the line redshift and the -parameter assuming pure turbulent broadening like Kriss et al. (2001). The resulting -values are shown in Fig. 1.
3. Results
From the artificial spectrum without any metal line absorption we find a mean value of , which is less than the expected 1.903. From the spectrum with additional metal lines we get . These values suggest that a scatter of about 0.5 dex in is due to the specifics of method. To analyze in detail what causes the extreme deviations we refer to -values outside the range . Without metals 2.6 % of the absorbers have high and about 14 % low values. The reasons for the extreme -values are
-
•
the He II line is narrower than the adopted pure turbulent H I -parameter
-
•
weak H I lines, whose parameters are estimated incorrectly or which are misidentified
-
•
blending with other He II lines
-
•
line saturation leading to erroneous column densities
The last three points can lead, in principle, to high as well as low -values, while the first one produces only low -values. In contrast to Shull et al. (2004) who found a correlation between low density H I absorbers and high column density ratios using an apparent optical depth method, we find weak H I lines often leading to small . This can be explained by the large uncertainties of weak lines, concerning the line position. Thus, the column densities of the He II lines with fixed redshifts are underestimated.
Generally, the presence of metal lines leads to higher -values as can be seen from the lower panel of Fig. 1, where 80 % of the extremely high -values are due to metals. Furthermore, there are fewer absorbers with low , since blending with metal lines counteracts the other effects. Considering the total sample 5 % of the -values are contaminated by metals. About 15 % of the superimposed metal lines cause higher -values.
References
- Fardal, Giroux, & Shull (1998) Fardal, M. A., Giroux, M. L., & Shull, J. M. 1998, AJ, 115, 2206
- Kirkman & Tytler (1997) Kirkman, D. & Tytler, D. 1997, ApJ, 484, 672
- Haardt & Madau (1996) Haardt, F. & Madau, P. 1996, ApJ, 461, 20
- Hu et al. (1995) Hu, E. M.. Kim, T.-S., Cowie, L. L., Songaila, A., & Rauch, M. 1995, AJ, 110, 1526
- Misawa (2002) Misawa, T. 2002, PhD thesis, University of Tokyo
- Kriss et al. (2001) Kriss, G. A., Shull, J. M., Oegerle, W., Zheng, W., Davidsen, A. F. et al. 2001, Science, 293, 1112
- Ricotti, Gnedin, & Shull (2000) Ricotti, M., Gnedin, N. Y., & Shull, J. M. 2000, ApJ, 212, 383
- Shull et al. (2004) Shull, J. M., Tumlinson, J., Giroux, M. L., Kriss G. A., & Reimers, D. 2004, ApJ, 600, 570
- Telfer et al. (2002) Telfer, R. C., Zheng, W. Kriss, G. A., & Davidsen, A. F. 2002, ApJ, 565, 773
- Zheng et al. (2004) Zheng, W., Kriss, G. A., Deharveng, J.-M., Dixon, W. V., Kruk, J. W. et al. 2004, ApJ, 605, 631