Deep-Ocean Crusts as Telescopes: Using Live Radioisotopes to Probe Supernova Nucleosynthesis
Abstract
Live has recently been detected in a deep-ocean ferromanganese crust, isolated in layers dating from about 3 Myr ago. Since has a mean life of 2.2 Myr, a near-Earth supernova is the only likely source for such a signal, and we explore here the consequences of a supernova origin. We combine the data with several supernova nucleosynthesis models to calculate the supernova distance as a function of progenitor mass, finding an allowed range of pc. We also predict the signals expected for several other radioisotopes, which are independent of the supernova distance. Species likely to be present near or above background levels are , , , and . Of these, and are nearly background-free, presenting the best opportunities to provide strong confirmation of the supernova origin of the signal, and to demonstrate that at least some supernovae are the source for the r-process. The accuracies of our predictions are hampered by large uncertainties in the predicted yields for supernovae of different masses, so the new crust data motivate a redoubled theoretical attack on this problem.
1 Introduction
The possibility of finding terrestrial signatures of near-earth supernova explosions has been intensively discussed over the last decade (see, e.g., Ellis, Fields, & Schramm, 1996; Fields & Ellis, 1999). Recent evidence for a supernova remnant in diameter, that may be associated with -rays, points to an explosion within the past few Myr and within 100–200 pc (McCullough, Fields, & Pavlidou, 2002). Moreover, the existence of the Local Bubble – containing hot, rarefied gas in which the Sun resides (Frisch, 1995) – suggests that we live in the interior of one or more supernova remnants (e.g., Smith & Cox, 2001). This enhances the prospects of identifying terrestrial evidence of supernova remnant engulfing the Solar System and the Earth.
Even if it were too far away to be hazardous for life on Earth (see, e.g., Ruderman, 1975; Ellis & Schramm, 1995), a sufficiently close supernova explosion would deposit on the Earth supernova ejecta and related material produced by cosmic rays (Ellis, Fields, & Schramm, 1996). This could have resulted in the possible uptake of supernova-produced elements in deep-ocean sediments or manganese-iron crusts. Following Ellis, Fields, & Schramm (1996), Knie et al. (1999) discovered the first evidence for live in a deep-ocean ferromanganese crust, at a level times the expected background and consistent with an event in the last Myr at a distance pc (Fields & Ellis, 1999). However, the structure and geometry of the crust made it difficult to reconstruct a reliable time history, and thus the nature of the signal remained uncertain.
Very recently, Knie et al (2004) have studied a different ferromanganese crust, which is better suited for a high-precision study with good time resolution. They find a spike far above background in a crust layer which formed between 2.4 and 3.2 Myr ago. This detection confirms the earlier result, but now goes beyond detecting the presence of to revealing the details of its deposition history. The presence of a live radioisotopic signal in a single, isolated layer agrees with the straightforward expectations of the supernova hypothesis (Ellis, Fields, & Schramm, 1996; Fields & Ellis, 1999). These data greatly strengthen the case that supernova ejecta were deposited on the Earth about 3 Myr ago. This is a major new result, and one that finally gives a strong direct empirical basis for longstanding speculation and arguments based on indirect evidence regarding the possibility of near-Earth supernova explosions in the geological past.
In light of the Knie et al (2004) result, the time is ripe to take the supernova hypothesis seriously and investigate its consequences quantitatively. Specifically, in this paper we show how ferromanganese crusts can be used as telescopes to probe directly the r-process in supernovae.
2 Summary of the Data
Knie et al (2004) measured and (mean life Myr) throughout the ferromanganese crust 237KD, using accelerator mass spectrometry techniques. Over the 28 layers studied, just 69 live atoms were detected. This signal was found uniquely in layers corresponding to a time interval 111 The crust was analyzed with two different time resolutions but even the smaller timespan of 0.3 Myr in the finer resolution analysis is expected to be an artifact representing an upper limit on the physical deposition timescale, which is likely to be of order kyr.
| (1) |
before the present. The resulting isotopic fraction is
| (2) |
which is a highly significant result, despite its small magnitude, testifying to the sensitivity and precision of the experiment. The principal uncertainty in this result is due to instrumental background, essentially the contamination due to stable isobars.
Given the crust size and Fe composition, the isotopic fraction can be used to infer a surface density of . To do this, one must also correct for radioactive decay and geometric effects, and the result is
| (3) |
In order to infer the incident fluence of , this result must be corrected for geometry and an uptake factor. Assuming the terrestrial fallout is isotropic, a geometric factor 1/4 arises from the ratio of the Earth’s full cross section () to its total surface area (). Also, the crust incorporates only a certain percentage of all deposited material incident upon it, and a so-called ‘uptake factor’ accounts for this effect (for further discussion, see Knie et al, 2004; Knie et al., 1999), leading to
| (4) |
The uptake factors are different for each sample and every element, and thus cannot be evaluated independently of the details of the sample. Consequently, in the following discussion we present results for , with the understanding that all the results presented must be reduced by the appropriate uptake factor, which may be inferred from studies of stable isotopes.
Knie et al (2004) use Mn and Fe data to infer an iron uptake factor , from which they infer an incident fluence of
| (5) |
This signal encodes key information about the supernova explosion, as we now see.
3 Predictions: Supernova Distance and Other Radioisotope Signals
The deposited amount of supernova-produced material of an isotope is dependent on the distance of the event and the total ejected mass . The fluence, i.e., the number of atoms per unit area that arrive at the Earth, is (Fields & Ellis, 1999; Ellis, Fields, & Schramm, 1996):
| (6) |
where is the mass number of isotope and is the proton mass. Present-day measurements of the fluence must also be corrected for decay.
The isotopic fraction of in the crust is determined by the relative amounts of supernova ejecta and substrate deposited within the observed time interval. If the substrate material has density and deposition rate , then the total mass flux onto the crust is , and the iron flux onto the crust is , where (Hein et al., 2000) is the iron mass fraction in the crust, and other elements can be treated in a corresponding way. Finally, if the supernova signal is measured with a time resolution , the surface density of crust atoms deposited is , where is the mean mass number of the element, and so the isotopic fraction of in the crust is
| (7) | |||||
| (8) |
where the fiducial numbers are for the signal at 3 Myr, with and .
The confirmed observation of a live signal spurs us to predict the inventory of all long-lived radioisotopes. For each, given the yield , one can readily compute the fluence and/or surface density, based on the signal:
| (9) |
a result that is independent of supernova distance . Consequently, detection of any radioisotopic species would immediately measure the ratio of its yield relative to , and thus probe supernova nucleosynthesis - assuming that the uptake factors are known, and that the Earth receives an isotropic ‘fair sample’ of all supernova ejecta 222The uptake factors can be obtained from studies of stable isotopes or, in the case of , from studies of the recent deposition of anthropogenic Pu on the surface of the crust (Wallner et al., 2004).. Indeed, even a significant upper limit could provide important information.
The explosion signals divide into radioisotopes from three sources: supernovae, the r-process and cosmic rays, and we consider each of these in turn.
3.1 Supernova Isotopes
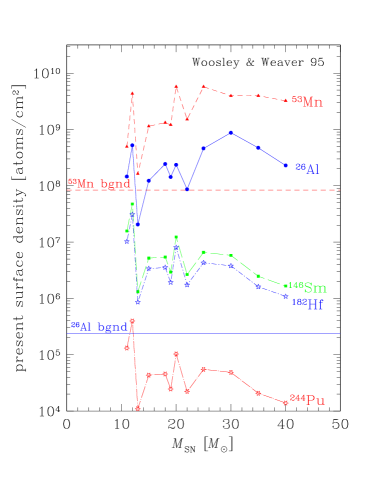
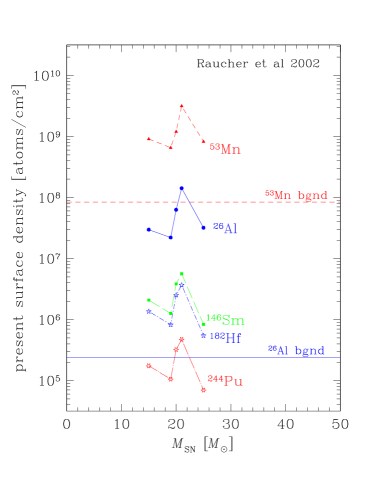
To get an impression of the distance of the supernova, one needs to know the yield of a supernova. This and the yields of other isotopes have been calculated in Woosley & Weaver (1995), and more recently again in Rauscher, Heger, Hoffman, & Woosley (2002). The 12 supernova explosion models of Woosley & Weaver (1995) span a mass range from , and the 5 newer calculations in Rauscher, Heger, Hoffman, & Woosley (2002) cover the range . The latter give a higher yield than those calculated in Woosley & Weaver (1995). A common feature of the yields in the two papers is strong variation over the observed mass range, which attests to the difficulty of calculating the production of this element, reflected also in differences between the results of Rauscher, Heger, Hoffman, & Woosley (2002) and Woosley & Weaver (1995) for supernovae of similar masses. Nevertheless, we use these mass yields together with eq. (6) to calculate the possible supernova distance , albeit with considerable uncertainties induced by the different mass yields.

The results of this calculation can be seen in Fig. 1, where we see that the distances cover a range between pc and pc. This range is similar to that found in the similar analysis of Knie et al (2004). More generally, this distance range falls within limits set by Ellis & Schramm (1995) and Ellis, Fields, & Schramm (1996), who note that a supernova closer than 10 pc could be devastating to life on earth (e.g., Ruderman, 1975), whereas a supernova that was too far away would not have the power to overcome the solar wind and deposit a noticeable amount of isotopes.
Having estimated the distance, it is now easy to obtain the surface densities (4) of other sufficiently long-lived supernova-produced elements like ( Myr), ( Myr) and ( Myr), using again the values of Rauscher, Heger, Hoffman, & Woosley (2002) and Woosley & Weaver (1995) for the ejected masses of , and . The results for and are shown in Figure 2, and vary wildly, due to the variations in the mass yields. A better prediction of the yields would therefore be a valuable input into future calculations. On the other hand, the detection in the sample of Knie et al (2004) (or in comparable samples) of other isotopes, besides , whose yields are not as wildly varying (e.g. ), would allow for a more accurate calculation of the distance and hence stronger predictions for the surface densities of other supernova isotopes, and possibly the supernova mass as well. At the present stage, the results shown in Figure 2 can be used only to get a feel for the expected order of magnitude (without uptake factors) of the surface densities of supernova isotopes. As we see in the next Section, the corresponding results for are not worth showing because of the high expected background.
3.2 r-Process Elements
The r-process elements present a special case. These are nuclides which are created when ‘seed’ nuclei – typically iron-peak elements – are exposed to a rapid burst of neutrons. Whilst the microphysics and thermodynamical requirements for the r-process are fairly well understood, its astrophysical site is not yet known; both core-collapse supernovae (e.g., Woosley et al., 1994) and neutron-star mergers (Eichler, Livio, Piran, & Schramm, 1989) have been studied in some detail. Consequently, a firm correlated detection of a known supernova-produced isotope (e.g., , , , or ) with an r-process isotope (, , or ) would be of the utmost importance: it would provide direct proof that at least some supernovae do generate r-process elements. Intriguingly, Wallner et al. (2004) report the detection of a single live atom in the same crust that contained the original live signal (Knie et al., 1999). One obviously should not overinterpret such a marginal result, but we are encouraged that searches are becoming feasible, and we advocate strongly further searches for all r-process elements.
In order to get a feel for the expected order of magnitude of the surface density of , and , we must determine the supernova yields of these elements. We do this empirically, by noting that, in metal-poor Galactic halo stars, the heaviest elements are always distributed in the same ratios as the solar r-process component. This result implies that, at least for the heaviest elements (including the species of interest here), the r-process yield distribution is ‘universal’, i.e., always produced in the solar ratios: (Fields, Truran, & Cowan, 2002) and refs. therein. Thus, all r-process isotopes are fixed once one is known. We make this normalization using the halo star observations, and choose Eu. Fields, Truran, & Cowan (2002) use observations of Eu and Fe in halo stars to deduce that one supernova produces . It then follows that any other species has . For solar abundances of the r-process elements, we use a recent theoretical model (Pfeiffer, Kratz, & Thielemann, 1997; Cowan et al., 1999), from which we extract the following ratios: , , and ; this gives supernova yields
| (10) |
Using eq. (4), one can now calculate the surface densities of the r-process elements in question, and our results are shown in Figure 2. Notice again the wild variations at the present stage, which allow the shown results only to give an impression of the expected orders of magnitude of the surface densities.
Estimates of the expected backgrounds are given in the next Section.
3.3 Cosmic-Ray Production: Be
Finally, we consider the possibility of a supernova signal due to Be by cosmic rays. The explosion of a nearby supernova enhances the cosmic ray flux at Earth, and the element that is dominantly produced is Be ( Myr). Ellis, Fields, & Schramm (1996) estimate that an average supernova will put a fraction of its mechanical energy into the production of cosmic rays with an average energy of GeV. Thus we get a cosmic ray fluence of
| (11) |
The deflecting effects of the solar wind mean that only some fraction of cosmic rays penetrate to the Earth. Following Fields & Ellis (1999), we take .
The enhanced cosmic-ray fluence at Earth increases radioisotope production in the atmosphere, according to
| (12) |
where is the branching ratio for cosmic-ray production of isotope ; a useful tabulation of these appears in O’Brien, de La Zerda Lerner, Shea, & Smart (1991). Using eq. (12) with , from eq. (11), and the distances from Figure 1, one finds a Be fluence of at most , and a surface density of at most .
4 Backgrounds
We now consider the dominant sources of backgrounds to these various signals, which originate from different sources.
4.1 Background for and : Meteoritic Infall
The backgrounds for and are dominated by the infall of meteorites. These have been exposed to cosmic rays, causing an enhancement of certain elements due to spallation. An introductory discussion of meteoritic backgrounds can be found in Fields & Ellis (1999). The flux of infalling isotopes can be calculated as
| (13) |
where is the infalling meteoritic mass rate (Peucker-Ehrenbrink, 1996; Esser & Turekian, 1988; Love & Brownlee, 1995) and is the mass fraction of isotope found in Solar-System meteorites. Michel et al. (1991) examine the production of isotopes in meteorites due to cosmic rays. They give their main tabulated results in terms of the specific activity , which is the number of decays per minute and kg of iron or rock, respectively, for or . We take the fiducial values of 400 dpm/kg Fe and 40 dpm/kg Si. In fact, has more than one production branch, but as Si is the most dominant element we will use it for an estimate of the background. We assume the infalling meteorites to have an iron mass fraction and a silicon mass fraction (Anders & Grevesse, 1989). For a meteorite with such mass fractions, we obtain and therefore and . With these, we find fluxes of
| (14) | |||||
| (15) |
In order to calculate the background fluence and surface density we have to multiply the flux by the time resolution. Recalling that the signal in Knie et al (2004) spreads over a time of approximately Myr, we obtain surface densities of
| (16) | |||||
| (17) |
In comparison with the signal strengths of order for and for , these backgrounds are negligible.
4.2 Background for and : Cosmic-Ray Interactions
A different approach has to be taken for calculating the backgrounds to and , as these nuclides are primarily produced by the direct interaction of cosmic rays with the atmosphere. Using eq. (12), with the ambient cosmic-ray proton flux and a time resolution Myr, for one finds . Consequently, one obtains a present-day surface density of
| (18) |
This is to be compared with a signal strength and we therefore do not expect the detection of in the ferromanganese crust sample of Knie et al (2004) or in similar samples.
4.3 Background for , , and : Fission
As , and are extinct radioactive isotopes, they do not have a significant abundance in Solar-System meteorites. Moreover, they are not produced in sufficient amounts by cosmic ray spallation. The only background source is spontaneous fission of actinides. Such decays lead to a distribution of daughter products, but these only contribute significantly to , not to .
We estimate the spontaneous fission background of as follows. The dominant parent nucleus is , with a fission lifetime yr. If the fission branching ratio to is , then the equilibrium fission background thus has . The background flux onto the crust is then (where is the total mass flux onto the sample, and is the mass fraction of in the Earth’s crust). Thus the background accumulated in a resolution time Myr is
| (19) |
which is larger then our prediction by about an order of magnitude. Thus we conclude that the is probably too small to see.
Since is heavier than ambient U and Th, it is not produced by fission. Apart from recent human activity, the only known possible source of is the r-process. Moreover, anthropogenic is expected to be negligible in the ferromanganese crusts of interest.
5 Discussion
Following the prediction of Ellis, Fields, & Schramm (1996), Knie et al. (1999) found initial evidence for supernova in a ferromanganese crust, prompting Fields & Ellis (1999) to discuss other isotopic signatures of a nearby supernova. The exciting new result of Knie et al (2004) confirms the earlier observation with higher significance and more precise dating, motivating this paper. Using the data of Knie et al (2004) to estimate the local interstellar fluence of and combining this with the total mass of ejected by diverse supernovae (Rauscher, Heger, Hoffman, & Woosley, 2002; Woosley & Weaver, 1995), we have inferred a supernova distance range pc, consistent with Knie et al (2004).
The detection and nucleosynthesis models together allow us to make distance-independent predictions for other radioisotopes. For supernova-produced isotopes such as , and , we find that yields of the first two of these isotopes are likely to be detectable above background. We also consider the r-process elements , , and , finding again that the first two are likely to exceed background. If the supernova responsible for the observations of Knie et al (2004) was also a site for the r-process, clear signals should be visible. This would finally provide direct proof that supernovae are sites for the r-process.
The firm detection of also adds support to recent ideas regarding the origin of the Local Bubble. Smith & Cox (2001) concluded that several events are needed to create the Local Bubble, the last occurring within the past 5 Myr in order to maintain the high interstellar temperature. Maíz-Apellániz (2001) argued that the need for multiple events points to correlated explosions within an OB association, and specifically suggested the Lower Centarus Crux (LCC) of the Sco-Cen association as the likely site. Benítez, Maíz-Apellániz, & Canelles (2002) have examined the possibility that this OB association could have been the site of the progenitor. From kinematic considerations they find that the closest approach of the LCC was about 100 pc, with considerable uncertainties. Taken at face value, this result is in the upper part of our range of distance estimates. This suggests that either the event was a distant one (and thus the yield was high), or that the LCC approach was closer than estimated, or that the LCC was not the event site.
The accuracies of our predictions for the fluences of these isotopes are limited by the wide variations in the yields found in calculations for different progenitor masses, and between different model calculations (Rauscher, Heger, Hoffman, & Woosley, 2002; Woosley & Weaver, 1995). Therefore, at the present stage our results give only approximate estimates of the expected orders of magnitude of the fluences of supernova isotopes. This underlines the great need for more theoretical studies of production in supernovae, able to reduce the calculational uncertainties. Such a reduction would be necessary before one could predict any biological effects that might be associated with the supernova responsible for the observations of Knie et al. (1999) and Knie et al (2004).
Measurements using other ferromanganese crusts would be most welcome, and observations of other supernova radioisotopes have high priority. These would enable one to evade the uncertainties associated with the yield. Another helpful calibration point comes from the recent evidence (Smith, 2004) for the -ray line signal from the decay of interstellar . This reflects the current Galactic inventory, and constrains nucleosynthesis averaged over all sources (Prantzos, 2004).
The important results of Knie et al. (1999) and Knie et al (2004) open up a new era of ‘deep-ocean crust astronomy’. After providing already the first observations of the terrestrial impact of a nearby supernova, their measurements now offer the prospect of verifying directly that the r-process takes place, at least partly, in ejecta from supernovae.
References
- Anders & Grevesse (1989) Anders, E. & Grevesse, N. 1989, Geochim. Cosmochim. Acta, 53, 197
- Benítez, Maíz-Apellániz, & Canelles (2002) Benítez, N., Maíz-Apellániz, J., & Canelles, M. 2002, Physical Review Letters, 88, 081101
- Cowan et al. (1999) Cowan, J. J., et al 1999, ApJ, 521, 194
- Eichler, Livio, Piran, & Schramm (1989) Eichler, D., Livio, M., Piran, T., & Schramm, D. N. 1989, Nature, 340, 126
- Ellis, Fields, & Schramm (1996) Ellis, J., Fields, B. D., & Schramm, D. N. 1996, ApJ, 470, 1227
- Ellis & Schramm (1995) Ellis, J.& Schramm, D. N. 1995, Proc. Nat. Acad. Sci., 92, 235
- Esser & Turekian (1988) Esser, B. K. & Turekian, K. K. 1988, Geochim. Cosmochim. Acta, 52, 1383
- Fields & Ellis (1999) Fields, B. D. & Ellis, J. 1999, New Astronomy, 4, 419
- Fields, Truran, & Cowan (2002) Fields, B. D., Truran, J. W., & Cowan, J. J. 2002, ApJ, 575, 845
- Frisch (1995) Frisch, P. C. 1995, Space Science Reviews, 72, 499
- Hein et al. (2000) Hein, J.R., et al. 2000, in Handbook of Marine Mineral Deposits, ed. D.S. Cronan (New York: CRC Press), 239
- Knie et al. (1999) Knie, K., et al. 1999, Phys. Rev. Lett., 83, 18
- Knie et al (2004) Knie, K. et al. 2004, Phys. Rev. Lett., 93, 171103
- Love & Brownlee (1995) Love, S. G. & Brownlee, D. E. 1995, Science, 262, 550
- Maíz-Apellániz (2001) Maíz-Apellániz, J. 2001, ApJ, 560, L83
- McCullough, Fields, & Pavlidou (2002) McCullough, P. R., Fields, B. D., & Pavlidou, V. 2002, ApJ, 576, L41
- Michel et al. (1991) Michel, R., Dragovitsch, P., Cloth, P., Dagge, G., & Filges, D. 1991, Meteoritics, 26, 221
- O’Brien, de La Zerda Lerner, Shea, & Smart (1991) O’Brien, K., de La Zerda Lerner, A., Shea, M. A., & Smart, D. F. 1991, The Sun in Time, 317
- Peucker-Ehrenbrink (1996) Peucker-Ehrenbrink, B. 1996, Geochim. Cosmochim. Acta, 60, 3187
- Pfeiffer, Kratz, & Thielemann (1997) Pfeiffer, B., Kratz, K.-L., & Thielemann, F.-K. 1997, Zeitschrift fur Physik A Hadrons and Nuclei, 357, 235
- Prantzos (2004) Prantzos, N. 2004, A&A, 420, 1033
- Rauscher, Heger, Hoffman, & Woosley (2002) Rauscher, T., Heger, A., Hoffman, R. D., & Woosley, S. E. 2002, ApJ, 576, 323
- Ruderman (1975) Ruderman, M. 1975, Science, 184, 1079
- Smith (2004) Smith, D. M. 2004, New Astronomy Review, 48, 87
- Smith & Cox (2001) Smith, R. K. & Cox, D. P. 2001, ApJS, 134, 283
- Wallner et al. (2004) Wallner, C., Faestermann, T., Gerstmann, U., Knie, K., Korschinek, G., Lierse, C., & Rugel, G. 2004, New Astronomy Review, 48, 145
- Woosley & Weaver (1995) Woosley, S. E. & Weaver, T. A. 1995, ApJS, 101, 181
- Woosley et al. (1994) Woosley, S. E., Wilson, J. R., Mathews, G. J., Hoffman, R. D., & Meyer, B. S. 1994, ApJ, 433, 229