HST/ACS Coronagraphic Imaging of the AU Microscopii Debris Disk
Abstract
We present Hubble Space Telescope Advanced Camera for Surveys multicolor coronagraphic images of the recently discovered edge-on debris disk around the nearby ( pc) M dwarf AU Microscopii. The disk is seen between 075 – 15” (7.5 – 150 AU) from the star. It has a thin midplane with a projected full-width-at-half-maximum (FWHM) thickness of 2.5 – 3.5 AU within AU of the star that increases to 6.5 – 9 AU at AU. The disk’s radial brightness profile is generally flat for AU, then decreases gradually () out to AU, beyond which it falls rapidly (). Within 50 AU the midplane is straight and aligned with the star, and beyond that it deviates by , resulting in a bowed appearance that was also seen in ground-based images. Three-dimensional modelling of the disk shows that the inner region ( AU) is inclined to the line-of-sight by and the outer disk by . The inclination of the outer disk and moderate forward scattering () can explain the apparent bow. The intrinsic, deprojected FWHM thickness is 1.5 – 10 AU, increasing with radius. The models indicate that the disk is clear of dust within AU of the star, in general agreement with the previous prediction of 17 AU based on the infrared spectral energy distribution. The disk is blue, being 60% brighter at than relative to the star. One possible explanation for this is that there is a surplus of very small grains compared to other imaged debris disks that have more neutral or red colors. This may be due to the low radiation pressure exerted by the late-type star. Observations at two epochs show that an extended source seen along the midplane is a background galaxy.
1 Introduction
Collisions of planetesimals around a star produce dust grains, creating a debris disk that can be detected in thermal emission and scattered light. Without the continual replenishment of these grains, most of the disk will disappear due to radiation and wind pressure, Poynting-Robertson drag, grain coagulation, and tidal interactions with planets. The lifetime of such disks is not fully understood, and it may depend strongly on the luminosity of the star.
While numerous detections and images of optically-thick accretion disks have been made, only a few debris disks have been resolved. The current inventory of imaged debris disks is largely derived from IRAS-measured infrared excesses of stars. This list is biased toward stars of spectral types A – F because their luminosities are high enough to heat a debris disk to a IRAS-detectable level. More luminous stars would blow away such disks while cooler stars cannot heat them enough to be detected. Most of the resolved debris disks surround A stars ( Pictoris, Vega, Fomalhaut, HD 141569A, and HR 4796), and only a few have been seen in scattered light. The sensitivity limits of IRAS leave uncertain the frequency of debris disks around later-type stars. The disk around Eridani, a K2V star with one of the largest IRAS-measured stellar excesses, was detected by IRAS only because of its very close proximity (3.2 pc) to us. The Spitzer Space Telescope should provide a much more comprehensive catalog of disk candidates around later-type stars.
There are only two M dwarfs, AU Microscopii and Hen 3-600 (Song et al. 2002), not associated with molecular clouds that have IRAS-measured infrared excesses. AU Mic (HD 197481, GJ 803) is a M1Ve flare star and a BY Dra-type variable (; Cutispoto, Messina, & Rodonò 2003). Barrado y Navascués et al. (1999) identified AU Mic as part of the Pictoris moving group, an association of nearby (10 – 50 pc) young stars. It is at a Hipparcos-measured distance of 9.94 pc (Perryman et al. 1997) and is about 10 Myr old (Zuckerman et al. 2001). Its excess implies that AU Mic has a substantial amount of circumstellar material. These characteristics led the Hubble Space Telescope (HST) Advanced Camera for Surveys (ACS) Investigation Definition Team (IDT) to include the star in its circumstellar disk imaging program.
A disk around AU Mic was recently imaged from the ground using coronagraphs (Kalas, Liu, & Matthews 2004, hereafter KLM04; Liu 2004, hereafter L04). These images show a disk that at first glance resembles that of Pic. It is viewed nearly edge-on and has a radius of at least 21” (210 AU). The Keck adaptive optics image of L04 also shows small-scale variations in the midplane that might be due to localized density enhancements caused by unseen substellar companions that perturb the disk. So far, imaging within 15 of the star has not been possible from the ground. The high resolution of ACS and its ability to see closer to the star can provide more detailed views of this disk.
2 Observations, Photometry, and Processing
2.1 Observations and Calibration
The ACS IDT observations of AU Mic utilized the coronagraphic mode of the ACS High Resolution Camera, which has a pixel scale of mas pixel-1 and a coronagraphic field point spread function (PSF) full-width-at-half-maximum (FWHM) of 72 mas at , 63 mas at , and 50 mas at . The 09 occulting spot was used for all observations. The coronagraph suppresses the diffraction pattern of the central star, reducing the surface brightness of its wings by . The remaining flux from the occulted source is dominated by scattered light from the telescope optics for 15 and by light diffracted by the occulting spot for 15. The latter appears as concentric rings around the image of the spot. Because of the stability of HST, most of the residual light can be subtracted using an image of another star.
As AU Mic was on the ACS IDT target list before discovery of its disk, the team’s standard observation strategy for suspected disks was used: initial imaging in one filter to confirm the existence of a disk, followed later with multi-color imaging. The ACS exposures are listed in Table 1. The first images (HST program 9987) were taken on 3 April 2004 in filter F606W (wide -band) and the second set (program 10330) on 24 July 2004 in F606W, F435W (ACS ) and F814W (ACS wide ). The telescope orientations were specified to place the disk diagonally on the detector, and the orientations of the two sets of images were separated by 90∘. Exposures of HD 216149 ( = 5.4) in the same filters were taken after AU Mic at both epochs for use in PSF subtraction. This star was chosen because it is bright, is of a similar color as AU Mic, and is near AU Mic on the sky so that any attitude-dependent focus variations could be minimized. In addition to the coronagraphic exposures, short, direct (noncoronagraphic) images were taken to provide photometry of the stars.
| Star | Date | Filter | Exposure | Gaina | Typeb |
|---|---|---|---|---|---|
| AU Mic | 3 April 2004 | F606W | 2 x 0.1 s | 4 | D |
| 3 x 750 s | 2 | C | |||
| 2 x 1400 s | 2 | C | |||
| 24 July 2004 | F435W | 1 x 0.1 s | 4 | D | |
| 1 x 60 s | 2 | D | |||
| 4 x 1279.5 s | 2 | C | |||
| F606W | 1 x 0.1 s | 4 | D | ||
| 1 x 60 s | 2 | D | |||
| 2 x 915 s | 2 | C | |||
| F814W | 1 x 0.1 s | 4 | D | ||
| 1 x 60 s | 2 | D | |||
| 3 x 853 s | 2 | C | |||
| HD 216149 | 3 April 2004 | F606W | 2 x 0.1 s | 4 | D |
| 2 x 90 s | 2 | C | |||
| 8 x 225 s | 2 | C | |||
| 24 July 2004 | F435W | 1 x 0.1 s | 4 | D | |
| 2 x 5 s | 2 | D | |||
| 2 x 475 s | 2 | C | |||
| F606W | 1 x 0.1 s | 4 | D | ||
| 2 x 5 s | 2 | D | |||
| 2 x 145 s | 2 | C | |||
| F814W | 1 x 0.1 s | 4 | D | ||
| 2 x 5 s | 2 | D | |||
| 2 x 145 s | 2 | C |
All of the images were calibrated by the HST pipeline. To account for vignetting around the occulting spot, the coronagraphic images were manually divided by the spot flats available from the ACS reference files page at the Space Telescope Science Institute (STScI) web site. Because the spot varies in position over time, each spot flat was shifted to the appropriate position as listed on the ACS web page. The duplicate exposures were combined with cosmic ray rejection. At this stage, the images were not corrected for geometric distortion.
2.2 Stellar Photometry
Photometric measurements of the two stars are required to properly normalize the HD 216149 images prior to subtraction from those of AU Mic. The AU Mic fluxes were measured from the short, noncoronagraphic images using circular apertures with radii of 13 (F435W), 25 (F606W), and 30 (F814W) pixels, increasing in size to account for the larger PSFs at longer wavelengths. The short exposures of HD 216149 were saturated. As reported by Gilliland (2004) 111ACS Instrument Science Report ISR 04-01 (Gilliland 2004) is available at http://www.stsci.edu/hst/acs/documents/isrs., the well depth of an HRC pixel is 160,000 e-, which is within the 16-bit range of the electronics when a gain of 4 e- per data unit is used. Saturating the pixel does not saturate the analog-to-digital converter, so flux is not lost when a pixel saturates but instead overflows into an adjacent pixel. As Gilliland (2004) showed, in this case the counts are conserved, and summation within an aperture that has a radius that encompasses all of the saturated pixels should provide the same countrate as in an unsaturated image. The fluxes for HD 216149 in the three filters were measured using 30 pixel radius apertures, which include all of the saturated pixels.
The measured photometry for both stars were corrected to effectively infinite apertures using conversion coefficients derived from encircled energy curves of well-exposed, high-dynamic-range images of other stars. Because the AU Mic and HD 216149 measurements were made using images that had not been corrected for ACS geometrical distortion, compensation for pixel-area-distortion was made using the pixel area maps provided by STScI (Pavlovsky et al. 2004)222 ACS Data Handbook (Pavlovsky et al. 2004) is available at http://www.stsci.edu/acs/documents.. The instrumental fluxes were converted to standard BVIc magnitudes (Table 2) using the STSDAS SYNPHOT synthetic photometry program assuming M1V (for AU Mic) and M0III (for HD 216149) spectra.
| Star | Date | Passband | Magnitudea |
|---|---|---|---|
| AU Mic | 3 April 2004 | 8.63 0.03 | |
| 24 July 2004 | 9.96 0.05 | ||
| 8.64 0.03 | |||
| 6.60 0.03 | |||
| HD 216149 | 3 April 2004 | 5.46 0.03 | |
| 24 July 2004 | 6.71 0.05 | ||
| 5.46 0.03 | |||
| 4.05 0.03 |
2.3 PSF Subtraction
The HD 216149 coronagraphic images were normalized to match the measured AU Mic fluxes. They were then iteratively shifted by subpixel amounts via cubic convolution interpolation and subtracted from the AU Mic images until the residual scattered light patterns were visibly minimized. This procedure appears to align the two stars to within 0.05 pix, aided by the high-spatial-frequency streaks in the residual pattern, which can be seen radiating from the star in Figures 1c-1f. After subtraction, the images were corrected for geometric distortion. The diffraction patterns inside and around the edge of the occulting spot were not well subtracted. Their shapes and intensities are quite sensitive to the alignment of the star behind the spot, which at worst differed by 16 mas between AU Mic and the reference PSF. They are also sensitive to focus changes and small differences between the spectra of the stars over a filter’s bandpass. Their residuals, which appear as alternating positive and negative rings, are the dominant source of error for 15, where they create localized uncertainties of on 01 scales in the disk brightness in the F606W images. While there are oscillations within and around the spot in both F606W images, they appear to have mean residuals near zero. However, in F814W the spot interior appears oversubtracted, and in F435W it is undersubtracted, probably due to focus mismatches. Further out the background is dominated by scatter-subtraction residuals, which cause pixel-to-pixel errors of .
In addition to the coronagraphic images, we also subtracted the longest noncoronagraphic exposure of HD 216149 from that of AU Mic. While this clearly revealed the disk, it did not allow detection of it within 1” of the star due to high subtraction residuals, providing no improvement over the coronagraphic subtractions. We also used the two F606W coronagraphic images of AU Mic to subtract each other, but due to differences in the spot positions between the two epochs, the subtraction residuals were larger than those when HD 216149 was used.
3 Results
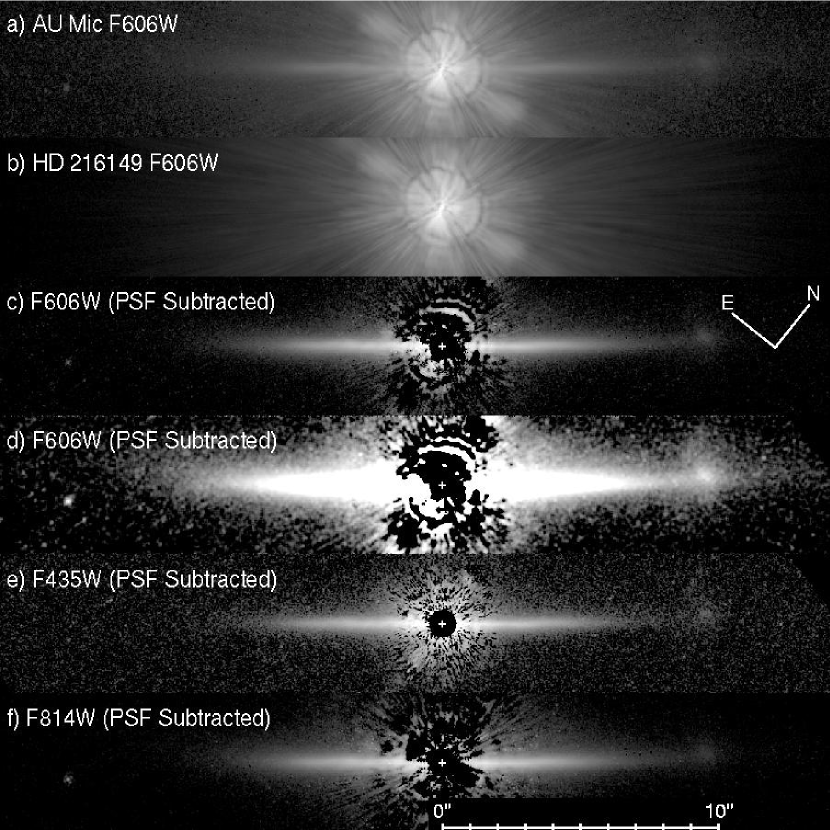
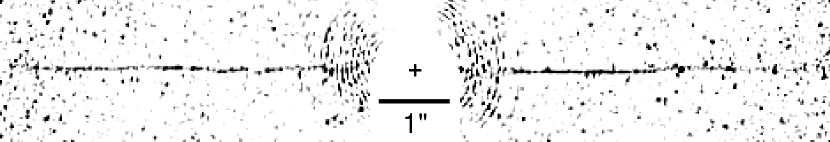
The AU Mic disk stands out against the background PSF structure in the ACS coronagraphic images (Figure 1a) even before PSF subtraction. In the first epoch F606W image (the deepest exposure) the northwestern side is detected out to the edge of the detector, 1525 (150 AU) from the star, and the southeastern side to 14” (140 AU). The disk can be seen to a height of 25 (25 AU) above the midplane. The observed radial and height extents in this image are sensitivity-limited. The interior of the occulting spot is filled with light that was not blocked by the spot (which is located in the aberrated HST beam) and was afterward modified by the corrective ACS optics. An image of the star at the spot’s center allows accurate measurement of the stellar position. An extended source, which shall later be shown to be a background galaxy, can be seen superposed on the NW midplane, 96 from the star. A point source is also seen ” SW of the disk midplane 137 SE from the star. A few background galaxies are also seen throughout the field.
The PSF-subtracted image more clearly reveals the disk (Figure 1c-f). Because the disk is fairly bright close to the star and the corrective optics modify the aberrated light that passes by the occulter, the disk can actually be seen inside the spot, to within 075 of the star. The residual levels indicate that using the coronagraph with PSF subtraction improves the disk-to-background contrast by compared to direct imaging without subtraction. Significant residuals are present in a bar of instrumentally-scattered light that extends from the upper left to lower right of the coronagraphic field, but these are positioned away from the disk. The F606W subtractions from each epoch are of comparable quality, while the F814W subtraction has large residuals near and within the spot, probably due to focus differences between the two images. The residuals in the F435W image are more uniform than in the other two filters, but because AU Mic is much fainter in that passband, the effects of electronic noise are more significant.
The extended source detection limits in the subtracted images were estimated by adding 1” 1” uniform-intensity squares to the data at 3” and 9” from the star perpendicular to the circumstellar disk. The squares’ intensities were adjusted until they could no longer be visually detected. The derived visual detection limits are = 23.3 and 23.5 mag arcsec-2 (F435W), = 22.6 and 24.0 (F606W), and = 20.4 and 21.9 (F814W), for 3” and 9”, respectively, with estimated errors of mag arcsec-2.
3.1 Disk Morphology
Analysis of the disk morphology is largely confined to the first epoch F606W observation, as it was the first and deepest exposure. As will be shown in Section 3.3, there are no significant differences in the disk morphology among the three filters.
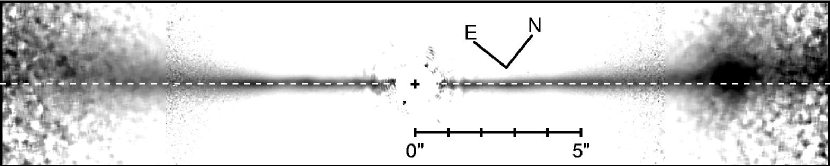
To allow accurate measurement of the disk orientation, simple spatial filtering was applied to highlight the midplane. The image was subtracted by a copy of itself that was smoothed by a pixel median filter. This removed the extended vertical wings while preserving the sharp peak of the midplane seen within 5” of the star (Figure 2). A line fit to the resulting image shows that the inner (”) midplane is oriented at PA=128.6. There are small ( mas), oscillations in the midplane position about this line, which passes directly through the star. Superposing this line over the original image highlights the deviation of the outer (”) midplane from the inner (Figure 3). At large angles, the disk looks “bowed”, an effect noted in the ground-based images and also seen in the Pic disk (Kalas & Jewitt 1995). The apparent outer disk midplane measured by-eye at =125 is oriented along PA= on the NW side and PA= on the SE. These angles are consistent with those reported by KLM04 and L04.
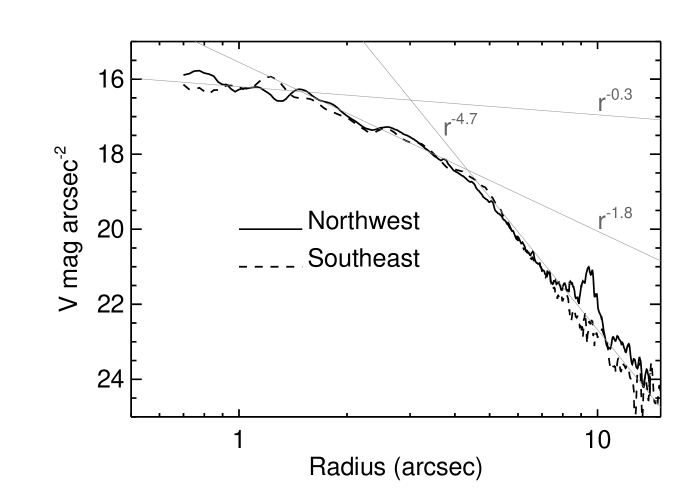
Radial surface brightness profiles along the disk midplane, accounting for the bow, are shown in Figure 4. Both sides of the disk appear to have very similar profiles, though the NW side is brighter beyond 10” (100 AU) by relative to the SE. The mean midplane radial brightness profile may be reasonably divided into three zones described by different power laws. The inner zone ( 15) is nearly flat (). The middle zone (15 43) has a moderate radial decrease in brightness (), which is slightly steeper than that measured by L04 ( to ). The outer zone ( 43) drops off rapidly (), which is steeper than the measured by KLM04 between 6” – 16” but consistent with the reported by L04.
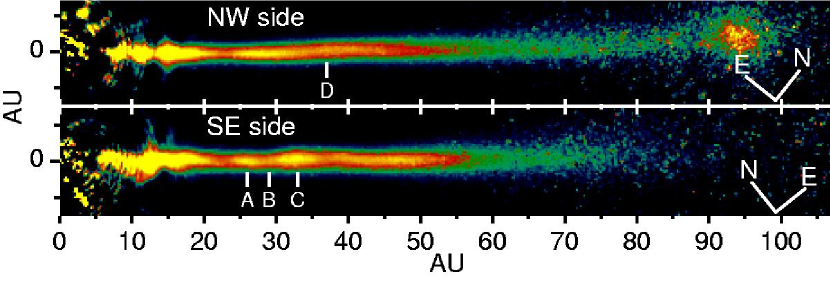
Localized deviations from the large-scale brightness profile are present. There are dips at = 23 (23 AU) on both sides that appear to be genuine and not PSF subtraction artifacts. Between 43 and 53 the SE side is brighter than the NW. Within 15 the subtraction residuals are too large to identify any localized asymmetries of less than 30%. To highlight the small-scale variations, each row in the image parallel to the midplane was divided by a smooth function, a 4th-order polynomial fit derived from the mean midplane radial brightness profile. The resulting image (Figure 5) emphasizes the deviations and can be compared to Figure 3 of L04. The dip at 23 AU is clear, though any features closer to the star than it are suspect. There are correlations between features in these images and those seen in the L04 data (L04 labeling convention used; distances in parentheses are the centers of the features as seen in the L04 image): (A) a “clump” at 26 AU (25 AU), (B) a dip at 29 AU (29 AU), and (C) a clump at 33 AU (31 AU). The relatively large discrepancy in the position of feature (C) between the HST and L04 data may be due to subtraction errors in either or both datasets. We note that the positions of the features appear the same in the HST images at both epochs. At 37 AU on the NW side there is a marginal enhancement that may correspond to L04’s clump D, while at the same radius in the SE side there is a slight dip. Beyond that radius the NW side smoothly declines, but there is one more extended clump at 48 AU in the SE.

The inner disk’s vertical brightness profile (Figure 6) shows a sharp midplane with extended wings. It can be reasonably well characterized for disk radii 5” by a Lorentzian profile: , where is the profile full-width-at-half-maximum (FWHM) and the height above the midplane. Note that we find this particular shape to be a convenient description of the disk profile and do not assert any physical significance to it. The profiles are generally symmetric about the midplane for but beyond this the disk is brighter on the NE side of the midplane. The outer disk profile is more rounded, lacking a sharp midplane.

The FWHM at each radius was measured by fitting a Lorentzian profile to a vertical cross-section of the image after smoothing by 5 pixels along the direction of the midplane. As shown in Figure 7, the inner disk is rather flat, but the outer disk begins to rapidly broaden beyond 5”. The FWHM for (50 AU) is ( AU). At (75 AU) the FWHM on the SE side is 09 (9 AU) and 065 (6.5 AU) on the NW. The change in FWHM along the SE side can be approximately described by two power laws: for and for . The equivalent relations for the NW side are for 15 – 30 and for 30 – 75. These apparent vertical profiles represent the projection of the optically-thin disk along the line of sight convolved with the instrumental PSF.
3.2 Disk Modelling
Derivation of the physical distribution and properties of the dust in the disk directly from an image is prohibited by the integrated effects of forward scattering and density variations seen along the line of sight. They can be estimated from three-dimensional scattering models optimized to match the observed image. We have attempted to derive a reasonable set of model parameters that match the major features of the disk in the first-epoch F606W exposure. We emphasize that we have not fully explored the parameter space, which is likely to have some degeneracies that prevent determination of a unique set of optimal values.
The modelling code computes the singly-scattered reflected light from the disk integrated along the line of sight. Because the AU Mic disk is optically thin (KLM04), nearly all of the observed light is singly-scattered, and the fraction of multiply-scattered photons should be insignificant. Assuming axial symmetry, the scattering surface density at radius and height is characterized by where is the midplane scattering density at some fiducial radius and the scale height of the vertical distribution profile varies as . An albedo of 0.5 is assumed. We used a Lorentzian vertical density distribution profile where . The code can compute a model with contiguous annular zones, each with independent , , inclination, midplane position angle, and outer radius (the outer radius of one zone defines the inner radius of the next). The midplane densities and scale heights are constrained to be equal at the interface between two zones. The inner radius of the innermost zone is also defined, allowing for a clear central region. The intensity of reflected light from each point in the three-dimensional model is modified by the Henyey-Greenstein scattering phase function. The scattering asymmetry parameter defines how forward-scattering the grains are ( = 0 is isotropic, = 1 is fully forward-scattering).
An iterative, non-linear least squares fitting routine was used to optimize the disk parameters by generating models and comparing them to the image. Both sides of the disk were simultaneously fit using the model, which is symmetric about the star within each disk zone. To avoid the brighter inner regions from completely driving the results, the weights for all of the pixels at each radius were multiplied by the inverse of the peak midplane intensity at that radius. Regions covered by the galaxy at and within 075 of AU Mic were given zero weight. The disk model was convolved with a Tiny Tim PSF model (Krist & Hook 2004)333The Tiny Tim software and manual are available from http://www.stsci.edu/software/tinytim. to account for instrumental blur. During the comparisons pixels at in both the data and model were smoothed using a pixel median filter to reduce the noise in those faint regions. The apparent disk midplane is sufficiently extended at those radii to be unaffected by this smoothing. All of these models were computed with a 250 AU outer radius and 25 AU maximum height.
The model disk was initially composed of three annular zones (1 – 3) surrounding an inner clearing. The inner radius was somewhat arbitrarily set at 3 AU, within the masked central region. The outer radii (which were free parameters) of the zones 1 – 3 were set to 14, 45, and 250 AU, respectively, corresponding to the regions defined by the power law descriptions of the radial brightness profile. The starting values of were 0.0 for the two inner zones and -4.0 for the outer. Likewise, was started at 0.0 for the two inner zones and 2.0 for the outer. and were determined by trial-and-error adjustments until a reasonable initial model was produced. Separate fits were made with starting at 0.0, 0.3, and 0.6. In these runs the zones were constrained to have the same inclination (starting at 0.0) and position angle. We refer to these simple three-zone models collectively as Model 1.
The first runs indicated that Zone 1 was essentially clear, as the values for in all of the fits were extremely large, corresponding to a very rapid density increase at the outer boundary of the zone. The values of were 0.45 – 0.65, and the inclination offsets from edge-on were 0.0∘ – 0.8∘. The values for varied chaotically for the inner two zones, and the residuals showed that the localized variations were likely causing difficulties in determining there. In the outer zone = 2.1 – 2.6. None of the resulting models reproduced the bow or the change in the vertical profile shape between the inner and outer disk, so these fits were not deemed acceptable.
A new fit was made with some modifications to the zone layout. First, Zone 1 was removed and replaced with an expanded inner clearing with an initial outer radius of 14 AU. A new zone with an initial outer radius of 85 AU was inserted between the outer two zones in order to provide more freedom to fit the transition region between the inner and outer disk. Finally, each zone was allowed to have its own inclination and position angle. We refer to this more complicated model as Model 2. As before, separate fits were run with starting at 0.0, 0.3, and 0.6 and with the same initial parameters as Model 1.
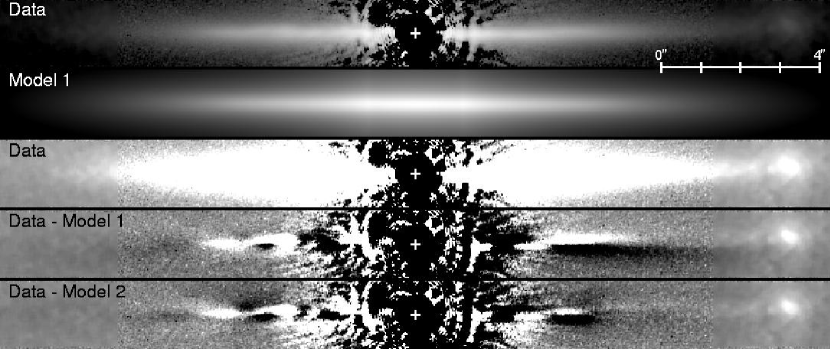
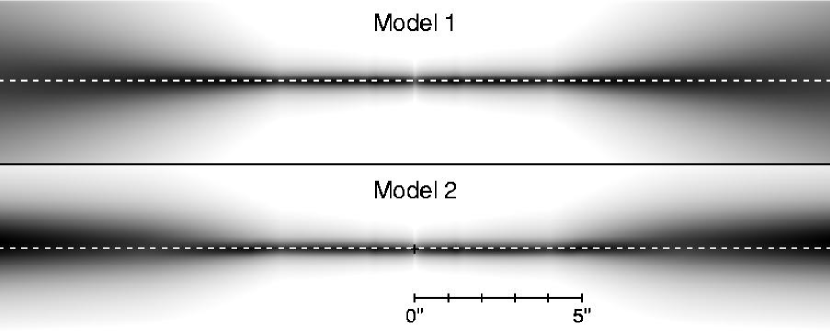
While they cannot match the small-scale variations in the disk (Figure 8), the new fits provide improved models that reproduce the bow (Figure 9), the radial brightness profile (Figure 10), and the change in the vertical profile shape with radius (Figure 11). The parameter ranges are given in Table 3. Despite starting with significantly different parameters, the separate fits returned very similar results. The inner clearing is AU in radius, which is similar to the AU predicted by fitting the spectral energy distribution (Liu et al. 2004). The inner annular zone (Zone 1) extends to AU and has both a flat radial density distribution and thickness ( and are both approximately zero). It is quite close to edge-on (), as is Zone 2 (). The density falls rapidly with radius over Zone 2 () while the disk thickness increases (). The density falls off less rapidly over the outermost zone () and the thickness increases slowly (), but the inclination is notably greater with (the SW pole is inclined toward us). The position angles of the zones are all within 0.5∘ of each other.
The model shows that forward scattering () and the inclination of the outer disk ( AU) cause the bow. We do not believe that any other processes, such as interaction with the ISM (Liu 2004) are required to explain its appearance. The disk is intrinsically quite thin, with a FWHM thickness of AU at AU, compared to a projected and PSF-convolved FWHM of AU. It broadens to AU at at AU. The model suggests that the outer disk may have the same vertical profile as the inner, but due to its higher inclination it appears to lack a sharp midplane.
| Parameter | Minimum | Maximum |
|---|---|---|
| Midplane scattering cross-section | ||
| density ( AU) (cm-2/cm-3) | ||
| FWHM thickness (AU) at AU | 1.73 | 1.74 |
| Scattering asymmetry () | 0.372 | 0.374 |
| Inner disk radius (AU) | 11.70 | 11.71 |
| Zone 1: | ||
| Outer radius (AU) | 48.6 | 49.1 |
| Offset from edge-on | 0.56∘ | 0.57∘ |
| -0.066 | -0.053 | |
| 0.074 | 0.085 | |
| Zone 2: | ||
| Outer radius (AU) | 78.9 | 82.4 |
| Offset from edge-on | -0.52∘ | -0.45∘ |
| -4.66 | -4.58 | |
| 2.45 | 2.52 | |
| Zone 3: | ||
| Outer radius (AU) | 250 | 250 |
| Offset from edge-on | -2.97∘ | -2.93∘ |
| -2.68 | -2.31 | |
| 0.01 | 0.59 |


There is likely some tradeoff between the variation in brightness with radius due to the scattering phase function and the radial density falloff as characterized by . A tighter constraint on the phase function would be possible if the disk could be seen closer to the star than is allowed with the occulting spot. The multizonal nature of the disk has been somewhat artificially decomposed into a set of separate power law descriptions that only provide constraints on the continuity of the density variation within a zone, without a rigorous physical basis for them. Given the number of free parameters, it is not possible to derive very robust values for both and in the case of a multizonal, edge-on disk. This would not be a problem if the disk could be well-resolved in thermal emission, where phase effects are not present.
3.3 The Disk in Different Filters
The disk appears generally similar over the wavelength range of the ACS images. However, the sharp, thin midplane (FWHM 200 mas) is blurred by the wavelength-dependent PSF (FWHM 50 – 72 mas), so the apparent vertical profile of an intrinsically wavelength-independent disk would appear to differ among the filters. Consequently, measurements of color gradients are complicated. To examine what sort of PSF-induced variations might be expected, copies of Model 2 were convolved with Tiny Tim model PSFs for each filter. These show that for a wavelength-independent disk and illuminating source the peak midplane intensity ratios at 30 AU are F435W/F606W = 1.05 and F435W/F814W = 1.16, indicating that the midplane becomes more blurred at longer wavelengths due to the PSF. Conversely, more light is redistributed into the wings of the profile at longer wavelengths. At 04 above the midplane, the disk model surface brightness is up to 60% greater in F814W than F435W. When the observed images are normalized by the total disk flux in each filter (measured using the apertures and aperture corrections described below), the peak midplane brightnesses are equal to those predicted within the measurement errors, indicating that there are no significant intrinsic color variations with disk height.
The overall disk color was derived by computing fluxes within regions that encompass most of the disk’s light. The PSF-convolved models show that by summing the flux within a 43 long by 09 high box aligned along the midplane and centered at = 42, the total flux in F435W would be 1.02 greater than in F606W and 1.09 greater than in F814W for a neutral disk and central source. These dimensions were chosen based on the region of significant signal in the observed F435W image. The same box applied to each side of the disk in the observed images indicates that the disk is blue relative to the star. After aperture corrections derived from the models, the F435W/F606W flux ratios relative to the star are 1.13 (NW) and 1.15 (SE) and for F435W/F814W they are 1.35 (NW) and 1.44 (SE). The estimated measurement error for this boxsize is 3%, so it appears that the disk may be slightly more blue on the SE side. The SE/NW brightness asymmetry appears to decline toward longer wavelengths. The SE/NW brightness ratios measured within the boxes are 1.11 (F435W), 1.09 (F606W), and 1.04 (F814W). As a consistency check, the flux ratios in the April and July F606W images agree to within 1%.
The radial surface brightness profiles for each filter were computed by summing over 1 35 pixel apertures at each radius centered on the midplane with aperture corrections derived from the models. The ratios of these profiles indicate that the disk becomes increasingly blue at larger radii, at least for 30 – 60 AU. On the SE side the F435W/F814W brightness ratio is 1.3 at 30 AU and 1.6 at 60 AU from the star. On the NW side the change is not as great, increasing from 1.25 to 1.45 over the same range. There is no significant color gradient seen in the F435W/F606W ratios. Within 30 AU of the star the disk appears to become more blue toward smaller radii at about the same rate. High PSF subtraction residuals in F814W may bias the results and render this trend suspect.
3.4 Differences Between Epochs
AU Mic has a high proper motion of nearly one-half arcsecond per year. The two F606W images are separated by over four months, so it is possible to distinguish background objects from anything that may be co-moving with the star. There is nothing in the images except for the disk that appears to be associated with AU Mic. Both the galaxy seen along the midplane and the star SW of the disk moved relative to the disk by an amount and direction consistent with the proper motion of AU Mic.
4 Discussion
4.1 Indications of an Unseen Perturber?
The AU clearing implied by the model fits is consistent with the AU one predicted by Liu et al. (2004) from the disk’s infrared spectral energy distribution. Given the low luminosity of the star it cannot be caused by dust sublimation or expulsion of grains by radiation pressure (KLM04). As Liu et al. suggest, tidal interaction of the dust with an unseen companion within the clear zone is a strong possibility. They report no detection of an infrared companion during a “shallow” search using adaptive optics on Keck, so deeper imaging is certainly warranted. Given the nearly exact edge-on orientation of the disk, AU Mic is also a good candidate for detecting potential planetary transits.
A low-mass perturber may also explain the asymmetries and localized variations and the inclination difference between the inner and outer disk. This latter appears equivalent to the warping seen in the Pic disk, which has been explained using hypothetical companions (Augereau et al. 2001). While the tilt of the Pic outer disk relative to the inner disk is mostly in the plane of the sky, in AU Mic’s disk it appears inclined mainly along the line of sight. Coincidentally, the tilt between Pic’s inner and outer disks is about 3∘, the same as for AU Mic’s.
4.2 The Vertical Density Distribution
The AU Mic disk is thin, with an intrinsic FWHM derived from the model fits of AU for AU increasing to AU at AU. For comparison, the Pic disk has a projected FWHM of 15 – 18 AU between 20 – 120 AU, and its intrinsic thickness at AU as derived from modelling by Kalas & Jewitt (1995) is 7 – 14 AU.
We stress again that the application of a Lorentzian profile simply provides a reasonable description of the vertical density distribution, which may be intrinsically more complex (e.g. the sum of multiple Gaussian distributions of various scale heights). It may be possible that the AU Mic disk has a sharper profile and is more inclined than the fits indicate. However, a greater inclination would result in a larger top/bottom asymmetry due to forward scattering.
4.3 Disk Color and Grain Properties
AU Mic is the only known debris disk that appears blue relative to the star. Other such disks are either largely neutral ( Pic; Paresce & Burrows 1987) or redder than the star (HR 4796, HD 141569A; Schneider et al. 1999, Clampin et al. 2003) over optical wavelengths. Those stars, however, are also A-types, with much greater luminosities. A potential explanation for the blue relative color is that the grain-size distribution has a larger proportion of small (m) particles than is found in the distributions in the other disks. These smaller grains scatter more light at 0.4 m than at 0.9 m. The radiation pressure from A stars could rapidly blow such particles out of a surrounding disk. However, an M star like AU Mic exerts 3 – 5 orders of magnitude less pressure, allowing small grains to remain (Saija et al. 2003). Perhaps solar winds may exert more outward pressure on the dust than radiation in late-type stars.
The possibility that the outer regions of the disk would be blue relative to the inner was suggested by KLM04. In the absence of gas or significant radiation pressure, Poynting-Robertson drag is the dominant force in altering the location of collision-produced grains within the disk. Small grains in the inner disk should feel the most drag and will migrate quickly into the star, leaving a relative abundance of larger grains there. At greater distances from the star, small grains would encounter less drag and have longer lifetimes, increasing their proportion relative to the larger grains and thus increasing the amount of light scattered at shorter wavelengths.
Forward scattering places some constraints on the inclination as greater tilt would cause the disk on forward side of the midplane to become significantly brighter than on the other. The scattering phase parameter value of implies that the grain population is different from those found in optically-thick disks around younger stars such as HH 30 (Burrows et al. 1996) where in the visible and the grain size distribution is probably similar to the ISM. The value of does lie within the 0.3 – 0.5 range derived for Pic by Kalas & Jewitt (1995) and is slightly more than the 0.25 – 0.35 range of HD 141569A (Clampin et al. 2003).
5 Conclusions
The disk of AU Mic has been imaged in scattered light at high resolution with HST in BVI-like passbands to within (5 AU) of the star. The surface brightness profiles of the two sides of the disk are generally similar, especially when compared to those of the Pic disk, but localized brightness asymmetries are seen, especially in the SE side. The disk at AU is brighter in the NW than the SE. The disk is blue relative to the star, perhaps indicating a relative surplus of small particles compared to grain size distributions in neutral or red disks seen around earlier-type stars. The radiation pressure from a late-type star like AU Mic may be insufficient to force these small grains out of the disk. An extended feature at AU on the NW midplane is a background galaxy.
Modelling indicates that the inner ( AU) region is seen very close to edge-on () while the outer is inclined toward us. The disk appears to be clear of material within 12 AU of the star, consistent with the infrared SED. The disk has a fairly sharp midplane with an intrinsic vertical FWHM of AU at AU which increases to AU at AU. The degree of forward scattering by the grains is comparable to that seen in other debris disks, namely Pic.
6 Acknowledgements
The ACS instrument was developed under NASA contract NAS5-32865, and this research was supported by NASA grant NAG5-7697.
References
- Augereau et al. (2001) Augereau, J. C., Nelson, R. P., Lagrange, A. M., Papaloizou, J. C. B., & Mouillet, D. 2001, A&A, 370, 447
- Barrado y Navascués et al. (1999) Barrado y Navascués, D., Stauffer, J. R., Song, I., & Caillault, J.-P. 1999, ApJ, 520, L123
- Burrows et al. (1996) Burrows, C. J., et al. 1996, ApJ, 473, 437
- Clampin et al. (2003) Clampin, M., et al. 2003, AJ, 126, 385
- Cutispoto, Messina, & Rodonò (2003) Cutispoto, G., Messina, S., & Rodonò, M. 2003, A&A, 400, 659
- Gilliland (2004) Gilliland, R. L. 2004, ACS Instrument Science Report ISR 04-01
- Kalas & Jewitt (1995) Kalas, P. & Jewitt, D. 1995, AJ, 110, 794
- Kalas, Liu, & Matthews (2004) Kalas, P., Liu, M. C., & Matthews, B. C. 2004, Science, 303, 1990
- Krist & Hook (2004) Krist, J. E. & Hook, R. 2004, Tiny Tim Users Manual v6.2 (www.stsci.edu/software/tinytim)
- Liu (2004) Liu, M. C. 2004, Science, 305, 1442
- Liu et al. (2004) Liu, M. C., Matthews, B. C., Williams, J. P., & Kalas, P. G. 2004, ApJ, in press
- Paresce & Burrows (1987) Paresce, F. & Burrows, C. 1987, ApJ, 319, L23
- Pavlovsky et al (2004) Pavlovsky, C., et al. 2004, ACS Data Handbook Version 3.0
- Perryman et al. (1997) Perryman, M. A. C., et al. 1997, A&A, 323, L49
- Saija et al. (2003) Saija, R., Iatì, M. A., Giusto, A., Borghese, F., Denti, P., Aiello, S., & Cecchi-Pestellini, C. 2003, MNRAS, 341, 1239
- Schneider et al. (1999) Schneider, G., et al. 1999, ApJ, 513, L127
- Song et al. (2002) Song, I., Weinberger, A. J., Becklin, E. E., Zuckerman, B., & Chen, C. 2002, AJ, 124, 514
- Zuckerman et al. (2001) Zuckerman, B., Song, I., Bessell, M. S., & Webb, R. A. 2001, ApJ, 562, L87