The low-luminosity galaxy population in the NGC 5044 Group
Abstract
We present multicolour imaging for a sample of 33 dwarf and intermediate-luminosity galaxies in the field of the NGC 5044 Group, complemented with mid-resolution spectroscopy for a subsample of 13 objects. With these data, a revised membership and morphological classification is made for the galaxies in the sample. We were able to confirm all but one of the “definite members” included in the spectroscopic subsample, which were originally classified based on morphological criteria; however, an important fraction of background galaxies is probably present among “likely” and “possible” members.
The presence of a nucleus could be detected in just five out of the nine galaxies originally classified as dE,N, thus confirming the intrisic difficulty of photographic-plate morphological classification for this kind of objects. Our deep surface photometry provided clear evidences for disc structure in at least three galaxies previously catalogued as dE or dS0. Their transition-type properties are also evident from the colour-magnitude diagram, where they lie near the late-type galaxies locus, suggesting an evolutionary connection between a parent disc-galaxy population and at least part of present-day dEs.
Half a dozen new dSph candidates were also found, most of them at small projected distances from NGC 5044, the central galaxy of the Group.
The NGC 5044 Group appears clearly defined in redshift space, with a mean heliocentric radial velocity, (), and a moderate dispersion, . Our kinematical data show no luminosity segregation for early-type galaxies: both dwarf and bright E/S0 systems show very similar velocity distributions (), in contrast to late-type galaxies that seem to display a broader distribution ().
keywords:
galaxies: NGC 5044 group – galaxies: dwarf – galaxies: photometry – galaxies: kinematics and dynamics1 Introduction
A systematic observational work to map the low surface brightness (LSB) galaxy distribution in selected zones of the sky has been carried out by different teams, leading to complete surveys and morphological catalogues of some loose groups of galaxies and nearby clusters (Binggeli, Sandage & Tammann, 1985; Karachentseva, Karachentsev & Börngen, 1985; Ichikawa, Wakamatsu & Okamura, 1986; Davies et al., 1988; Ferguson, 1989; Ferguson & Sandage, 1990; Jerjen & Dressler, 1997; Secker & Harris, 1997).
These catalogues serve as a basic reference to any further analysis relying on accurate photometry or spectroscopy of individual galaxies (e.g., Bothun & Mould, 1988; Brodie & Huchra, 1991; Cellone, Forte & Geisler, 1994; Held & Mould, 1994; Secker, Harris & Plummer, 1997; Cellone, 1999). However, accurate observations of LSB galaxies still remain a quite difficult task both for photometry and spectroscopy, especially for clusters and groups of galaxies beyond the Virgo and Fornax Clusters. These two nearby clusters are the environments where, by far, most detailed studies of the dwarf and low-luminosity galaxy population have been carried out till present, including recent spectroscopic and photometric surveys using wide-field detectors (e.g., Hilker et al., 1999a, b; Drinkwater et al., 2000; Kambas et al., 2000; Deady et al., 2002; Sabatini et al., 2003).
A complementary view can be gained through the study of smaller groups. These have the advantage that even a moderate-sized sample would be fairly representative of the whole group population. At the same time, depth effects would be minimized allowing a better analysis of distance-depending quantities. One of these rather loose groups appears surrounding the elliptical galaxy NGC 5044. The NGC 5044 Group was catalogued by Ferguson & Sandage (1990, hereafter FS90), who list 162 galaxies within arcmin of NGC 5044, about 80 percent of which are dwarfs ( mag).
Surface photometry for a small sample of dwarf and intermediate luminosity (mostly) elliptical galaxies in the NGC 5044 Group (of which 6 objects in common with the present work) has been presented in Cellone (1999, hereafter C99), while Khosroshahi et al. (2004) completed these results with a morphological study of a brighter sample of member galaxies, based on photometry. Cellone & Buzzoni (2001) discussed the properties of a few particular dwarfs, including a possible link between dEs and blue compact dwarfs (BCD). A systematic H i radio survey of this field has recently been carried out by McKay et al. (2004) providing new hints for the low-surface brightness galaxy population of this loose group. In this paper we further extend the Cellone & Buzzoni (2001) analysis and present multicolour surface photometry for 33 dwarf and intermediate-luminosity galaxies (plus six likely unclassified new members) in the field of the NGC 5044 Group, along with mid-resolution spectroscopy for a subsample of 13 objects.
Our main goal is to clearly discriminate between members and background objects, in order to study (in a future paper of this series) the stellar populations and structural properties of a sample with as little background contamination as possible. At the same time, an analysis of the kinematical properties of the Group can be made.
We will arrange our discussion by presenting first, in Sec. 2, the observational input. Surface photometry for each galaxy in our sample is obtained in Sec. 3, allowing us to carry out a fully consistent morphological (re)-classification for each object and assess –in some cases with the combined help of spectroscopy– its fiducial membership to the NGC 5044 Group. Nucleated and dwarf spheroidals are reviewed in some detail in this section, and we will also present fresh data for six new galaxies, possible Group members.
The main kinematical parameters for the Group are briefly summarized in Sec. 4, while the photometric and structural properties of the full galaxy sample are dealt with in Sec. 5. Here we discuss in particular the surface-brightness vs. total magnitude relationship of the NGC 5044 members and pick up some notable candidates to transition-type objects. Given their relevance in the long-standing debate about the evolutionary connection between different dwarf-galaxy types (i.e. dE – dI – BCD), these special objects will be further characterized in Sec. 6 comparing with the global properties of the NGC 5044 galaxy population. The main issues of our discussion and our conclusions will finally be summarized in Sec. 7.
2 Sample selection and observations
A sample of dwarf and intermediate-luminosity galaxies was selected from the NGC 5044 Group Catalogue of FS90, with the aim of sampling most of the Group population between mag (namely, mag)111Throughout this paper, for the NGC 5044 Group we will adopt a distance modulus , according to our estimate of the mean redshift for all the known group members (see Sec. 4). Note that no further correction (e.g. for the Virgocentric inflow) has been applied. regardless of morphology. Galaxies classified either as definite (1), likely (2), or possible (3) members were included within our sample; only a few objects imaged with a different telescope were excluded, since those data will be presented elsewhere (Cellone & Buzzoni 2004, in preparation).
The selected fields were observed with the ESO 3.6-m telescope + EFOSC2 during two runs: April 16 – 17, 1999, and April 29 – May 1, 2000. Atmospheric conditions were photometric, with sub-arcsec seeing during the first run, while in 2000 seeing was slightly poorer (FWHM arcsec).
2.1 Imaging
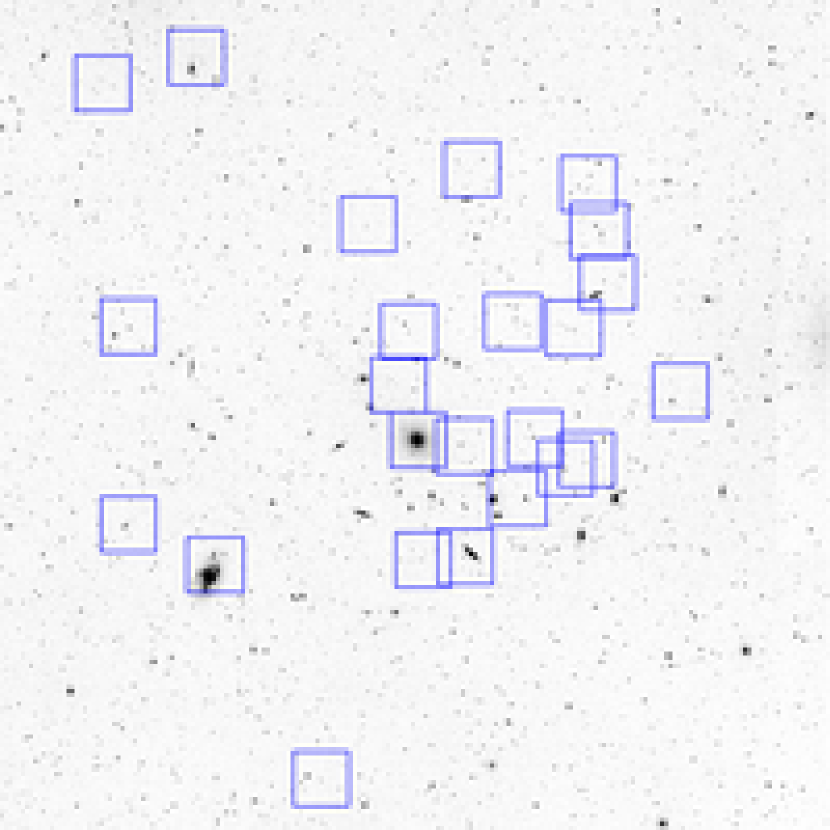
EFOSC2 was equipped with a Loral 2k CCD, which was binned giving a scale of 0.32 arcsec pixel-1. The instrument field thus covered an square area 5.3 arcmin on a side, allowing in most cases to image more than one galaxy within each frame. A total of 24 fields including 33 low-luminosity galaxies from FS90 (along with the bright SbI-II NGC 5054 and NGC 5044 itself) were imaged in the four bands of the Gunn system (Thuan & Gunn, 1976; Wade et al., 1979; Schneider, Gunn & Hoessel, 1983). Individual exposure times ranged from 240 sec to 720 sec; for the faintest objects two 480 sec exposures were obtained in each band and they were summed up after all processing steps were completed. Figure 1 shows the locations of our frames on a arcmin DSS image centred on NGC 5044.
Standard stars from the lists of Schneider et al. (1983) and Jørgensen (1994) were also observed during each run for calibration purposes.
Image processing was done using iraf222iraf is distributed by the National Optical Astronomy Observatories, which are operated by the Association of Universities for Research in Astronomy, Inc., under cooperative agreement with the National Science Foundation., complemented with a few of our own fortran routines. Each frame was bias corrected and then flat-fielded using twilight flats. The and images showed fringe patterns which had to be corrected by subtraction of the corresponding fringe image, scaled by an appropriate factor. Fringe frames were constructed by median-averaging all suited science frames in and , respectively; this procedure effectively removed stars and other compact objects, although the target galaxies had to be modelled an subtracted before the median-averaging could be done. We were able to satisfactorily correct fringe patterns in most of the and images, although rather large residuals ( of the sky level) remained in a few images.
Cosmic rays were excised using the iraf task cosmicrays. Finally, a tilted plane was fitted to the sky background and subtracted from each image.
2.2 Spectroscopy
Mid-resolution spectra were obtained for a sub-sample of 13 objects using EFOSC2 with the grism #8, in the wavelength range Å at 6 Å FWHM resolution. Exposure times ranged from 1200 sec to 4800 sec, with exposures longer than 1800 sec being split into up to four shorter integrations. We used a long ( arcmin) slit, which allowed us, when possible, to include a second target galaxy on the same spectrum frame of the main object. When no catalogued galaxy could be used as second target, we tried to include any likely background galaxy within the slit; four such objects were observed in this way. A spectrum of the Group central galaxy, NGC 5044, was also obtained.
Each 2-D spectrum was bias corrected and then flat-fielded using lamp flats. One-dimensional spectra were extracted using standard routines within iraf and wavelength-calibrated by means of He-Ne-Ar lamp spectra. Flux calibration was made with standard stars from Gutiérrez-Moreno et al. (1988), which were also observed during both runs. Finally, individual 1-D spectra of the same object were combined.
We then used the 3–8 higher S/N absorption and/or emission lines from each of our spectra to measure the corresponding radial velocities. Cross-correlation with the spectrum of NGC 5044, used as a template, provided a confirmation, and served as an initial guess for a few dubious, low S/N ratio spectra. All radial velocities given along this paper are corrected to heliocentric values.
3 Membership and morphological re-classification
As usual in photographic surveys, FS90 used a morphological criterion for membership classification when redshifts were not available. This is mostly the case for dwarf ellipticals (dEs) because their low surface brightness turns them into difficult targets for spectroscopy; however, this LSB nature is in itself a very valuable tool that allows a reliable membership classification, distinguishing them from background E (i.e., high surface brightness) galaxies. Fair dEs are thus usually classified as class 1 (definite) members, while dubious objects are assigned to classes 2 (likely members) and 3 (possible members). In the Virgo and Fornax Clusters, whenever redshift information has become available for galaxies originally assigned to class 1 on morphological bases (Binggeli et al., 1985; Ferguson, 1989), membership has been confirmed for an overwhelmingly large fraction of objects (e.g., Binggeli, Popescu & Tammann, 1993; Drinkwater et al., 2001), although a few striking counterexamples are widely known (e.g.: Malin 1, Bothun et al., 1987). On the other hand, spectroscopic surveys have also revealed a new population of compact Fornax Cluster members among objects judged as background and/or starlike on morphological bases (Hilker et al., 1999b; Phillipps et al., 2001).
Since the NGC 5044 Group is at a distance about twice that of the Virgo Cluster, it is necessary to test whether morphological membership classification still holds. Thus, our first goal was to test the FS90 membership classification for our galaxies, making a more reliable distinction between Group members and background objects. Since we have no redshift measurement for about 60% of our sample, we also had to rest on morphological criteria for these objects; however, a higher spatial resolution along with colour information allowed us to classify some dubious cases. At the same time, we were able to give a revised morphological classification for some objects.
Figure 2 shows band contour plots for each galaxy in our sample. (“True” colour images from combined , , and frames are available only in the electronic version.) For this graphical presentation, all images were sky-subtracted, median filtered and converted to the standard magnitude scale. The faintest contour corresponds to , with between adjacent contours. Scale is the same for all frames, which range from 1 to 3 arcmin on a side. Note the wide variety of sizes and morphologies; these will be discussed later.
From our spectroscopic data, we obtain for NGC 5044, in coincidence with published values (, Huchra et al., 1983; da Costa et al., 1998). For the dwarf elliptical galaxies N42 and N50333In what follows, the prefix “N” stands for catalogue number in FS90, we confirm, within the errors, the preliminary values given by C99.
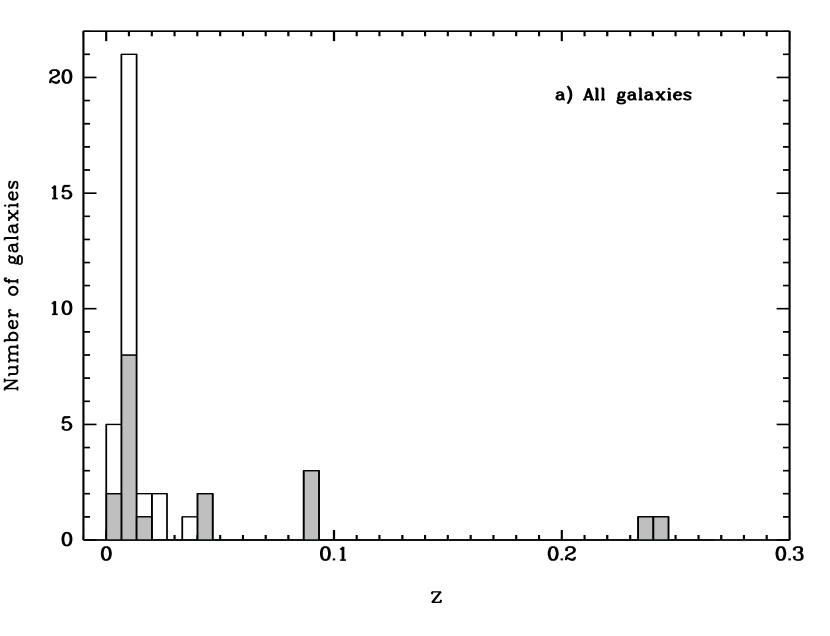
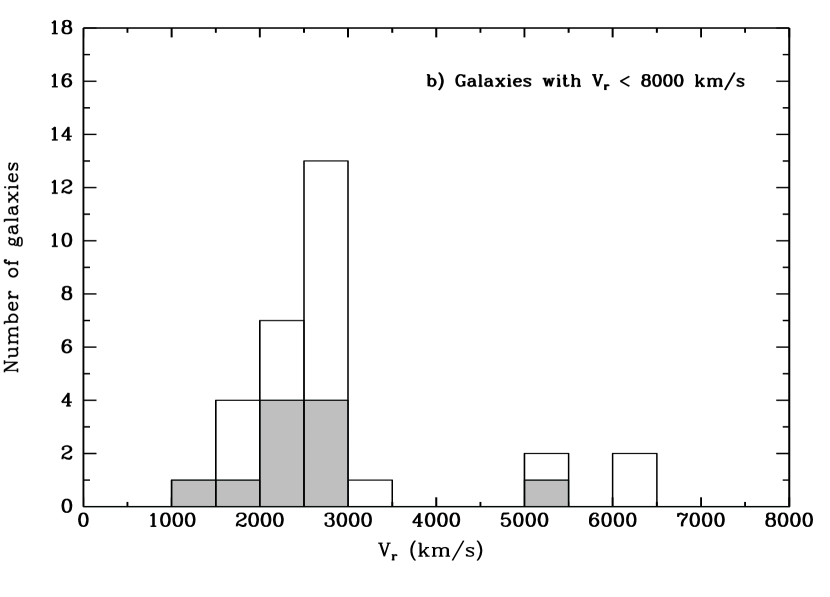
Figure 3 shows the radial velocity distribution for galaxies with spectroscopic data within arcmin from NGC 5044; filled bars correspond to new data presented in this paper,444Including the dwarf N29, from Buzzoni & Cellone (2004, in preparation) while the empty ones show data from the literature, provided by NED. Panel a) spans the whole velocity range, while b) singles out those objects with .
The NGC 5044 Group appears clearly defined in redshift space, with a mean heliocentric radial velocity () and a moderate dispersion . A gap is evident between and . Inclusion of the four galaxies with as members would raise the Group velocity dispersion to an implausibly large 1262 km s-1. Three of these objects appear concentrated in the south-east quadrant of the Group, so they might belong to a background structure. In what follows, we shall thus consider all galaxies with (i.e., ) to be background objects.
| FS90 Nr. | Morph. | Member | |
| Definite members () | |||
| 20 | dE,N | yes | |
| 30 | dE | 2411 | yes |
| 32 | S0 | 2795a | yes |
| 34 | dE | 2661 | yes |
| 42 | dE/dS0 | 2462 | yes |
| 49 | ImIII | 1499 | yes |
| 50 | dE,N pec/BCD | 2392 | yes |
| 54 | dE(Huge) | yes | |
| 56 | dSph | yes | |
| 62 | dSph | yes | |
| 68 | Sab(s) | 1887b | yes |
| 70 | dE,N/dI | yes | |
| 71 | d:E,N? | yes | |
| 75 | dE | 1831 | yes |
| 83 | dE | yes | |
| 84c | E | 2710 | yes |
| 89 | dE,N | yes | |
| 109 | Sdm | 5409 | no |
| 134 | Sm(interacting) | yes | |
| 137d | Sb(s)I-II(int.) | 1743b | yes |
| 153 | d:S0 | 2816 | yes |
| 155 | Sab | 2922 | yes |
| 156 | dE/dI | yes | |
| Likely members () | |||
| 17 | S0pec | 2682 | yes |
| 24 | Sm | no? | |
| 55 | dE/dI | yes | |
| 90 | Sc | no | |
| 138 | dE,N | yes | |
| 152 | Sd | 13580 | no |
| Possible members () | |||
| 31 | Im | yes | |
| 33 | SB?c | 13480 | no |
| 39 | E or cD | 27390 | no |
| 93 | bSp or Sm? | yes? | |
| 101 | interacting | no | |
| 139 | E | no? | |
| : from Fairall et al. (1992) | |||
| : from Huchra et al. (1983) | |||
| : NGC 5044 | |||
| : NGC 5054 | |||
Table 1 shows the results of our re-classification. Column 1 is the galaxy number in FS90, and column 2 gives our morphological re-classification. Whenever this last differed from the original one, a slanted typography was used. Column 3 gives the heliocentric radial velocity (when available); finally, column 4 gives our membership classification (question marks were used for a few dubious cases). Radial velocity uncertainties for our data in Table 1 typically spanned the range , except for N109 ().
Among “definite members” () with new redshift data (10 objects), only N109 () lies in the near background. Classified as ImV or dE,N?, this object is in fact a late-type spiral galaxy (see Fig. 2). The remaining 9 galaxies are LSB dwarfs; their confirmation as Group members gives further support to the accuracy of morphological membership assignment for this kind of objects.
Aside from N109, no other “definite” member was re-classified as background on morphological bases. Most of these objects are dEs which can be safely considered as members. The Sm galaxy N134, in turn, is interacting with NGC 5054, and hence it must belong to the Group.
Regarding “likely” () and “possible” members (), we present radial velocities for two objects within each class. Only N17 () was confirmed as a Group member, although with a different morphological classification. The other three objects turned out to be in the background: N33 and N152 are late-type spirals, while N39 is a luminous elliptical (). Judging from the “cuspy” shape of its surface brightness profile (see Sec. 5.1) N39 is probably the brightest galaxy in a background cluster (e.g., Graham et al., 1996), to which the object B1 (see Table 2) also belongs (note that object B3 is at the same redshift, however it is at projected distance from N39). Its failure as a Group member is a new confirmation of the extreme rarity of M32-type compact ellipticals (Ziegler & Bender, 1998; Drinkwater et al., 2001).
Based on morphological criteria, we also reject N90, which we classify as Sc instead of dE,N (see Fig. 2; faint but well defined blue spiral arms with a few H ii regions are discernible on the colour picture). The interacting pair N101 is also probably in the background, while no definite assertion can be made about the late-type spiral N24, the high surface brightness compact object N93, and the E or M32-type N139. We only retain N31 and N55 as Group members; the first one because of its resolution into star forming regions, and the second one because of its dwarf spheroidal (dSph) morphology.
As expected, all four objects included in our spectroscopy as “bonus” targets on the slit were confirmed as background galaxies (see Table 2 and Fig. 3; typical redshift uncertainties are ).
3.1 Nucleated dwarfs
We observed 9 galaxies classified as dE,N (i.e., nucleated dwarf elliptical) in FS90. Despite the good seeing conditions during our observing runs, we could not detect any nucleus in N30 and N34 (see also C99, ); in neither case there is any luminosity enhancement in the inner regions of their surface brightness profiles (see sect. 5.1). In turn, N42 and N75 show a “cuspy” profile or bulge-type inner component, but no distinct compact central component to be regarded as a nucleus.
Hence, four out of the nine dwarfs originally classified as nucleated within our (small) sample have in fact no nucleus. Qualitatively similar results for small samples of Fornax Cluster dwarfs have been obtained previously (Cellone et al., 1994; Deady et al., 2002). In fact, Cellone et al. (1994) noted that the two largest photographic surveys in the Fornax Cluster (namely, Davies et al., 1988 and Ferguson, 1989) disagree with each other in over 50% of the cases in classifying dwarf ellipticals as nucleated or non-nucleated. A high degree of coincidence is achieved, instead, between different CCD studies (e.g., Caldwell, 1983; Cellone et al., 1994).
We judge this problem is a limitation inherent to photographic classification, and should be taken in mind when analysing the properties of nucleated vs. non-nucleated dwarfs, since differences between both subclasses have been reported regarding their structure, spatial distributions, and stellar populations (e.g., Ferguson & Sandage, 1989; Ryden & Terndrup, 1994; Rakos & Schombert, 2004). A clearer identification of nucleated dwarfs should also help to better understand their possible connection with intra-cluster globular clusters and ultra-compact dwarfs (Bassino et al., 2003; Mieske, Hilker & Infante, 2004).
3.2 Candidate dSph galaxies
Six new very LSB galaxies () were detected by visual inspection on our frames. Their morphologies suggest that they are previously non-catalogued NGC 5044 Group members; we named them by appending a capital letter to the name of the nearest Group member. Table 3 lists their equatorial coordinates along with our classification. Contour plots for these new galaxies are shown in Fig. 4, along with two similar objects (namely, N49A and N83A) first reported in C99 and re-imaged here.
Although we did not set any a priori detection criteria, a subsequent analysis shows that we were able to detect objects with isophotal band radii (at ) larger than arcsec. All eight galaxies are very LSB, with central surface brightnesses fainter than . N93A is a somewhat extended object (isophotal radius arcsec) with a lumpy appearance and a very shallow surface brightness profile, while N93C looks more like a faint nucleated dE.
| Name | |||
|---|---|---|---|
| B1 | 0.097 | ||
| B2 | 0.282 | ||
| B3 | 0.096 | ||
| B4 | 0.277 |
| Name | Morph. | ||
|---|---|---|---|
| N54A | dSph | ||
| N64A | dSph | ||
| N70A | dSph | ||
| N93A | dSph/dI | ||
| N93B | dSph | ||
| N93C | dE,N |
Except for N70A ( arcmin), the new dSphs, along with the faintest catalogued dEs (N55, N56, and N62), lie within a projected distance arcmin ( kpc) from NGC 5044. Furthermore, N55 and N64A are very close (a few arcmin) to the bright SBa NGC 5035; in fact, N64A was not evident until the halo of NGC 5035, as well as the wings of a saturated foreground star, were subtracted. Although the number of objects is low for statistically significant conclusions, their apparently clustered distribution would be similar to that of Local Group dSphs, which tend to be found near the Milky Way and M31. This contrasts with Kambas et al. (2000), who found a very LSB galaxy distribution in the Fornax Cluster less concentrated than the bright galaxies (but, again, see Hilker, Mieske & Infante, 2003, for an opposite conclusion on the same cluster, in line with our results).
4 Group kinematics
Table 4 shows mean heliocentric radial velocities and dispersions for the galaxies in three different morphological classes: bright early-type galaxies (E–S0), early type dwarfs (dE–dS0), and late-type objects (Sa–Im), as well as for all Group members. For ellipticals an S0s, the boundary between giants and dwarfs was set at mag (), while the Sa–Im set encompasses both bright and dwarf objects.
Late-type galaxies seem to have a sensibly broader distribution than both dwarf and bright early-type galaxies. The intrinsically small number of members of the NGC 5044 Group prevents, in our case, to achieve any firm quantitative conclusion in this regard; however, an test on the velocity dispersion data of Table 4 confirms that late- and early-type galaxies are differently concentrated at a moderately high 93% confidence level.
Focusing on the early-type galaxies, and judging from their respective means and dispersions, it is evident that the velocity distributions of dwarf and bright objects are indistinguishable. At least for the magnitude ranges spanned by both sets, there is no hint for the luminosity segregation that shows up in the kinematic data of early-type galaxies in Virgo, which has been attributed to the merging of two sub-clumps within the Virgo core (Binggeli et al., 1993). It has also been shown that dwarf irregulars have a broader velocity distribution than bright late-type galaxies in two nearby groups (Côté et al., 1997); however, our late-type subsample is too small for further subdivision, so we cannot test this result.
Weighting the data by luminosity does not change things much, except for the fact that NGC 5044 and NGC 5054, both being mag brighter than the next brightest galaxy, tend to bias the weighted means toward higher and lower velocities, respectively. Note that the velocity of NGC 5044 is nearly larger than the Group and bright-E means; this agrees with David et al. (1994) who find evidences from X-ray data that NGC 5044 has a residual velocity with respect to the centre of the Group potential.
Our results are thus in qualitative agreement with the well known kinematical morphology segregation in clusters (e.g., Biviano et al., 2002, and references therein). Statistical studies have also found kinematical morphology segregation in groups; although there is some discrepancy regarding its significance, this seems to be mostly so for poor groups with velocity dispersions substantially lower than the NGC 5044 Group (Girardi et al., 2003; Lares, García Lambas & Sánchez, 2004). On the other hand, luminosity segregation is found for galaxies mag brighter than our mag giant – dwarf boundary. The lack of luminosity segregation in our early-galaxies data appears to support the Lares et al. (2004) finding that morphology (or colour index) is the primary parameter in defining dynamical properties of galaxies in groups, while luminosity segregation is mostly due to the luminosity – morphology correlation.
5 Photometric and structural properties
5.1 Surface brightness profiles
For each galaxy we obtained the surface brightness profile (SBP) using the iraf task ellipse. Compact foreground or background objects which could disturb the isophote-fitting algorithm were previously masked out. When necessary, the haloes of large neighbour galaxies (e.g., NGC 5035) were modelled and subtracted; the same was done with the outer wings of the PSFs of bright, saturated stars. Several non-saturated bright stars were also subtracted using daophot.
SBPs were obtained from the band images, using a three-step procedure. An inner region (semi-major axis ) was defined as that where the error bars of the centre coordinates remained below 0.25 pixels (0.08 arcsec); within this region, all the ellipse parameters were allowed to vary freely. A second limiting semi-major axis () was set at the point where the isophote intensity dropped below a value twice its own rms; this point typically corresponds to a surface brightness . For this middle region () the centre was fixed and the fitting algorithm continued with variable ellipticity and position angle. From outwards, all ellipse parameters remained fixed. This procedure prevented against “isophote wandering” and erratic changes in ellipticity and position angle at low surface brightness levels. However, for a few faint and/or compact galaxies, the middle region practically vanished, while for the faintest dwarfs (see Sect. 3.2) no ellipse fitting was possible at all, so we had to force fixed elliptical or circular apertures. For each object, the band elliptical parameters were used to obtain the profiles in the remaining bands (, , ).
Final steps involved: a fine-tuning of the sky level (typically a few adu) by checking the flatness of the growth curve far from the galaxy centre, conversion of semi-major axis () to equivalent radius555We use for the equivalent radius to avoid confusion with the passband. in arcsec, and transformation of instrumental intensities to surface brightness () in standard magnitudes per square arcsec.
| no weights | weighted | ||||
| Type | Nr. | ||||
| km s-1 | km s-1 | ||||
| E–S0 | 9 | 287 | 262 | ||
| dE–dS0 | 9 | 294 | 292 | ||
| Sa–Im | 8 | 681 | 693 | ||
| All | 26 | 431 | 501 | ||
5.1.1 Model independent parameters
Most of our band SBPs can be traced out to a surface brightness , although photometric errors get too large for intensities below one half the isophote rms, or about . We thus chose the isophote to measure isophotal radii (), magnitudes (), and mean surface brightnesses (). The band was then used to measure magnitudes and surface brightnesses in the remaining bands (, , ), so that all these parameters refer to the same physical radius.
The model independent effective radius () was obtained from each growth curve as the radius encompassing half the luminosity within the isophote. It is clear that this is an underestimation of the actual half-light radius; however, we shall show that our isophotal magnitudes are fairly good approximations to the total brightnesses that one would obtain by integrating the observed profile to infinite radius. Consequently, the model independent effective surface brightness () was obtained as the surface brightness at the isophote, and the mean effective surface brightness as .
5.1.2 SBP fitting
We fitted the band SBPs with a Sérsic (1968) law: , where is the central surface brightness, is the pseudo scale-length, and is the Sérsic index which governs the SBP shape. Note that we use as the exponent in the Sérsic law, as usual for dwarf galaxies, instead of .
It is known that fitting performances are strongly sensitive to the appropriate match of the SBP. Seeing plays an important role for small , while noise and sky uncertainties affect on the contrary at large distances (Durrell, 1997; Cellone, 1999; Kelson et al., 2000). All fits were therefore carried out over a region comprised between an inner radius about twice the seeing FWHM (namely, arcsec), and an outer radius assuring a sky-corrected intensity at least equal to its rms (this corresponds roughly to ).
The flexibility of Sérsic’s law allowed us to obtain satisfactory fits for most of our dwarfs, despite their very different shapes. This is true even for the few dwarfs in our sample with evidences for current star formation (N24, N31, N49).
A new set of photometric parameters, but now model dependent ones (, , , etc.), were then calculated from the Sérsic fits; when necessary, we identify them with a superscript “S” to distinguish them from their model-independent counterparts. Total magnitudes were eventually estimated by integrating the Sérsic profile: . Table 5 lists the relevant photometric parameters for galaxies in our sample.
| Name | |||||||||
|---|---|---|---|---|---|---|---|---|---|
| arcsec | mag | arcsec | mag | ||||||
| 17 | 33.1 | 9.6 | 15.55 | 24.40 | 22.47 | 21.11 | 4.35 | 0.84 | 15.52 |
| 20 | 12.4 | 4.9 | 18.70 | 25.42 | 24.17 | 23.59 | 4.68 | 1.12 | 18.44 |
| 24 | 16.7 | 5.0 | 16.91 | 24.26 | 22.42 | 21.58 | 3.92 | 1.19 | 16.91 |
| 30 | 35.4 | 10.9 | 15.51 | 24.50 | 22.68 | 20.87 | 4.17 | 0.80 | 15.24 |
| 31 | 29.3 | 8.4 | 16.33 | 24.91 | 22.95 | 20.93 | 1.71 | 0.61 | 16.22 |
| 32 | 58.0 | 7.5 | 12.83 | 22.89 | 19.19 | 16.95 | 0.97 | 0.55 | 12.93 |
| 33 | 13.4 | 4.0 | 17.57 | 24.44 | 22.59 | 21.92 | 3.47 | 1.21 | 17.54 |
| 34 | 25.9 | 6.1 | 16.28 | 24.59 | 22.20 | 18.87 | 0.28 | 0.44 | 16.04 |
| 39 | 21.8 | 3.8 | 16.49 | 24.42 | 21.38 | 13.66 | 0.00028 | 0.22 | 16.23 |
| 42 | 44.0 | 13.7 | 15.25 | 24.72 | 22.93 | 22.97 | 14.60 | 1.18 | 15.43 |
| 49 | 25.3 | 8.2 | 15.75 | 24.01 | 22.33 | 21.58 | 6.96 | 1.30 | 15.78 |
| 49A | 5.9 | 3.1 | 20.94 | 26.02 | 25.37 | … | … | … | … |
| 50 | 26.0 | 7.1 | 15.21 | 23.52 | 21.47 | 20.40 | 4.52 | 1.04 | 15.19 |
| 54 | 42.6 | 18.1 | 15.95 | 25.34 | 24.24 | 22.95 | 11.10 | 1.01 | 15.75 |
| 54A | 5.5 | 3.2 | 21.31 | 26.27 | 25.86 | 25.64 | 4.82 | 1.76 | 20.92 |
| 55 | 9.4 | 4.4 | 19.64 | 25.74 | 24.83 | 22.76 | 0.98 | 0.61 | 19.18 |
| 56 | 13.1 | 6.0 | 18.94 | 25.77 | 24.82 | 24.35 | 6.88 | 1.48 | 18.72 |
| 62 | 9.5 | 5.0 | 19.80 | 25.93 | 25.29 | 24.79 | 6.43 | 1.26 | 19.13 |
| 64A | 9.9 | 4.8 | 19.48 | 25.69 | 24.87 | 24.62 | 6.10 | 1.92 | 19.43 |
| 68 | 82.3 | 16.3 | 12.29 | 23.11 | 20.34 | 17.64 | 2.11 | 0.58 | 12.23 |
| 70 | 22.5 | 9.6 | 17.25 | 25.26 | 24.17 | 23.37 | 7.92 | 1.15 | 17.12 |
| 70A | 7.7 | 4.3 | 20.50 | 26.17 | 25.67 | 25.43 | 6.23 | 1.83 | 20.17 |
| 71 | 28.0 | 6.8 | 16.43 | 24.90 | 22.60 | 18.78 | 0.17 | 0.40 | 16.25 |
| 75 | 29.4 | 6.7 | 15.40 | 23.98 | 21.53 | 22.21 | 9.85 | 1.42 | 15.76 |
| 83 | 28.9 | 11.0 | 16.70 | 25.25 | 23.90 | 22.75 | 6.38 | 0.92 | 16.55 |
| 83A | 9.7 | 5.2 | 20.07 | 26.24 | 25.63 | 24.86 | 4.81 | 1.07 | 19.59 |
| 89 | 20.5 | 6.4 | 17.47 | 25.28 | 23.49 | 21.92 | 2.32 | 0.71 | 17.15 |
| 90 | 8.2 | 3.2 | 18.97 | 24.79 | 23.49 | 22.67 | 2.27 | 1.00 | 18.88 |
| 93 | 12.2 | 3.9 | 17.58 | 24.25 | 22.53 | 21.53 | 2.68 | 1.09 | 17.55 |
| 93A | 14.5 | 8.0 | 18.91 | 25.97 | 25.42 | 25.14 | 10.60 | 2.16 | 18.81 |
| 93B | 4.6 | 2.5 | 21.59 | 26.15 | 25.54 | 25.01 | 2.93 | 1.84 | 21.39 |
| 93C | 8.6 | 4.0 | 19.81 | 25.73 | 24.81 | 24.40 | 4.36 | 1.50 | 19.77 |
| 109 | 16.1 | 6.5 | 17.66 | 24.95 | 23.72 | 22.57 | 4.09 | 0.96 | 17.44 |
| 134 | 36.6 | 5.9 | 15.23 | 24.28 | 21.09 | 19.22 | 1.43 | 0.64 | 15.12 |
| 138 | 15.4 | 5.2 | 18.15 | 25.33 | 23.72 | 22.39 | 2.49 | 0.82 | 17.93 |
| 139 | 15.5 | 3.2 | 17.22 | 24.41 | 21.75 | 19.13 | 0.36 | 0.54 | 17.16 |
| 152 | 18.2 | 6.1 | 16.72 | 24.26 | 22.64 | 22.14 | 6.46 | 1.62 | 16.72 |
| 153 | 46.9 | 11.1 | 14.80 | 24.40 | 22.02 | 19.40 | 1.20 | 0.53 | 14.71 |
| 155 | 23.4 | 6.2 | 16.19 | 24.28 | 22.17 | 20.52 | 2.28 | 0.79 | 16.13 |
| 156 | 31.8 | 13.5 | 16.97 | 25.73 | 24.61 | 23.52 | 9.15 | 1.05 | 16.81 |
| B3 | 10.4 | 2.1 | 17.65 | 23.98 | 21.20 | 19.29 | 0.46 | 0.63 | 17.56 |
5.1.3 Comparison of model-dependent vs. model-independent parameters
A check for the accuracy of the model fitting results can be made by comparing model-independent (MI) with model-dependent (MD) parameters. In general, there is a very good agreement between our MI and MD parameters, except for a few particular objects which we discuss below. Isophotal radii are slightly underestimated by the Sérsic fits ( arcsec, rms arcsec), while the opposite is true for effective radii ( arcsec, rms arcsec). Isophotal magnitudes and surface brightnesses show very good agreement between their MI and MD versions, with rms dispersions of 0.11 mag and 0.13 , respectively. Slightly larger differences are obtained for mean effective surface brightnesses (, rms).
The previous results show that, in general, our fits represent a good match to the observed SBPs, and that the isophote is appropriate for measuring global photometric parameters. However, systematic differences are present between MI and MD parameters; they become particularly evident when comparing isophotal () vs. integrated () magnitudes. While the agreement is good for the brightest galaxies, fainter objects, which have larger fractions of their luminosities below , tend to have . This effect can be quantified by the outer fraction of galaxy light beyond the isophotal radius, which can be defined following Trujillo, Graham & Caon (2001):
| (1) |
where and are the luminosities integrated from the Sérsic law, up to infinity and up to the isophote, respectively, while and are the Gamma and Incomplete-Gamma functions, respectively. Note that , where depends only on .
In Figure 5 we plot ) against for our galaxies (i.e., using MI values for the isophotal parameters), with filled symbols for definite members, hollow symbols for background objects, and half-filled symbols for dubious cases, and coding for different morphological types as indicated in the caption (see Table 1). Also shown are curves obtained from equation (1) for different values of spanning the observed range. There is a clear agreement between the observations and the expected values; in particular, the faintest, very LSB objects, have and hence a large . Isophotal magnitudes thus underestimate the total luminosities of the faintest galaxies by up to mag. This should be taken in mind in subsequent analyses.
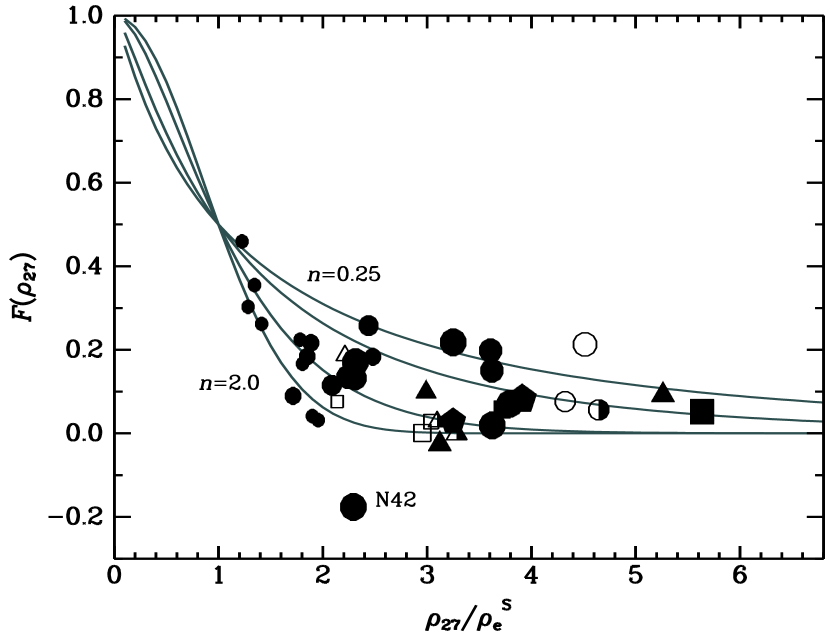
In addition, a few bright members show significant differences in their MD and MI parameters. This is the case, for instance, of galaxy N42, a clear outlier in Fig. 5, with . This dS0 galaxy consists in fact of a bulge and disc components and cannot be easily fitted by a single Sérsic law. In this case, our integrated magnitude only refers to the disc component. We will return on this object in Sec. 6.
5.2 The surface brightness – magnitude relation
Figure 6 shows the mean effective surface brightness () vs. integrated magnitude () diagram for our photometric sample, with similar symbol coding as in Fig. 5. Photometry has been corrected for Galactic reddening according to Burstein & Heiles (1982).666We adopted for the region around NGC 5044, which translates into a similar color excess, recalling that and (after Scheffler, 1982). For our galaxies, therefore, extinction in the band amounts to mag, in average. The well known magnitude – surface brightness relation is evident, with no clear segregation between early- and late-type galaxies, at least within the narrow magnitude range where there is overlap.
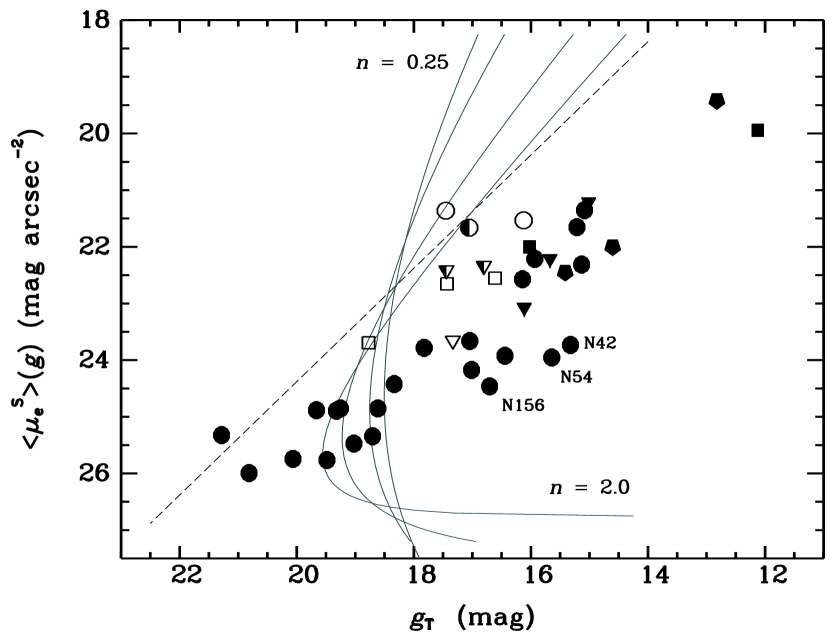
Confirmed and probable background galaxies occupy a differentiated region in the diagram, with a higher surface brightness for a given integrated magnitude. This corresponds to a more “spiky” apparent morphology and a lower effective radius; the arcsec locus (dashes) is shown as a guideline. However, the distinction between members and non-members is not clear-cut; any constant radius line, within a relatively broad range, will leave some members and non-members on each side. This is particularly true for N109 which, being in the near background (), lies intermingled with definite members in the diagram. Hence, only a coarse (statistical) membership classification can be made through the surface brightness – magnitude relation (e.g., Karick, Drinkwater & Gregg, 2003).
A few galaxies scatter below the main trend. Most of these (N54, N70, N83, N156) are dEs with very shallow SBPs; they have and central surface brightnesses fainter than 23 in . Galaxy N54 was originally classified as “dE(Huge)”, following the designation given by Sandage & Binggeli (1984) to large-size, LSB dwarfs found in Virgo. The other galaxies might be less extreme examples of these relatively bright but very LSB dwarfs. In turn, N156 shows an additional very interesting feature: a warped disc taking the form of a pair of LSB outer spiral arms or tidal tails.777The feature is only marginally evident from the contour map of Fig. 2 but it clearly stands out from the inspection of the original frames at the telescope. Again, N42 lies off the main relation due to its poor Sérsic fit (see also Cellone & Buzzoni, 2001). We shall be back in more detail to these three notable galaxies (i.e. N54, N156 and N42) in Sec. 6.
Also shown in Fig. 6 as solid lines are the curves of constant radius ( arcsec) at the limiting isophote () in the original catalogue of FS90, for different values of the shape parameter . The points to the left of the curve correspond to six dSph candidates discovered in the present work or in C99888The seventh dSph, N93A lies just rightwards the curve, while the SBP of N49A has too low S/N ratio for any reliable fit to be made., plus the very faint N55. Note that selection effects discriminate against faint objects with low (i.e., “concave”) SBPs, an effect that might be relevant when studying the correlations of with luminosity or size (see also Cellone et al., 1994). The existence of faint, dwarfs has been confirmed from Local Group data, where selection effects of a different nature take place (Jerjen, Binggeli & Freeman, 2000).
Qualitatively similar graphs are obtained by plotting any combination of surface brightness vs. magnitude, irrespective of whether they be isophotal or effective, MI or MD. However, the version used here provides the clearest member–background discrimination, and allows constant limiting radii curves to be drawn.
6 Dwarfs with a transition-type morphology
Since long, observational data have provided ambiguous evidence on the structure of dwarf elliptical galaxies, whether spheroidal or disky. For example, while their structureless isophotes made dEs gain their “elliptical” designation, their approximately exponential SBPs seemed to link them to disc systems. Their apparent flattening distribution, in turn, put dEs in an intermediate situation between normal E and disc galaxies (e.g. Ferguson & Binggeli, 1994, and references therein).
Recently, kinematical evidence has been presented showing that at least some dEs in Virgo and the NGC 5044 Group are rotationally flattened spheroids (De Rijcke et al., 2001; Pedraz et al., 2002). The non-detection of rotation in a sample of fainter dEs, led Geha, Guhathakurta & van der Marel (2002) to suggest an association between the presence of rotation and dE luminosity. Photometric observations have also revealed “hidden” discs and/or spiral–bar features in a few dEs in Virgo (Jerjen, Kalnajs & Binggeli, 2000; Barazza, Binggeli & Jerjen, 2002) and Fornax (De Rijcke et al., 2003). These results seem to support models in which present-day dEs in clusters are the remnants of “harassed” disc galaxies (Moore, Lake & Katz, 1998).
On the other hand, the evolutionary connection between different dwarf types (dE – dI – BCD) has been a subject for debate since long (e.g., Sandage & Binggeli, 1984; Patterson & Thuan, 1996), hence there is sustained interest in possible “transition” objects, since they may hold important keys for dwarf evolution (e.g., Vigroux et al., 1984; Sandage & Hoffman, 1991; Cellone & Buzzoni, 2001; Skillman et al., 2003). At least three galaxies in our sample, classified as dE or dS0 in FS90, show photometric evidence for disc structure. We describe them in the following subsections.
6.1 Warped discs in N153 and N156
N156 was originally classified as dE by FS90. As discussed in Sec. 5.2, however, the faintest () isophotes in our images show an “integral sign” shape for galaxy morphology, with a warp or tidal tail emerging at each extreme of the major axis. The Fourier coefficient from the isophote-fitting routine for this galaxy is slightly negative for arcsec, indicating a mild boxiness for isophotes fainter than .
The low-luminosity spiral N155, a spectroscopically confirmed group member, lies at a short projected distance (1.5 arcmin kpc) from the centre of N156. It is thus tempting to invoke an interaction between both objects as the origin for the warped shape of N156. The facts that the later’s “arm” or tidal tail facing N155 points in the right direction, and that there is a hint for a counter tail at very LSB levels in N155 itself, seem to support the interaction hypothesis. Note that N155’s mean effective surface brightness is brighter than that of N156, implying a higher surface mass density for the former (if similar mass to light ratios are assumed). Unfortunately, the spectrum we obtained for N156 has an insufficient S/N ratio to derive its radial velocity; hence, its kinematics with respect to N155 cannot be stated.
Sharing a similar warped appearance, N153 is however a rather different case. It was originally classified as dS0, because its disky shape is clearly seen upon visual inspection. In addition, we were able to detect a warped distortion of the outermost isophotes (see Fig. 2). These features are quantified by the coefficient, which is mildly positive (i.e., disky) within the range arcsec and definitely negative for arcsec, where the warping gives a boxy shape to the faintest isophotes. This trend is accompanied by a change in ellipticity, which goes from to over the same range in radius.
N153 is fairly isolated; it has no catalogued companion (irrespective of membership class) closer than 8.3 arcmin on the sky. One of its nearest neighbours is, remarkably, the bright spiral NGC 5054, which lies at kpc projected distance. However, both objects differ by more than in radial velocity, hence an interaction is not likely.
Note that the evidences for disc structure that we found in N153 and N156 are directly observable from their images without any further processing. It is thus not unreasonable to think that more embedded disc and/or spiral features may be unveiled after appropriate image processing (e.g., Barazza et al., 2002; De Rijcke et al., 2003). A search for these kind of structures is now in progress for a larger sample of early-type dwarfs in the NGC 5044 Group (Cellone & Buzzoni 2004, in preparation).
6.2 N42: a bulge plus disc system
The relevant case of N42 and its anomalous location in Fig. 5 and 6, has been extensively discussed in previous papers (C99), and especially in Cellone & Buzzoni (2001), where we showed that, although a low- fit produces a nominally better match to the galaxy integrated magnitude, its physical sense is questionable. Our new data for N42 confirm that, trying a single Sérsic law, the resulting fit depends highly on the fitting range in . With the full useful SBP we obtain , while avoiding the bulge ( arcsec) a convex shape parameter is obtained (). However, while the lower value gives a closer match to the total luminosity of the galaxy (because it tries to include the bulge), both fits largely overestimate the effective radius of the galaxy as compared to its MI value. In addition, both high- and low- fits make N42 drop below the main surface brightness – magnitude relation (see Sec. 5.2).
In fact, any model leaves, after subtraction from the original image, both positive and negative (i.e., unphysical) significant residuals. On the other hand, models give good fits to the outer region of the galaxy (the disc), leaving, after subtraction, a bulge-type component about 20% the total luminosity of the galaxy. We thus sustain a disc + bulge structure for N42, with the disc being the more luminous component. We give further support to this conclusion in the following subsection.
6.3 The colour – magnitude diagram
Although a thorough study of the evolutionary properties of the galaxies in the present sample will be presented in a forthcoming paper (Buzzoni & Cellone 2004, in preparation), it is interesting to see now whether the disc-like structural characteristics of the galaxies discussed in this section show any signature in their stellar populations.
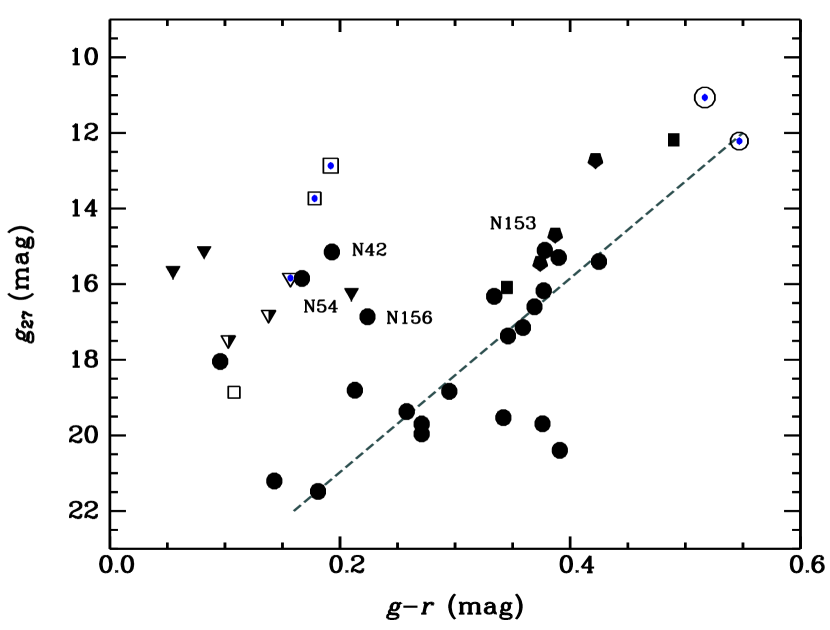
We thus show in Fig. 7 the colour – magnitude diagram for all our sample, with the same symbol coding as in Fig. 5 and 6, except that dotted open symbols correspond to distance-corrected magnitudes for background objects.999Note that, for the illustrative scope of Fig. 7, correction has only been taken into account for background galaxies, according to Buzzoni (1995). At the distance of the NGC 5044 Group, mag, that is correction is dominated by the geometrical term and is therefore negligible in our photometric bands. The well known trend of redder colours (i.e., higher metallicities) for brighter systems (e.g., Caldwell, 1983; Cellone et al., 1994; Secker et al., 1997; Hilker et al., 1999a) is clearly seen for the early-type galaxies. Note that, after correcting to the NGC 5044 Group distance, the two confirmed background ellipticals N39 and B3 lie not far from the extrapolation of the colour – magnitude relation for dwarfs.
Late-type objects, in turn, form a disjoint sequence with a bluer mean colour, showing no clear trend with luminosity. Note that the faintest dwarfs span a broad range in colour, which is probably due in part to large photometric errors, but may be also due to a spread in mean ages and/or metallicities. This last point is consistent with the known difficulty to distinguish between elliptical an irregular dwarfs at the faintest luminosity levels (Ferguson & Binggeli, 1994).
Notably, both N42 and N156 lie on the late-type branch, as should be expected from their disc-dominated structure. The same is true for N54, a “huge” dE already mentioned because of its departure form the main trend in the surface brightness – magnitude relation (sect. 5.2). Except for the outer warped isophotes in N156, this dwarf and N54 have very similar structural properties: both are very LSB, systems, lying well within known ranges in size, luminosity and surface brightness of dwarf irregulars (e.g., Patterson & Thuan, 1996). However, there is no hint for zones of current/recent star formation in these two galaxies (neither in N42); instead, they have a very smooth appearance, which surely led to their original dE classification. Hence, we prefer an intermediate early/late type classification for them. Neutral hydrogen 21 cm observations would be highly desirable for these objects.
On the other hand, both N70 and N83, which are structurally similar to N54 and N156 (see sect. 5.2), lie on the colour – magnitude relation for early-type galaxies. Their respective locations in a two-colour diagram will give some clues on their evolutionary status (Buzzoni & Cellone 2004, in preparation)
Finally, N153 also lies on the early-type branch of the colour – magnitude relation, despite of its disky structure above discussed. However, its low shape parameter () shows that, despite its detectable disc, N153 is indeed a bulge-dominated system, with its integrated red colour being the consequence of a relatively high metallicity.
7 Summary and Conclusions
In this paper we presented systematic multicolor photometry for an extended sample of 33 dwarf and intermediate-luminosity galaxies in the group of NGC 5044 (including observations for the E galaxy NGC 5044 itself, and the other luminous Sb member NGC 5054). For 13 of these objects, also mid-resolution spectroscopy was collected (this nearly doubles the galaxy sample covered in the literature for this group) in order to derive full kinematical information for each individual target and assess the dynamical status for the NGC 5044 Group as a whole.
The Group appears clearly defined in redshift space, with a mean heliocentric radial velocity, (), and a moderate dispersion, . We also found marginal evidence of a possibly related sub-structure (at least four galaxies spectroscopically confirmed) at , while three other galaxy aggregates seem to project on the background of the NGC 5044 field, respectively at and 0.28.
Our kinematical data show no luminosity segregation among the early-type galaxy sub-samples: both the dwarf and bright E/S0 populations show nearly identical velocity distributions ( for dwarfs and for bright ellipticals), while late-type galaxy distribution is on the contrary sensibly broader, with .
On the basis of the imagery, and thanks to excellent seeing conditions of our observations, we tried a revised morphological and membership classification for the galaxies in the sample. We were able to confirm all but one (i.e. galaxy N109) of the “definite members” included in the spectroscopic subsample, which were originally classified based on morphological criteria; however, an important fraction of background galaxies is probably present among “likely” and “possible” members.
The presence of a nucleus, defined as a pointlike source clearly standing out from the inwards extrapolation of the galaxy profile, could be detected in just five out of the nine galaxies originally classified as dE,N, thus confirming the intrisic difficulty of nuclei identification on photographic plates.
Deep surface photometry down to allowed us to detect six new dSph candidates (plus two other originally reported by C99, and confirmed here), most of them at small projected distances from NGC 5044, the central galaxy of the Group.
Clear evidence for disc structures in at least three galaxies previously catalogued as dE or dS0 (namely, N153, N156 and N42), was also obtained. The fact that this was inferred through different kinds of evidences, not always simultaneously present in all objects, suggests that these galaxies probably conform an heterogeneous set. It is thus necessary to extend this study, in order to shed some light on the evolutionary scenarios that led to the present-day dE population in groups. The NGC 5044 Group is particularly suited since it has about half the members as the more studied Fornax Cluster, however its central density and velocity dispersion are larger. It would be thus interesting to test whether proposed models to transform discs into spheroids, like galaxy harassment, could work in different environments.
In a second paper of this series (Buzzoni & Cellone 2004, in preparation) we will further extend our study of the NGC 5044 Group trying a more specific analysis of the distinctive properties and the evolutionary status of stellar populations in LSB galaxies of this Group.
Acknowledgments
This work was based on observations collected at the European Southern Observatory, La Silla (Chile). It is a pleasure to acknowledge Michael Sterzik, Martin Kürster and the whole ESO technical staff for invaluable support during the observing runs at La Silla. We wish also to thank Michael Drinkwater, the referee of this paper, for his constructive remarks. This project received partial financial support from the Italian MIUR under COFIN’00 02-016 and CNR/GNA grants for visiting scientists. Argentinian CONICET is also acknowledged for financial support. SAC wishes to thank the kind hospitality from the Osservatorio Astronomico di Brera (Italy), where part of this work was carried out. This work made use of the NED database supported at IPAC by NASA.
References
- Barazza et al. (2002) Barazza F. D., Binggeli B., Jerjen H., 2002, A&A, 391, 823
- Bassino et al. (2003) Bassino L. P., Cellone S. A., Forte J. C., Dirsch B., 2003, A&A, 399, 489
- Binggeli et al. (1985) Binggeli B., Sandage A., Tammann G. A., 1985, AJ, 90, 1681
- Binggeli et al. (1993) Binggeli B., Popescu C. C., Tammann G. A., 1993, A&AS, 98, 275
- Biviano et al. (2002) Biviano A., Katgert P., Thomas T., Adami C., 2002, A&A, 387, 8
- Bothun & Mould (1988) Bothun G. D., Mould J. R., 1988, ApJ, 324, 123
- Bothun et al. (1987) Bothun G. D., Impey C. D., Malin D. F., Mould J. R., 1987, AJ, 94, 23
- Brodie & Huchra (1991) Brodie J. P., Huchra J. P., 1991, ApJ, 379, 157
- Burstein & Heiles (1982) Burstein D., Heiles C., 1982, AJ, 87, 1165
- Buzzoni (1995) Buzzoni A., 1995, ApJS, 98, 69
- Caldwell (1983) Caldwell N., 1983, AJ, 88, 804
- Cellone (1999) Cellone S. A., 1999, A&A, 345, 403 (C99)
- Cellone & Buzzoni (2001) Cellone S. A., Buzzoni A., 2001, A&A, 369, 742
- Cellone et al. (1994) Cellone S. A., Forte J. C., Geisler D., 1994, ApJS, 93, 397
- Côté et al. (1997) Côté S., Freeman K. C., Carignan C., Quinn P. J., 1997, AJ, 114, 1313
- da Costa et al. (1998) da Costa L. N., et al. 1998, AJ, 116, 1
- David et al. (1994) David L. P., Jones C., Forman W., Daines S., 1994, ApJ, 428, 544
- Davies et al. (1988) Davies J. I., Phillipps S., Cawson M. G. M., Disney M. J., Kibblewhite E. J., 1988, MNRAS, 232, 239
- Deady et al. (2002) Deady J. H., Boyce P. J., Phillipps S., Drinkwater M. J., Karick A., Jones J. B., Gregg M. D., Smith R. M., 2002, MNRAS, 336, 851
- De Rijcke et al. (2001) De Rijcke S., Dejonghe H., Zeilinger W. W., Hau G. K. T., 2001, ApJ, 559, L21
- De Rijcke et al. (2003) De Rijcke S., Dejonghe H., Zeilinger W. W., Hau G. K. T., 2003, A&A, 400, 119
- Drinkwater et al. (2000) Drinkwater M. J., et al. 2000, A&A, 355, 900
- Drinkwater et al. (2001) Drinkwater M. J., Gregg M. D., Holman B. A., Brown M. J. I., 2001, MNRAS, 326, 1076
- Durrell (1997) Durrell P. R., 1997, AJ, 113, 531
- Fairall et al. (1992) Fairall A. P., et al. 1992, AJ, 103, 11
- Ferguson (1989) Ferguson H. C., 1989, AJ, 98, 367
- Ferguson & Binggeli (1994) Ferguson H. C., Binggeli B., 1994, A&AR, 6, 67
- Ferguson & Sandage (1989) Ferguson H. C., Sandage A., 1989, ApJ, 346, L53
- Ferguson & Sandage (1990) Ferguson H. C., Sandage A., 1990, AJ, 100, 1 (FS90)
- Geha et al. (2002) Geha M., Guhathakurta P., van der Marel R. P., 2002, AJ, 124, 3073
- Girardi et al. (2003) Girardi M., Rigoni E., Mardirossian F., Mezzetti M., 2003, A&A, 406, 403
- Graham et al. (1996) Graham A., Lauer T. R., Colless M., Postman M., 1996, ApJ, 465, 534
- Gutiérrez-Moreno et al. (1988) Gutiérrez-Moreno A., Moreno H., Cortés G., Wenderoth E., 1988, PASP, 100, 973
- Held & Mould (1994) Held E. V., Mould J. R., 1994, AJ, 107, 1307
- Hilker et al. (1999a) Hilker M., Kissler-Patig M., Richtler T., Infante L., Quintana H., 1999a, A&AS, 134, 59
- Hilker et al. (1999b) Hilker M., Infante L., Vieira G., Kissler-Patig M., Richtler T., 1999b, A&AS, 134, 75
- Hilker et al. (2003) Hilker M., Mieske S., Infante L., 2003, A&A, 397, L9
- Huchra et al. (1983) Huchra J., Davis M., Latham D., Tonry J., 1983, ApJS, 52, 89
- Ichikawa et al. (1986) Ichikawa S.-I., Wakamatsu K.-I., Okamura S., 1986, ApJS, 60, 475
- Jerjen & Dressler (1997) Jerjen H., Dressler A., 1997, A&AS, 124, 1
- Jerjen et al. (2000) Jerjen H., Binggeli B., Freeman K. C., 2000, AJ, 119, 593
- Jerjen et al. (2000) Jerjen H., Kalnajs A., Binggeli B., 2000, A&A, 358, 845
- Jørgensen (1994) Jørgensen I., 1994, PASP, 106, 967
- Kambas et al. (2000) Kambas A., Davies J. I., Smith R. M., Bianchi S., Haynes J. A., 2000, AJ, 120, 1316
- Karachentseva et al. (1985) Karachentseva V. E., Karachentsev I. D., Börngen F., 1985, A&AS, 60, 213
- Karick et al. (2003) Karick A. M., Drinkwater M. J., Gregg M. D., 2003, MNRAS, 344, 188
- Kelson et al. (2000) Kelson D. D., Illingworth G. D., van Dokkum P. G., Franx M., 2000, ApJ, 531, 137
- Khosroshahi et al. (2004) Khosroshahi H. G., Raychaudhury S., Ponman T. J., Miles T. A., Forbes D. A., 2004, MNRAS, 349, 527
- Lares et al. (2004) Lares M., García Lambas D., Sánchez A. G., 2004, MNRAS, 352, 501
- McKay et al. (2004) McKay N. P. F., et al. 2004, MNRAS, 352, 1121
- Mieske et al. (2004) Mieske S., Hilker M., Infante L., 2004, A&A, 418, 445
- Moore et al. (1998) Moore B., Lake G., Katz N., 1998, ApJ, 495, 139
- Patterson & Thuan (1996) Patterson R. J., Thuan T. X., 1996, ApJS, 107, 103
- Pedraz et al. (2002) Pedraz S., Gorgas J., Cardiel N., Sánchez-Blázquez P., Guzmán R., 2002, MNRAS, 332, L59
- Phillipps et al. (2001) Phillipps S., Drinkwater M. J., Gregg M. D., Jones J. B., 2001, ApJ, 560, 201
- Rakos & Schombert (2004) Rakos K., Schombert J., 2004, AJ, 127, 1502
- Ryden & Terndrup (1994) Ryden B. S., Terndrup D. M., 1994, ApJ, 425, 43
- Sabatini et al. (2003) Sabatini S., Davies J., Scaramella R., Smith R., Baes M., Linder S. M., Roberts S., Testa V., 2003, MNRAS, 341, 981
- Sandage & Binggeli (1984) Sandage A., Binggeli B., 1984, AJ, 89, 919
- Sandage & Hoffman (1991) Sandage A., Hoffman G. L., 1991, ApJ, 379, L45
- Scheffler (1982) Scheffler H., 1982, in Landolt-Bornstein ed., Group 6, Vol. 2, Astronomy & Astrophysics. Springer, Berlin, p. 46
- Schneider et al. (1983) Schneider D. P., Gunn J. E., Hoessel J. G., 1983, ApJ, 264, 337
- Secker & Harris (1997) Secker J., Harris W. E., 1997, PASP, 109, 1364
- Secker et al. (1997) Secker J., Harris W. E., Plummer J. D., 1997, PASP, 109, 1377
- Sérsic (1968) Sérsic J. L., 1968, Atlas de galaxias australes. Córdoba, Argentina: Observatorio Astronómico
- Skillman et al. (2003) Skillman E. D., Côté S., Miller B. W., 2003, AJ, 125, 593
- Thuan & Gunn (1976) Thuan T. X., Gunn J. E., 1976, PASP, 88, 543
- Trujillo et al. (2001) Trujillo I., Graham A. W., Caon N., 2001, MNRAS, 326, 869
- Vigroux et al. (1984) Vigroux L., Souviron J., Vader J. P., 1984, A&A, 139, L9
- Wade et al. (1979) Wade R. A., Hoessel J. G., Elias J. H., Huchra J. P., 1979, PASP, 91, 35
- Ziegler & Bender (1998) Ziegler B. L., Bender R., 1998, A&A, 330, 819