11email: paola, rdc, braito, saracco, marcella@brera.mi.astro.it 22institutetext: Universitäts-Sternwarte München, Scheiner Str. 1, 81679 München, Germany
22email: bender, feulner, hopp@usm.uni-muenchen.de 33institutetext: University of Texas at Austin, Austin, Texas 78712
33email: drory@astro.as.utexas.edu 44institutetext: IRA-CNR, Firenze, Italy
44email: filippo@arcetri.astro.it 55institutetext: Max-Planck-Institut für extraterrestrische Physik, Giessenbachstrae, D-85748 Garching, Germany
55email: bender, hopp, maraston@mpe.mpg.de
Looking for obscured QSOs in the X–ray emitting ERO population
We present XMM-Newton data centered on one of the MUNICS Near Infrared Cluster Survey fields (S2F1) and we discuss the X-ray properties of the 6 X-ray emitting EROs found. For one of them we have already obtained the redshift using near–infrared spectroscopic data, while for the remaining 5 EROs the analysis is based on photometric redshifts. We find evidence for the presence of an X–ray obscured QSO in at least 5 out of the 6 X-ray emitting EROs. For these 5 objects we derive intrinsic (2–10 keV) luminosities in excess of 1044 erg s-1 and intrinsic column densities higher than 1022 cm-2. These values have been obtained through a basic X-ray spectral analysis for the three brightest sources and through the analysis of the hardness ratios for the remaining two. All of these 5 X–ray emitting EROs appear extended in the optical/near–infrared bands indicating that the host galaxy emission dominates at these wavelengths. This suggests that the hosted AGNs are likely to be absorbed also in the optical/near–infrared bands: i.e. they are likely X–ray obscured possible type 2 QSOs. For the remaining ERO the presence of an AGN is suggested both by its high 0.5-2 keV luminosity (L erg s-1) and by its X-ray-to-optical flux ratio. In this case the quality of the present data prevents us from placing firm constraints on the AGN type hosted. Finally, the near-IR spectrum obtained for one of the 6 EROs classifies the host galaxy as an elliptical at with a stellar mass well in excess of 1011 M⊙. This result corroborates the possible link between the QSO activity and the formation of massive spheroids.
Key Words.:
Galaxies: active, Extremely Red Object - X-rays: galaxies1 Introduction
As shown by Chandra and XMM-Newton observations, a sizable fraction of the 2–10 keV selected sources are associated with Extremely Red Objects (EROs, R-K5). In particular, about 15% of the 2–10 keV sources down to a flux limit of 10-15 erg cm-2 s-1 are EROs (e.g. Rosati et al. Rosati (2002); Mainieri et al. Mainieri (2002)). This already significant fraction should be considered as a lower limit since several X–ray sources are not yet covered by deep K–band observations. Unfortunately, good–quality optical and/or X–ray spectra are available only for a few X–ray emitting EROs, preventing us from firmly establishing their physical nature. The X–ray and optical/near–IR photometric properties, the only information available for the large majority of the X–ray emitting EROs studied so far, strongly suggest that the bulk of this population is composed of obscured AGNs at least at the brightest (F10-15 erg cm-2 s-1) X–ray fluxes (e.g Alexander et al. Alexander02 (2002), Alexander03 (2003); Barger et al. Barger02 (2002), Barger03 (2003); Stevens et al. Stevens (2003); Szokoly et al. Szokoly (2004), Brusa et al. 2004b ). Although dusty starbursts are also observed as EROs (e.g. Brusa et al. Brusa02 (2002)), their fraction is not high enough to dominate the population of X–ray emitting EROs at these X–ray fluxes. Indeed, the large majority of X–ray emitting EROs have measured X–ray–to–optical flux ratios typical of AGN (i.e. FX/F0.1) and evidence of obscuration comes from both their hard X–ray colors and their extremely red optical–to–near–infrared colors. In particular, hard X–ray colors are generally associated with a large amount of circumnuclear gas (NH111As usually done in the recent literature, we use here NH=1022 cm-2 as the dividing NH value between X–ray unabsorbed and absorbed sources.1022 cm-2) which blocks the softer X–ray emission, while red optical colors indicate that large amounts of dust are absorbing the typical intrinsic blue continuum of the AGN (Elvis et al. Elvis (1994), Risaliti & Elvis Risaliti (2004)). The few cases for which either X–ray and/or optical spectra are available seem to confirm the presence of X–ray and/or optical obscuration (e.g. Lehmann et al. Lehmann (2002); Vignali et al. Vignali (2002); Mainieri et al. Mainieri (2002); Willott et al. Willott (2003); Roche et al. Roche (2003); Stevens et al. Stevens (2003); Mignoli et al. Mignoli (2004); Szokoly et al. Szokoly (2004); Brusa et al. 2004a , 2004b ) and, more important, indicate that most of the X–ray emitting EROs host high–luminosity AGNs (L1044 erg s-1, i.e. QSOs). These findings open the possibility that a significant fraction of X–ray emitting EROs could host X–ray obscured and optically absorbed (i.e type 2) QSO (for details on this class of sources see e.g. Norman et al. Norman (2002); Stern et al. Stern (2002); Della Ceca et al. Della Ceca03 (2003) and references therein). These sources are predicted in large numbers by the synthesis model of the Cosmic X–ray Background (38% and 16% of Cosmic X–ray Background should be due to QSO2 following the Gilli et al. Gilli (2001) and Ueda et al. Ueda (2003) models, respectively).
To study the nature of X–ray emitting EROs, we have obtained two XMM-Newton observations respectively on the S2F1 (AO–2 period) and on the S2F5 (AO–3 period) fields of the MUnich Near-IR Cluster Survey (MUNICS, Drory et al. Drory (2001), Feulner et al. Feulner (2003)). These fields ( arcmin2 each) are covered by photometric observations in the B, V, R, I, J and K’ bands (Drory et al. Drory (2001)) down to limiting magnitudes of R24 mag and K’19.3 mag (50% completeness limits for point sources). Thirty-six out of the 170 EROs present in these two fields have a K’ magnitude brighter than 18.5 and are already under investigation by an ongoing spectroscopic survey performed by our group (see Saracco et al. Saracco1 (2003), Saracco2 (2004)).
Here we discuss the X-ray properties of 6 X-ray emitting EROs found in the S2F1 field. The XMM-Newton data centered on the S2F5 field have not yet been made available by the European Space Agency. A comprehensive analysis of the whole sample of near-IR selected EROs including the stacked analysis and the statistical X-ray properties performed on both fields will be presented in a forthcoming paper.
Throughout this paper we assume H0=70 km s-1 Mpc-1 and =0.3, =0.7. All the magnitudes are in the Vega system.
2 X-ray and NIR data
While the large majority of the X–ray emitting EROs studied so far are X–ray selected, here we deal with a sample of near–infrared selected EROs for which follow–up X–ray observations have been obtained. Using the photometric data available from the MUNICS catalog for the S2F1 field, we have selected 70 EROs down to a magnitude of K’19.3. This corresponds to 0.440.05 EROs/arcmin2, in agreement with the surface density measured in other surveys at a comparable K–band magnitude (e.g. Daddi et al. Daddi (2000)). This field was observed by XMM-Newton on February 11, 2003 (XMM-Newton pointing: RA 03:06:41.56, Dec +00:01:00.4) in full frame mode and with the thin filter applied. In order to investigate the X–ray properties of our ERO sample, we have considered the pipeline source lists provided by the XMM-Newton SSC (XMM-Newton Survey Science Center, Watson et al. Watson01 (2001)) and created using the SAS (Science Analysis System) version 5.4. Using the 8 X–ray brightest sources in the field, we found that both for EPIC–pn and EPIC–MOS cameras the average displacement between X–ray and optical (from the USNO catalog, Monet Monet (1998)) positions is of 3″1.5″. We have considered all the sources detected in at least one of the XMM-Newton SSC energy bands222We refer to the following six energy bands: 0.2–0.5, 0.5–2, 0.5–4.5, 2.0–4.5, 4.5–7.5, 7.5–12.0 keV; see http://xmmssc-www.star.le.ac.uk/ for details. and we have cross-correlated their astrometrically corrected positions with the MUNICS K–band catalog containing all the near–infrared galaxies brighter than K’19.3 (620) in the S2F1 field. To this end, a conservative matching radius of 6″ has been used: this is the radius for which more than 95% of the XMM–Newton sources in the SSC catalog are associated with USNO A.2 sources. We find that 6 EROs fall within 6″ of an X–ray source333 The remaining near–infrared sources with an X–ray association and with R–K’5 will be discussed in a forthcoming paper.. For all of these 6 sources the offset between the X–ray and near–infrared position is smaller than 4″. Moreover, no EROs have been found with an X–ray association between 4″ and 11″, implying that no NIR/X–ray associations have been lost using the adopted matching radius. Using the probability of chance coincidence444, where is the matching radius used and is the cumulative surface density of EROs brighter than K’ determined in the S2F1 field., we estimate that the expected number of spurious EROs/X–ray source associations is 0.8. The same result has been obtained by cross–correlating the near–infrared positions with fake X–ray coordinates (obtained by shifting the true X–ray positions by 1, 3 and 5 arcmin in different directions on the sky).
None of the 6 EROs discussed above has an optical spectrum in the MUNICS catalog. All of them appear clearly extended in the optical/near–infrared images even if the quality of the data is not good enough to allow a detailed morphological analysis.
In four cases (S2F1_71, S2F1_493, S2F1_507, S2F1_714)555The identification name used here is taken from the MUNICS catalog, see http://capella.usm.uni-muenchen.de/ drory/munics/interactive/interactive.html no near–infrared sources, in addition to the ERO, fall within 6″ of the X–ray centroids, thus yielding unambiguous matches. In two cases, more than one near–infrared source falls within the matching radius. Again, none of these galaxies has an optical spectrum in the MUNICS catalog. In particular, two field galaxies fall within 6″ of the X–ray source possibly associated with the ERO S2F1_443. The first galaxy (#435, K’=18.4 mag) lies at 5.4″ from the X–ray centroid. It appears extended in the optical/near–infrared images and the SED is well fitted by an emission line galaxy at z 2. The second galaxy (#437, K’=18.3 mag), which is also an SDSS source (SDSS J030632.1+000109.3, see http://www.sdss.org/dr2/), lies 6″ away from the X–ray centroid. It appears extended with rather blue colors and its SED is well fitted by an emission–line galaxy at z=0.5. Analogously, one field galaxy (#552, K’=18.9 mag) lies at a distance of 2″ from the X–ray source associated with the ERO S2F1_551. As reported in the MUNICS catalog, the SED of the galaxy #552 is well fitted by a z=0.6 elliptical galaxy. In order to disentangle these ambiguous matches, we used the chance coincidence probability and, whenever available, the radio detection. In particular, we have estimated from our data the cumulative surface density of field sources in K’ band and we find P666In field galaxies, is the cumulative surface density of near–infrared sources brighter than K’ determined in the S2F1 field (see footnote 4).field(435)=0.07, Pfield(437)=0.09 (to be compared with PERO(443)=9) and Pfield(552)=0.02 (to be compared with PERO(551)=0.006). The highly significant probabilities associated with EROs suggest the correct association with the X–ray sources. For ERO S2F1_443, the reality of being the X–ray emitting source is also supported by the fact that it has a radio counterpart at less than 2″ from the XMM position; this ERO is the only one in our sample with a NVSS (NRAO VLA Sky Survey, Condon et al. Condon (1992); f(1.4GHz)=26.10.9 mJy) and FIRST (Faint Images of the Radio Sky at Twenty-cm, Becker et al. Becker (1995); f(1.4GHz)=24.380.14 mJy) counterpart. Taking into account the spectroscopic redshift of the object (see Table 1), we obtain a L51026 Watt/Hz, typical of high power radiogalaxies (e.g. Sadler et al. Sadler (2002)).
| Namea | K’a | R-K’a | zphota |
|---|---|---|---|
| S2F1_71 | 19.3 | 5 | 1.3 |
| S2F1_443 | 18.4 | 5.6 | 1.7b |
| S2F1_493 | 18.6 | 5.4 | 1.4 |
| S2F1_507 | 18.4 | 5.2 | 1.4 |
| S2F1_551 | 19.2 | 5 | 1.2 |
| S2F1_714 | 18.5 | 5.5 | 1.0 |
Notes:
a For more details on the near-infrared objects see
the Interactive Catalog and Image Browser:
http://capella.usm.uni-muenchen.de/ drory/munics/interactive/
interactive.html.
The uncertainties on the photometric redshift are 0.2.
b For this ERO we have the spectroscopic redshift (see
Sec. 4). For comparison,
the photometric redshift reported in the MUNICS catalog is
zphot=1.5.
| Name | EPIC Instruments | (NIR-X)a | P(ERO) | MLpnb | Net countsc |
|---|---|---|---|---|---|
| [arcsec] | [0.2-10 keV] | ||||
| S2F1_71 | MOS1+MOS2+pn | 0.9 | 310-4 | 106d | 193 |
| S2F1_443 | MOS1 | 0.8 | 910-5 | 41d | 35g |
| S2F1_493 | pn | 3.8 | 310-3 | 44e | 24h |
| S2F1_507 | MOS1+MOS2+pn | 1.65 | 410-4 | 165e | 181 |
| S2F1_551 | MOS2+pn | 4.0 | 610-3 | 48d | 70 |
| S2F1_714 | pn | 2.2 | 910-4 | 12f | 31i |
Notes:
a If the X–ray source has been detected
with more than one instrument,
the (NIR-X) is the mean distance weighted by the positional errors
associated with each instrument.
b From the XMM-Newton SSC source list.
Full details about the source likelihood parameters can be found in
http://xmmssc-www.star.le.ac.uk.
c Total net counts (calculated using XSPECv11.2, FTOOLSv5.0, see Sect. 3.1 and 3.2)
in the 0.2–10 keV energy band from all the instruments reported in column 2.
d Source Likelihood in the 0.5–4.5 keV range (MOS1 camera).
e Source Likelihood in the 0.5–2.0 keV range (pn camera).
f Source Likelihood in the 4.5–7.5 keV range (pn camera).
g Since this source has been detected only in the 0.5–4.5 keV band, the net counts reported
refer only to this band.
h Since this source has been detected only in the 0.5–2.0 keV band, the net counts reported
refer only to this band.
i Since this source has been detected only in the 2–4.5 keV and 4.5–7.5 keV bands,
the net counts reported refer only to the 2-7.5 keV band.
Thus, we find 6 firm X-ray emitting EROs. The near–infrared properties of the 6 EROs (K’–band magnitude and R-K’ color) are reported in Table 1 (column 2 and 3) along with their redshift (column 4). For all but one (S2F1_443) we report the photometric redshift taken from the MUNICS catalog. The method used to obtain the MUNICS photometric redshifts and their accuracy are discussed in Drory et al. (Drory03 (2003)). As discussed below, AGNs are likely hosted in these EROs. However, since these 6 EROs appear extended both in the optical and near–infrared images, the host galaxy emission dominates at these wavelengths. For this reason the photometric redshift gives a reliable estimate of their redshift. For ERO S2F1_443 we report the spectroscopic redshift derived by a low-resolution near-IR spectrum obtained as a part of an ongoing spectroscopic follow-up program aimed at observing the whole sample of bright (K’) EROs in the field (Saracco et al. Saracco1 (2003), Saracco2 (2004)). We present this spectrum and the relevant analysis in Sec. 4.
In Table 2 we report for each ERO the EPIC cameras with which they have been detected (column 2), the distance between the near–infrared and the X–ray positions (column 3) and the probability of finding the ERO within this distance by chance (column 4). The fifth column lists the maximum likelihood in the pn–image (MLpn) for all the EROs except for S2F1_443 which lies on a pn gap; for this source, the ML reported in the table refers to the MOS1 camera. The last column reports net counts.
3 X–ray analysis
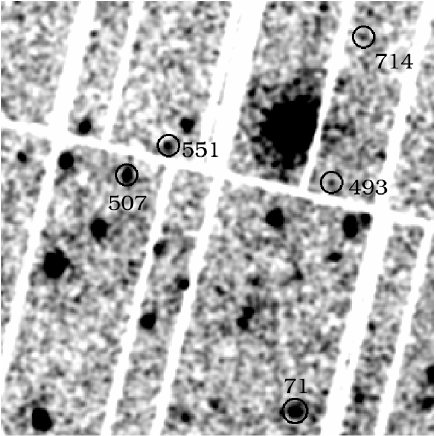
As already discussed in Sect. 2, the XMM-Newton data of the S2F1 field have been processed using tasks from the SAS version 5.4 and have been analyzed using standard software packages (XSPECv11.2, FTOOLSv5.0, PIMMSv3.4). In order to perform the X–ray analysis of our 6 EROs, the event files released from the standard pipeline have been filtered for high background time intervals. The net exposure times, after data cleaning, are 41 ksec, 44 ksec and 46 ksec for pn, MOS1 and MOS2 respectively. We have used the latest calibration files released by the EPIC team to create response matrices that include also the correction for the effective area at the source position in the detector (SAS arfgen and rmfgen tasks have been used). All the 6 X–ray emitting EROs have an off–axis angle smaller than 6 arcmin. The central part (12′12′) of the 0.5–10 keV pn–image is shown in Figure 1. Five out of the six X–ray emitting EROs found in this field are marked with a circle, while the remaining one (S2F1_443, detected in the MOS1 camera) is not shown since it lies on a pn gap. At the spatial resolution of the XMM-Newton EPIC instruments and with the present statistics, all the EROs appear to be X–ray point–like.
3.1 EROs 71, 507, 551: X–ray spectral analysis
For 3 EROs (71, 507, 551), the number of net X–ray counts is good enough to allow a basic X–ray spectral analysis. In order to maximize the signal–to–noise ratio, the X–ray spectra have been extracted using circular regions of 20″ of radius centered on the X–ray position. The background spectra have been extracted from source–free circular regions close to the object with an area about 4 times larger. While EROs S2F1_71 and S2F1_507 have been detected in all the 3 EPIC instruments, ERO S2F1_551 has not been detected in the MOS1 camera and only barely detected in the MOS2 camera; therefore for this latter object only pn data have been used for the spectral analysis. For the first two EROs the MOS1 and MOS2 data have been combined to maximize the statistics. Finally, MOS and pn spectra have been binned in order to have at least 15 counts per energy channel and are fitted simultaneously in the 0.5–10 keV band leaving the relative normalizations free to vary. All the errors in the following are reported at the 90% confidence level for one interesting parameter (=2.71, Avni Avni (1976)).
In the fitting procedure, the appropriate Galactic hydrogen column density along the line of sight (6.851020 cm-2, Dickey & Lockman Dickey (1990)) has been taken into account. We find that the three X–ray spectra are well described by a single absorbed (N cm-2) power–law model at the zphot of each source.
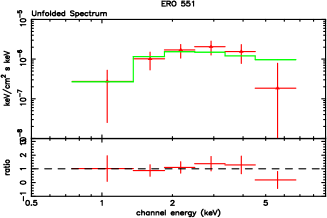
Due to the X–ray statistics of ERO S2F1_551 (60 net counts in the pn image), the intrinsic photon index for this ERO is fixed to 1.9, the typical value for unabsorbed AGN (Nandra et al. Nandra (1997); Caccianiga et al. Caccianiga (2004)).
| ID | a | F(2-10keV)b | L(2-10keV)c | ||
|---|---|---|---|---|---|
| cm-2] | [10-15 erg cm-2 s-1] | [1044 erg s-1] | |||
| S2F1_71d | 1.47 | 2.2 | 16/22 | 19.43.6 | 1.4 |
| S2F1_507d | 2.58 | 2.3 | 21.4/16 | 6.61.2 | 1.3 |
| S2F1_551 | 1.9(fixed) | 9.6 | 4.6/5 | 12.42.8 | 1.1 |
a Intrinsic column density.
b Fluxes are corrected only for the Galactic absorption.
c Luminosities are corrected both for the Galactic and
intrinsic absorption.
d By using a fixed photon
index of 1.9 also for EROs S2F1_71 and S2F1_507
we obtain results similar to those reported in this table
except for the intrinsic absorbing column density
of S2F1_507 which gives a best fit value
of N0.81022 cm-2
with a very large error bar.
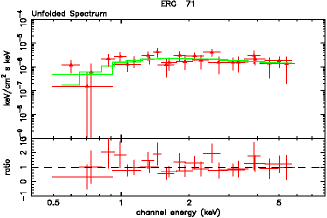
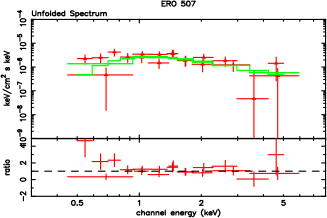
The best fit unfolded spectra and residuals are shown in Figure 2 while the relevant best fit parameters, quoted in the rest frame, are summarized in Table 3 along with the 2–10 keV fluxes and the intrinsic luminosities. The errors reported in the table also include the uncertainty on the photometric redshifts (0.2). A pure thermal component is rejected for all the sources at more than 97% confidence level and the addition of a thermal component to the power–law model is not statistically required. These results are in agreement with the point–like appearance of the X–ray emission and with the lack of evident massive clusters in the optical/near–infrared images. As reported in Table 3, the intrinsic column densities and the 2–10 keV luminosities, even if not extreme, are indicative of the presence of obscured (N cm-2) and high–luminosity (L erg s-1) AGNs, i.e. X–ray obscured QSO. All of them appear extended in the optical and near-IR images, i.e. in these bands we do not observe the strong nuclear enhancement due to the QSO and the emission is dominated by the stellar continuum of the host galaxy. These facts suggest that the QSOs are likely to be strongly absorbed also in the optical/near–infrared domain, i.e. they are X–ray absorbed type 2 QSO candidates.
3.2 EROs 443, 493, 714: Broad-band properties
The remaining 3 EROs (443, 493, 714) are detected only in one of the EPIC cameras (see Table 2) and the X–ray statistics are not good enough to obtain a reliable X–ray spectrum. In particular, the ERO S2F1_443 (35 net counts in the 0.5–4.5 keV band) is detected only in the MOS1 while the S2F1_493 (24 net counts in the 0.5–2 keV) and ERO S2F1_714 (31 net counts in the 2–7.5, in particular 11 net counts in the 2–4.5 keV plus 20 net counts in the 4.5–7.5 keV) are detected only in the pn. By performing a visual inspection of all the 3 EPIC cameras, we find that, while S2F1_493 and S2F1_714 are only visible in the image where they have been detected, S2F1_443 is also barely visible in the MOS2 image. In order to increase the statistics of this source we have used MOS1+MOS2 data thus accumulating 50 net counts in total. Later, we will use these statistics to derive the basic X–ray properties of S2F1_443.
Some indications about the origin of the X–ray emission of these 3 EROs have
been derived by calculating their hardness ratios777HR is defined as
follow: HR= where CR are the PSF and vignetting–corrected count
rates in the (0.5–2.0 keV) and in the (2.0–4.5 keV) bands. (hereafter HR).
While the value of the HR (–0.9) derived for S2F1_493 is not a
discriminant of the X–ray emission origin, both S2F1_443
(HR–0.3) and S2F1_714 (HR1) have hardness ratios
typical of obscured AGNs (see Della Ceca et al. Dellaceca04 (2004)). By using
a simulated spectrum at the redshift of the source and by assuming an
intrinsic photon index of 1.9, we have estimated that the intrinsic column
density needed to reproduce the hardness ratios of S2F1_443 and S2F1_714 are
consistent with values larger than 1022 cm-2 and of about 1024
cm-2, respectively.

Although the statistics of S2F1_443 are not good enough to
perform a complete X–ray spectral analysis, it allows us to compare the model used to
reproduce the hardness ratio with the X–ray data. The good agreement between model
and data is shown in Figure 3 where a rest-frame absorbed power–law model
(=1.9, NH=31022 cm-2) is superimposed on the
background–subtracted X–ray counts, binned in order to have at least 15 total
counts per energy channel. From this model we derive a Galactic corrected flux of
F(2-10keV)=6.72.410-15 erg cm-2 s-1 and, by using
its spectroscopic redshift (1.70.05, see Table 1 and Sect. 4) we
estimate an intrinsic luminosity of L(2-10keV)=1.20.61044
erg s-1 (the luminosity errors take into
account also the redshift uncertainties), in good agreement with
its high radio luminosity (see Sect. 2).
In order to estimate the flux and the luminosity for ERO S2F1_714, we have calculated the vignetting–corrected count rates in the 2–7.5 keV band (the ERO has been detected only in the 2–4.5 and 4.5–7.5 SSC band). Using the measured count rates and assuming a power–law model with 1.4 (similar to that of the unresolved Cosmic X–ray background since the source seems to be very hard) we obtain a Galactic corrected flux of F(2-10keV)=8.83.510-15 erg cm-2 s-1. Taking into account the photometric redshift (1.00.2) and the intrinsic column density derived from the HR analysis (NH consistent with 1024 cm-2, see above) we estimate an intrinsic luminosity L888The k–correction has been applied to the luminosities assuming a power–law model with =1.4.1044 erg s-1.
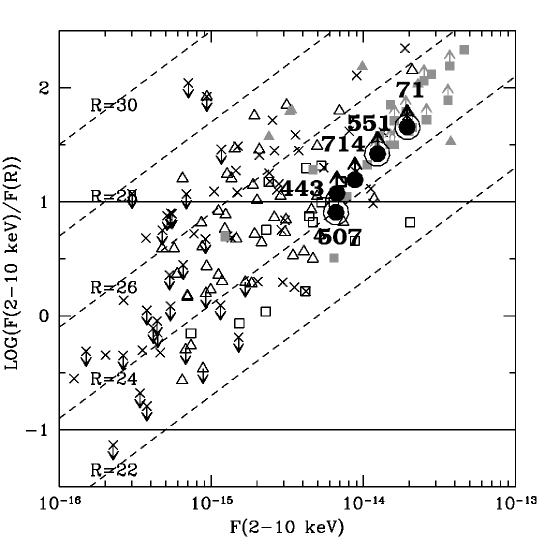
In summary, we find evidence that both S2F1_443 and S2F1_714 are probably X–ray obscured AGNs of high luminosity ( erg s-1). This result is also supported by the (2–10 keV)–to–optical flux ratios of these two EROs as a function of their (2–10 keV) fluxes (see Figure 4). The two EROs discussed here are plotted with solid circles, while the 3 EROs for which the presence of an obscured and high luminosity AGNs is already indicated by the X–ray spectral analysis (see Sec. 3.1) have been plotted with solid circles encircled by larger open circle. For comparison in Figure 4 we plot also other X–ray emitting EROs taken from the literature (i.e. Hellas2XMM, Mignoli et al. Mignoli (2004); Lockman Hole, Mainieri et al. Mainieri (2002), Stevens et al. Stevens (2003); Chandra Deep Field North–CDFN, Vignali et al. Vignali (2002), Alexander et al. Alexander02 (2002), Alexander03 (2003), Barger et al. Barger03 (2003); Chandra Deep Field South–CDFS, Roche et al. Roche (2003), Szokoly et al. Szokoly (2004); ELAIS, Willott et al Willott (2003)). Different symbols have been used to mark the different EROs on the basis of the information available in the original papers. In particular, we have distinguished the EROs for which there is firm evidence for the presence of intrinsic obscuration on the basis of their X–ray and/or optical spectrum (squares) from the EROs for which X–ray obscuration is only suggested from the broad–band X–ray photometry, i.e. hardness ratios (triangles). Non active galaxies, EROs for which X–ray properties do not suggest intrinsic obscuration and EROs for which the information available is insufficient to constrain their physical nature are grouped together and indicated with crosses. More details on the symbols are reported in the caption of the figure. A large fraction of the EROs having Log(FX/F1 (at least 45 out of the 70) are obscured AGNs. This is indeed what is expected on the basis of the observational results found so far by deep, medium and bright X–ray surveys (Fiore et al. Fiore03 (2003)). The fact that S2F1_443 and S2F1_714 lie in this region of the diagram strongly supports the hypothesis derived from the hardness ratio analysis, i.e. that strong X–ray obscuration is likely present in these high luminosity AGNs. Moreover, these 2 EROs also appear extended in the optical and near-IR images suggesting that the AGNs are likely to be strongly absorbed also in the optical/near–infrared domain. All the X–ray and optical properties make the presence in these sources of X–ray obscured type 2 QSO likely.
As for ERO S2F1_493, it is detected only in the 0.5–2 keV energy band and it has an HR value (HR–0.9) which cannot exclude a starburst origin of the X–ray emission observed. We have calculated the vignetting corrected count rates for this object in the detection band (0.5–2 keV) and we have estimated the 0.5–2 keV flux corrected for the Galactic absorption using both a power–law model with a photon index of 1.9 (F(0.5-2keV)=0.90.410-15 erg cm-2 s-1) and a Raymond-Smith model with KT=0.7 and Solar abundance (F(0.5-2keV)=0.80.410-15 erg cm-2 s-1). In both cases, taking into account the photometric redshift of the object (1.40.2), we find a 0.5–2 keV luminosity of L1043 erg s-1. Even taking into account the uncertainties, this value is more typical of AGN and well exceeds that of starburst galaxies, typically lower than 1042 erg s-1 (e.g. Persic et al. Persic (2004)). This makes it unlikely that the X–ray emission is dominated by starburst activity unless an extremely high star formation rate, of the order of few 1000 yr-1 (Persic et al. Persic (2004)), has occurred in this object. On the other hand, with these star formation rates we would expect a flux density at 1.4 GHz in excess of 1 mJy by using the relation SFR()=L1.4GHz/(4 [erg s-1 Hz-1]) [M⊙ yr-1] (Condon Condon (1992); Persic et al. Persic (2004)). If this were the case, we would expect to detect this source in the FIRST survey (the rms at the source position is 0.144 mJy), while no radio counterpart is present. On the contrary, its (0.5–2.0 keV)–to–optical flux ratio (F(0.5-2keV)/Fopt1) is typical of unobscured AGN (Maccacaro et al. Maccacaro (1988)) in agreement with the hardness ratio analysis. This fact, combined with its high 0.5–2 keV luminosity, strongly supports the presence of an AGN. The detection of this object only in the 0.5–2 keV energy band does not contradict the presence of an AGN with a photon index of 1.9. Indeed, we would not expect to detect such an AGN in the other XMM-Newton SSC energy bands (see footnote 2) with the exposure time of our observation. Moreover, the properties of this ERO do not exclude the presence of a Compton–thick AGN where the intrinsic absorbing column density is well in excess of 1024 cm-2 (see e.g. Ghisellini et al. Ghisellini (1994)). If this were the case we would not directly observe the X–ray emission produced by the central engine and we would probably measure only the reflected fraction (at least a factor 10 lower than the intrinsic X–ray emission). For this reason, in the case of a Compton–thick AGN the intrinsic luminosity of ERO 493 would be well in excess of 1045 erg s-1. The hypothesis of high X–ray obscuration also would be in agreement with its extended appearance in the optical/near–infrared images under the assumption of a good correlation between optical and X–ray absorption (see Caccianiga et al. Caccianiga (2004)).
4 Near–infrared spectroscopy of ERO S2F1_443
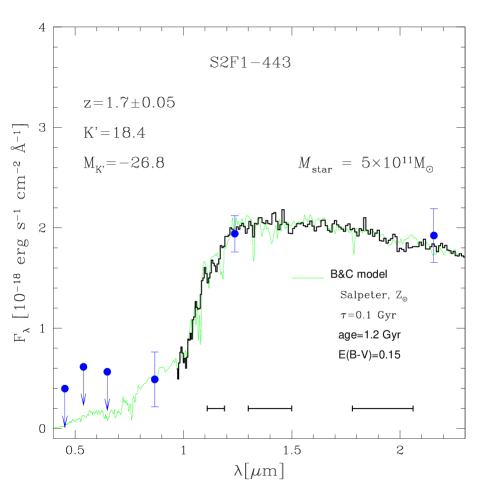
For the ERO S2F1_443 we carried out near-IR spectroscopic observations at the 3.6 Italian Telescopio Nazionale Galileo (TNG999see http://www.tng.iac.es). The observations (four hours of exposure) were performed in November 2003 with the prism disperser Amici mounted on the near-IR camera NICS. The prism allows us to cover the wavelength range 9000-24000 Å in a single shot with a constant resolution of (1.5” width slit). The Amici spectrum of the ERO S2F1_443 is shown in Figure 5 (thick black histogram) along with the optical and near-IR photometric points. Given the low resolution of Amici, this prism is best suited to describe the spectral shape of a source and to detect strong continuum features such as the 4000Å break, while it makes unfeasible the detection of emission/absorption lines for sources as faint as our EROs. In particular, with the S/N reached in our observations, we expect to detect only features with equivalent widths larger than Å. Moreover, under the hypothesis that an obscured QSO is present, the strongest lines expected in the Amici spectrum (e.g. [OIII] and H) would lie in the windows where the opacity is higher than 80%. For these reasons, the lack of emission lines in the Amici spectrum of S2F1_443 was expected even if it were hosting an obscured QSO. On the other hand, the overall shape of the spectrum unambiguously classifies the host as an elliptical galaxy. The Balmer break visible at m places this galaxy at . Given its apparent magnitude (K’=18.4), the resulting rest-frame (k-corrected) K-band absolute magnitude is M, i.e. 2.6 mag brighter than local L∗ galaxies (M=-24.2, Cole et al. 2001). Assuming that this galaxy evolves passively from to ( mag), i.e. the stellar mass of the galaxy is already fully assembled at , the resulting K-band luminosity of this elliptical at would be LL∗. Considering that local L∗ galaxies have stellar masses of the order of 1011 M⊙, this implies that the elliptical S2F1_443 has a stellar mass of the order of 4 M⊙. This result, which is basically model–independent, shows that this elliptical possibly hosting an obscured QSO is the high-z counterpart of the massive ellipticals populating the very bright end (LL∗) of the local luminosity function. A comparison with the Bruzual & Charlot (Bruzual (2003)) models is also shown in Figure 5. The synthetic spectrum (thin grey line) providing the best fit to the photometric and to the spectroscopic data has been obtained with a Salpeter initial mass function with solar metallicity and an exponentially decaying star formation with a time scale Gyr. The template is reddened by E(B-V)=0.15 mag and it is 1.2 Gyr old, implying that the bulk of the stars have to be formed at or higher (Saracco et al. 2004, MNRAS submitted; Longhetti et al. 2004 in preparation). The best–fitting model gives a stellar mass M⊙ providing one of the most massive ellipticals spectroscopically confirmed at these redshifts. The high mass and the early-type nature of this galaxy hosting a QSO and the similar results found in previous works (see e.g. Cowie et al. Cowie (2001); Mignoli et al. Mignoli (2004)) suggest a possible link between the QSO activity and the end of the main episode of massive star formation in spheroids (e.g. Granato et al. Granato (2001), Granato03 (2004)). Higher resolution near–infrared spectroscopy and better statistics would be needed to fully address this issue.
5 Conclusions
In this paper, new XMM-Newton data have been used to study and to discuss the nature of 6 X–ray emitting EROs found in the MUNICS S2F1 field. For these 6 sources optical and near–infrared photometry as well as photometric redshifts are available from the MUNICS catalog. For one of the 6 objects, ERO S2F1_443, we have presented and analyzed the near–infrared low–resolution spectrum, deriving the spectroscopic redshift and unveiling the nature of the host galaxy.
Five (71, 443, 507, 551, 714) out of the 6 EROs discussed here have X–ray properties matching those expected for X–ray obscured QSO. For 3 of them (71, 507, 551) these properties have been derived by performing a basic X–ray spectral analysis, while for the other 2 (443 and 714) we used their X–ray broad–band photometry (i.e. X–ray emission, hardness ratio analysis, radio properties). Due to the extended appearance of these 5 sources in the optical and near–infrared images, i.e. they are galaxy dominated at these wavelengths, it is very likely that the QSOs are also strongly absorbed in the optical/near–infrared bands, i.e. they are also type 2 QSO. This is consistent with the fact that their (2–10 keV)–to–optical flux ratios vs. their 2–10 keV luminosities are in agreement with the relation described by Fiore et al. (Fiore03 (2003)) for type 2 AGNs. In these 5 X–ray emitting EROs we find evidence for the presence of X–ray obscured type 2 QSO candidates.
For the remaining ERO, S2F1_493, the presence of an AGN is strongly suggested by the high 0.5–2 keV luminosity and by the value of its (0.5–2 keV)–to–optical flux ratio (1). In this case the hypothesis of very high intrinsic obscuration (1024 cm-2) is not discarded. On the other hand, the quality of the data prevents us from placing reliable constraints on the AGN type hosted by this ERO. Due to its optical X–ray broad–band photometry, if an obscured AGN is present, it would have an X–ray luminosity in the QSO regime.
The only QSO host galaxy for which we have collected spectroscopic observations so far is an elliptical galaxy at z1.7 with a stellar mass well above 10. This result suggests possible link between the QSO activity and the formation of the bulk of the stars in massive spheroids.
Acknowledgements.
PS acknowledges financial support by the Istituto Nazionale di Astrofisica (INAF). This work has received partial financial support from ASI (I/R/037/01, I/R/062/02, I/R/071/02) and from the Italian Ministry of University and the Scientific and Technological Research (MURST) through grant Cofin-03-02-23. The MUNICS project was supported by the Deutsche Forschungsgemeinschaft, Sonderforschungsbereich 375, Astroteilchenphysik. We thank Alessandro Caccianiga, Tommaso Maccacaro, Christian Vignali and the anonymous referee for helpful comments.References
- (1) Akiyama, M., Ohta, K., Yamada, T. 2000, ApJ, 532, 700
- (2) Alexander, D.M., Vignali, C., Bauer, F.E. et al. 2002, AJ, 123, 1149
- (3) Alexander, D.M., Bauer, F.E., Brandt, W. N., et al. 2003, AJ, 126, 539
- (4) Avni, Y. 1976, ApJ, 210, 642
- (5) Barger, A. J., Cowie, L. L., Brandt, W. N., et al. 2002, AJ, 124, 1839
- (6) Barger, A.J., Cowie, L.L., Capak, P., et al. 2003, AJ, 126, 632
- (7) Becker, R. H., White, R. L., Helfand, D. J., 1995, ApJ, 450, 559
- (8) Brusa, M., Comastri, A., Daddi, E., et al. 2002, ApJ, 581, L89
- (9) Brusa, M., 2004a, Proc. of ’Multi-wavelength AGN surveys’, Cozumel (Mexico) [astro-ph/0405416]
- (10) Brusa, M., Comastri, A., Daddi, E., et al., 2004b, A&A, in press [astro-ph/0409257]
- (11) Bruzual G., Charlot S., 2003, MNRAS, 344, 1000
- (12) Caccianiga, A., Severgnini, P., Braito, V., et al. 2004, A&A, 416, 901
- (13) Condon, J. J., 1992, ARA&A, 30, 575
- (14) Cowie, L. L., Barger, A. J., Bautz, M. W., et al. 2001, ApJ, 551, 9
- (15) Daddi, E., Cimatti, A., Pozzetti, L., et al. 2000, A&A, 361,535
- (16) Della Ceca, R., Braito, V., Beckmann, V., et al. 2003, A&A, 406, 555
- (17) Della Ceca, R., Maccacaro, T., Caccianiga, A., et al. 2004, A&A, in press [astro-ph/0407481]
- (18) Dickey, J. M., & Lockman, F. J. 1990, ARA&A, 28, 215
- (19) Drory, N., Feulner, G., Bender, R., et al. 2001, MNRAS, 325, 550
- (20) Drory, N., Bender, R., Feulner, G., et al. 2003, ApJ ,595, 698
- (21) Elvis, M., Wilkes, B. J., McDowell, J. C., et al. 1994, ApJS, 95, 1
- (22) Feulner, G., Bender, R., Drory, N., et al. 2003, MNRAS, 342, 605
- (23) Fiore, F., Brusa, M., Cocchia, F., et al. 2003, A&A, 409, 79
- (24) Ghisellini, G., Haardt, F., Matt, G. 1994, MNRAS, 267, 743
- (25) Gilli, R., Salvati, M., Hasinger, G., et al. 2001, A&A, 366, 407
- (26) Granato, G.L., Silva, L., Monaco, P., et al. 2001, MNRAS, 324, 757
- (27) Granato, G.L., De Zotti, G., Silva, L., Bressan, A., Danese, L. 2004, ApJ, 600, 580
- (28) Lehmann, I., Hasinger, G., Schmidt, M., et al. 2001, A&A, 371, 833
- (29) Lehmann, I., Hasinger, G., Murray, S. S., Schmidt, M., 2002 ASP, p. 105, V. 262, p.88
- (30) Maccacaro, T., Gioia, I. M., Wolter, A., Zamorani, G., Stocke, J.T. 1988, ApJ, 326, 680
- (31) Mainieri, V., Bergeron, J., Hasinger, G., et al. 2002, A&A, 393, 425
- (32) Mignoli, M., Pozzetti, L., Comastri, A., et al. 2004, A&A, 418, 827
- (33) Monet, D., Bird A., Canzian, B., et al. 1998, The PMM USNO A2.0 Catalog, (Washington D.C: U.S. Naval Observatory)
- (34) Nandra, K., George, I. M., Mushotzky, R. F., Turner, T. J., Yaqoob, T. 1997, ApJ, 476, 70
- (35) Norman, C., Hasinger, G., Giacconi, R., et al. 2002, ApJ, 571, 218
- (36) Persic, M., Rephaeli, Y., Braito, V., et al. 2004, A&A, 419, 849
- (37) Risaliti, G., Elvis, M., 2004, review for ”Super-massive Black Holes in the Distant Universe”, Ed. A. J. Barger, Kluwer Academic Publishers [astro-ph/0403618]
- (38) Roche, N.D., Dunlop, J., Almaini, O. 2003, MNRAS, 346, 803
- (39) Rosati, P., Tozzi, P., Giacconi, R., et al. 2002, ApJ, 566, 667
- (40) Sadler, E.M., Jackson, C. A., Cannon, R.D., et al. 2002, MNRAS, 329, 227
- (41) Saracco, P., Longhetti, M., Severgnini, P., et al. 2003, A&A, 398, 127
- (42) Saracco, P., Longhetti, M., Severgnini, P., et al. 2004, Proc. of the Venice conference ”Multi-wavelength Mapping of Galaxy Formation and Evolution”, R. Bender and A. Renzini Eds., to appear in the Springer-Verlag series ”ESO Astrophysics Symposia”. (astro-ph/0312097).
- (43) Schmidt, M., Hasinger, G., Gunn, J., et al. 1998, A&A, 329, 495
- (44) Stern, D., Moran, E. C., Coil, A. L., et al. 2002, ApJ, 568, 71
- (45) Stevens, J.A., Page M.J., Ivison R.J., et al. 2003, MNRAS, 342, 249
- (46) Szokoly, G.P., Bergeron, J., Hasinger, G., et al. 2004, ApJ, in press [astro-ph/0312324]
- (47) Ueda, Y., Akiyama, M., Ohta, K., Miyaji, T. 2003, ApJ, 598, 886
- (48) Vignali, C., Alexander, D.M., Bauer. F.E., 2002, Proc. of the 5th Italian AGN Meeting ”Inflows, Outflows and Reprocessing around black holes”
- (49) Watson, M. G., Auguères, J. L., Ballet, J., et al. 2001, A&A, 365, L51
- (50) Willott, C.J., Simpson, C., Alamini, O., et al. 2003, MNRAS, 339, 397