A New Milky Way Companion: Unusual Globular Cluster or Extreme Dwarf Satellite?
Abstract
We report the discovery of SDSSJ1049+5103, an overdensity of resolved blue stars at (, ) = (162.343, 51.051). This object appears to be an old, metal-poor stellar system at a distance of 45 kpc, with a half-light radius of 23 pc and an absolute magnitude of MV = -3.0. One star that is likely associated with this companion has an SDSS spectrum confirming it as a blue horizontal branch star at 48 kpc. The color-magnitude diagram of SDSSJ1049+5103 contains few, if any, horizontal or red giant branch stars, similar to the anomalously faint globular cluster AM 4. The size and luminosity of SDSSJ1049+5103 places it at the intersection of the size-luminosity relationships followed by known globular clusters and by Milky Way dwarf spheroidals. If SDSSJ1049+5103 is a globular cluster, then its properties are consistent with the established trend that the largest radius Galactic globular clusters are all in the outer halo. However, the five known globular clusters with similarly faint absolute magnitudes all have half-mass radii that are smaller than SDSSJ1049+5103 by a factor of 5. If it is a dwarf spheroidal, then it is the faintest yet known by two orders of magnitude, and is the first example of the ultra-faint dwarfs predicted by some theories. The uncertain nature of this new system underscores the sometimes ambiguous distinction between globular clusters and dwarf spheroidals. A simple friends-of-friends search for similar blue, small scalesize star clusters detected all known globulars and dwarfs closer than 50 kpc in the SDSS area, but yielded no other candidates as robust as SDSSJ1049+5103.
Subject headings:
Milky Way: globular clusters — galaxies: formation — galaxies: dwarfs — Local Group: surveys .1. Introduction
Milky Way globular clusters are invaluable pieces in the puzzle of galaxy formation. At present, their properties support a general picture of Galactic halo formation as a combination of accretion and dissipative collapse (see review in Mackey & Gilmore 2004). However, the detailed interpretation of globular cluster (GC) properties in the context of galaxy formation is complex. One outstanding problem is the sometimes ambiguous distinction between GCs and dwarf spheroidal galaxies (dSphs). For example, a few Milky Way GCs, such as Cen, have a spread in stellar age and metallicity similar to that seen in many dwarf galaxies (Ashman & Zepf, 1998), and have absolute magnitudes that overlap those of known dSph galaxies. A small number of faint GCs have radial profiles that are well fit by an NFW profile (e.g. Palomar 13; Côté et al., 2002) or have central densities similar to those of dSphs (e.g. Palomar 14; Harris, 1996) and thus may be the remnants of a stripped dSph.
The relationship between globular clusters and dSphs is particularly interesting in light of recent predictions for low mass substructure around the Milky Way (Klypin et al., 1999; Moore et al., 1999; Bullock et al., 2000; Benson et al., 2002; Susa & Umemura, 2004; Kravtsov et al., 2004, among others). It is difficult to determine whether GCs ever contained a substantial amount of non-baryonic dark matter (Ashman & Zepf, 1998), which would arguably put them in the category of ultra-faint dwarf galaxies. If some globular clusters are embedded in extended dark matter halos, the dark matter may not be dynamically important within the extent of the observable stellar distribution.
There are known globular clusters and 9 known dSphs orbiting the Milky Way. The total number of known clusters has increased by just a few percent over the last twenty-five years (Harris et al., 1997; Harris, 1996; Ortolani et al., 2000; Hurt et al., 2000; Irwin et al., 1995; Ortolani et al., 1993) and nearly all of the new globular clusters lie at low Galactic latitude. Only one Milky Way dSph has been discovered since 1990. The lack of new GCs or dSphs at 30∘ could lead some to believe that all high latitude systems have been discovered. However, one anomalously faint GC (AM 4; MV = +0.2) was discovered serendipitously more than 20 years ago (Madore & Arp, 1982), suggesting that other ultra-faint star clusters may still reside undetected in our halo. Furthermore, the advent of the Sloan Digital Sky Survey (SDSS; York et al. 2000) could lead to the discovery of similar systems, should they exist (Willman et al., 2002). In this paper, we report the discovery of SDSSJ1049+5103, a new ultra-faint, stellar system in the outer halo of the Milky Way. We estimate and discuss some properties of SDSSJ1049+5103 in comparison to both globular clusters and Milky Way dwarf spheroidal galaxies.
2. Photometric Data
2.1. Sloan Digital Sky Survey and Object Discovery
The Sloan Digital Sky Survey (SDSS; York et al. 2000), is a spectroscopic and photometric survey in 5 passbands (; Fukugita et al. 1996; Gunn et al. 1998; Hogg et al. 2001; Smith et al. 2002), that has thus far imaged thousands of square degrees of the sky. Data is reduced with an automatic pipeline consisting of: astrometry (Pier et al., 2003); source identification, deblending and photometry (Lupton et al., 2001); photometricity determination (Hogg et al., 2001); calibration (Fukugita et al., 1996; Smith et al., 2002); and spectroscopic data processing (Stoughton et al., 2002).
We discovered SDSSJ1049+5103 as part of an ongoing SDSS survey for Milky Way satellite galaxies (Willman et al., 2002). This object was detected at () = (162.35,51.05) as a 12 fluctuation over the average spatially smoothed density of stellar sources with 21.0 22.5. See Willman et al. 2002 and Willman et al., 2004, in preparation, for details of the survey analysis technique. Although we analyzed square degrees of available photometric data thus far, the data relevant for this discovery are included in Data Release 2 of the SDSS (DR2, Abazajian et al. 2004).
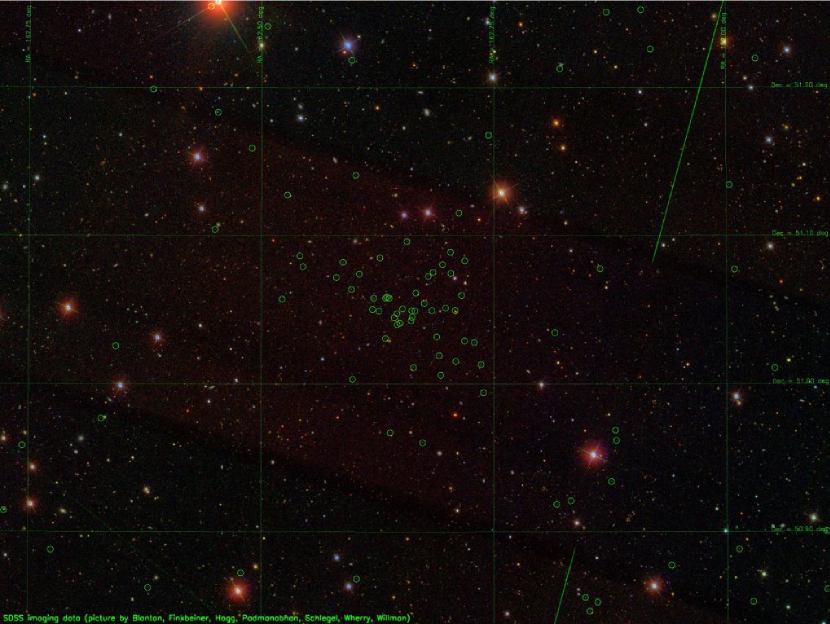
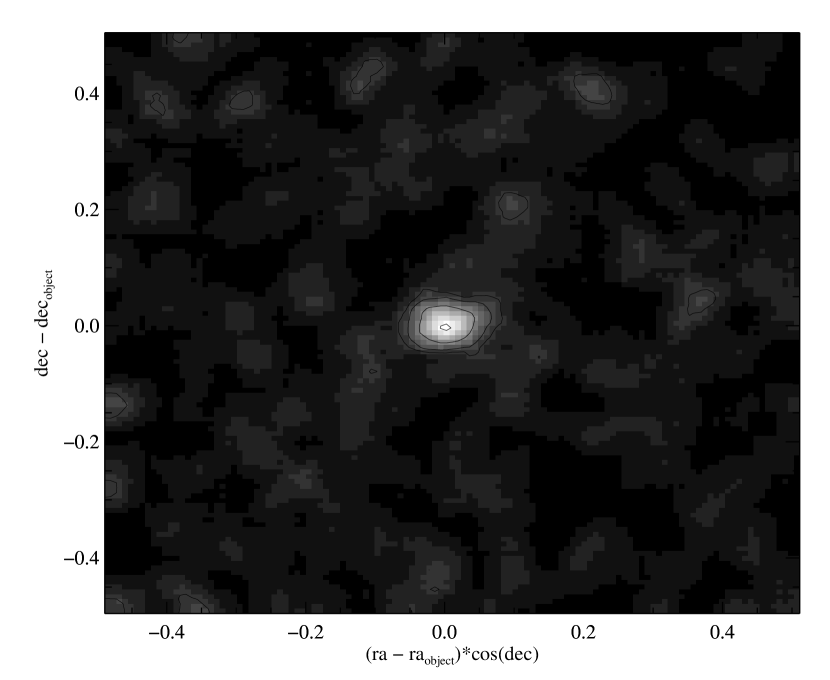
Figure 1 is a 0.57 x 0.42 deg2 image centered on the detection. Because SDSSJ1049+5103 is so sparse, it is difficult to see in the image alone. However, the stellar overdensity is readily visible in the overplotted spatial distribution of faint blue stars ( 0.3). To more clearly illustrate the strength of the overdensity, we show a spatially smoothed density map of stars with covering 0.5 0.5 degrees2 around the detection in Figure 2. This figure shows that the center of the cluster is detected at more than 20 over the foreground when only blue stars are included in the analysis. The density contours do not exhibit obvious evidence for tidal stripping, such as that seen around Palomar 5 (Rockosi et al., 2002; Odenkirchen et al., 2003) as well as numerous other Milky Way GCs (Leon et al., 2000). However, a lack of obvious tidal features in the SDSS data is unsurprising, because the surface brightness of SDSSJ1059+5103 is so faint. Therefore, deeper observations may reveal tidal distortion in the stellar distribution.
Our algorithm for detecting satellite galaxies is not optimized for the discovery of small scale length blue stellar overdensities, such as SDSSJ1049+5103. Therefore, to investigate whether numerous such systems remain undetected in the Milky Way’s halo, we performed a friends-of-friends search for groups of stars with and . We used a linking length of 0.8′ and examined groups with as few as 5 stars. Although this simple search recovered both SDSSJ1049+5103 and all of the known globular clusters and dSphs closer than 50 kpc in the area searched, no obvious new candidates were found. Unfortunately, AM 4, the lowest luminosity of the known clusters, is not in the SDSS area. It is thus unclear whether a comparably faint GC would have been detected with a simple friends-of-friends approach. Furthermore, the method we used is only sensitive to very blue star clusters closer than 50 kpc. It was nevertheless surprising that there appeared to be no other systems similar to SDSSJ1049+5103 in the 5000 deg2 currently covered in our search. However, if the Milky Way GC luminosity function (GCLF) at ultra-faint magnitudes does not deviate from that observed between -4.0 -7.4, one would not expect to discover many additional globular clusters. Extrapolating the known GCLF (McLaughlin, 1994; McLaughlin & Pudritz, 1996) to faint magnitudes predicts a total of only a few undiscovered GCs fainter than MV = -4.0 over the whole sky.
2.2. Follow-up Observations
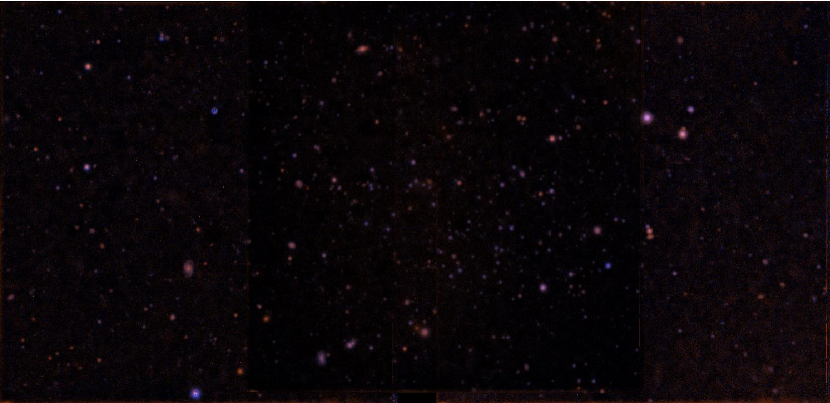
On June 10, 2004, we obtained follow-up imaging of SDSSJ1049+5103 on the 3.5-m telescope at Apache Point Observatory. We used the SpiCAM 2048x2048 CCD, which has a resolution of 0.282 arcseconds pixel-1. Three 900 second exposures and one 600 second exposure were taken in the SDSS filter, and 1200, 900, and 600 second exposures were taken in the SDSS filter. Seeing was 1.6′ in and in and observations were taken at high airmass. These combined observations are thus only sufficient to resolve stars as faint as 23. The total sky coverage of these data is 60 arcmin2. These data were photometrically calibrated by comparison with SDSS observations of the same field.
Figure 3 is a 0.2 x 0.075 deg2 image of the APO data. An overdensity of faint stars is visible near the center.
3. Results
3.1. Color-Magnitude Diagrams
Figure 4 shows the color-magnitude diagram (CMD) of SDSSJ1049+5103 and of the surrounding field as observed by SDSS. The stars in the ’source’ CMDs include all those within the central 1.75′, which roughly corresponds to the half-light radius of the source (see §3.2). The SDSS imaging data become incomplete near r = 21.5, because star-galaxy separation is unreliable at fainter magnitudes (Ivezić et al., 2000). These data have been corrected for reddening, using the maps of Schlegel et al. (1998).
The CMD of SDSSJ1049+5103 contains an overabundance of stars bluer than = 0.5 relative to the field. We consider three broad possibilities for the nature of these blue stars:
-
1.
a young, metal rich stellar population with a main sequence turnoff around = 0.3
-
2.
an old, metal poor stellar population with a main sequence turnoff around = 0.3
-
3.
a horizontal branch plus a few red giant branch stars
Both a young, metal rich and an old, metal poor stellar population could have a main sequence turnoff with 0.3. If the stars in SDSSJ1049+5103 with 0.3 are indeed main sequence turnoff stars, then the stars with = 0.45 and 20 21 are sub-giant branch stars. However, those stars are bluer relative to the detected turnoff than sub-giant stars of a young ( 10 Gyr) stellar population (see isochrones in Girardi et al. 2004). We therefore consider it unlikely that SDSSJ1049+5103 is a young, metal rich stellar population.
To distinguish between the second and third possibilities, we compare the CMD of SDSSJ1049+5103 to those of several low luminosity globular clusters. We compare to empirical rather than theoretical isochrones because the Main Sequence colors of theoretical isochrones in Sloan filters may be offset from those of actual old stellar populations (Girardi et al., 2004). Figure 5 shows the CMDs of Palomar 5, Palomar 15, and Palomar 3 as observed by SDSS, with the empirically derived stellar locus of Pal 5 projected to the correct solar distance and overplotted on each CMD. The data in these plots have been corrected for reddening using the maps of Schlegel et al. (1998). The Pal 5 stellar locus does provide a reasonable match to both Pal 3 and Pal 15’s stars, but with a slight shift in color due to metallicity differences. Although Pal 5’s stellar population has been shown to display mass segregation (Koch et al., 2004), it is nonetheless an acceptable basis for comparison because it is the most nearby, and thus the most well measured of the sparse globulars in the SDSS area.
We overplotted the stellar locus of Palomar 5 on the CMD of SDSSJ1049+5103 in Figure 4. Considering the substantial photometric errors on stars fainter than = 21.5 in the SDSS, the Pal 5 stellar locus projected to 45 kpc and to 170 kpc (plus an offset in color) both provide reasonable matches to the data. If the nearby distance is correct, then the blue stars are turnoff stars. If the far distance is correct, then they are horizontal branch stars. The star at (, ; ) = (-0.32,19.8; 162.3048, 51.0424) has an SDSS spectrum (plate-mjd-fiber 876-52669-375) that shows it is a blue horizontal branch star at a distance of 48 kpc, supporting the hypothesis that SDSSJ1049+5103 is an old stellar system near d = 45 kpc.
The deeper CMD based on the APO data, shown in Figure 6, provides even more compelling evidence that the detected stellar overdensity is a turnoff at 45 kpc rather than a horizontal branch at 170 kpc. Pal 5 has an age of 11 - 12 Gyr (Martell et al., 2002) and an [Fe/H] = -1.38 (Harris, 1996). The main sequence turnoff (MSTO) of SDSSJ1049+5103 is bluer than that of Pal 5. The bluer turnoff color may mean that this new companion is more metal poor than Pal 5, although the small number of resolved stars in the existing data makes the metallicity difficult to estimate. We assign a generous uncertainty of kpc to the distance estimate to account for the fact that SDSSJ1049+5103’s turnoff may be intrinsically more or less luminous than that of Pal 5 (e.g. it would be intrinsically brighter if its stars are more metal poor and of a similar age as Pal 5’s).
A few blue straggler candidates are visible in the CMD bluer than and brighter than . Assuming that we are seeing the turnoff of an old, metal-poor population, SDSSJ1049+5103 contains very few stars brighter than the sub-giant branch. One known globular cluster, AM 4, also appears to be devoid of any horizontal branch or red giant branch stars. In §3.3 we evaluate the significance of the dearth of evolved stars in SDSSJ1049+5103.
Figure 7 shows the X,Z distribution of the known Milky Way globulars and dSphs with the new detection overplotted. Our estimated distance of 45 kpc from the Sun places SDSSJ1049+5103 at 50 kpc from the center of the Galaxy. If SDSSJ1049+5103 is indeed a globular cluster, it will add to the small number of globulars known to have Galactocentric distances greater than 35 kpc.
3.2. Radial Profile
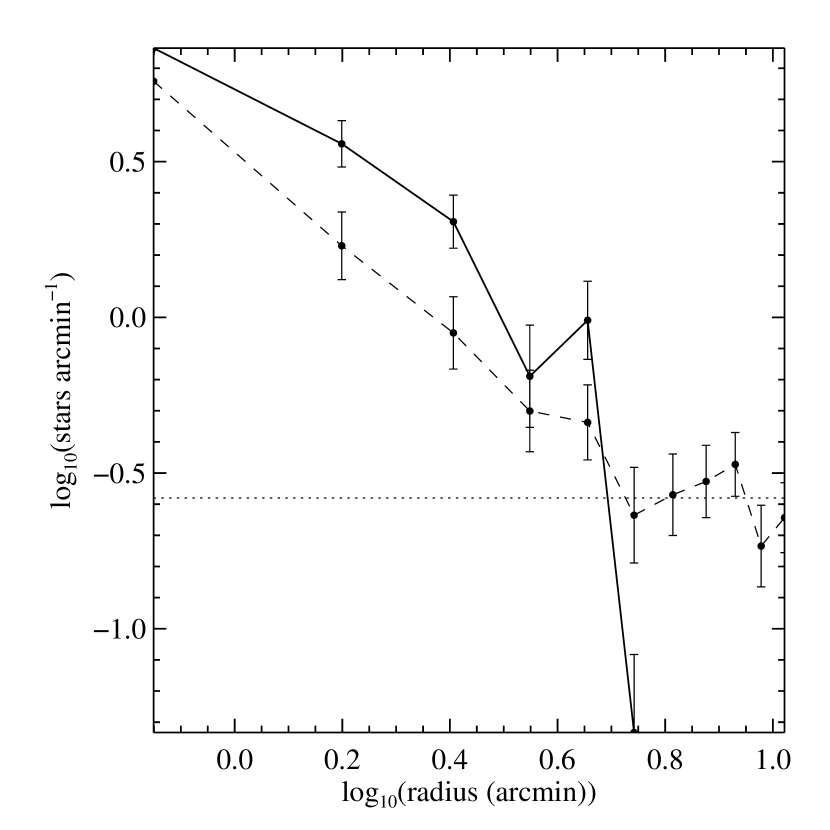
Figure 8 shows the azimuthally averaged radial profile of SDSSJ1049+5103. Because our APO observations do not have sufficient area to properly subtract the foreground, we used a cut of and to eliminate the majority of foreground field stars from both the APO and the SDSS observations. Figure 8 shows that the SDSS stars satisfying these criteria approach a field density of stars arcmin-1 by 4.5 arcmin from the detection center. The dashed line denotes this adopted foreground level. The profile is consistent with a power law, with a possible break near 2′, and shows no evidence for a core at the center. However, the central radial bin in this plot has a radius of 1.0′ (13 pc at a distance of 45 kpc), so any core would likely be unresolved by the current data. The small number of stars also prevents us from measuring a reliable central surface brightness.
We corrected the radial stellar counts for the foreground level overplotted on Figure 8 and estimated the half-light radius from the resulting cumulative radial profile shown in Figure 9. This estimate assumes that the stellar population is roughly constant with radius. The half-light radius, , is a good way to characterize the initial size of stellar systems, because it changes slowly with their dynamical evolution (Murphy et al., 1990, among others). Both the SDSS data and the APO data yield , which corresponds to a physical size of 23 pc at a distance of 45 kpc. Allowing for a generous uncertainty in of and including a distance uncertainty of 10 kpc, we estimate a plausible range of physical half-mass radii of 13 to 36 pc.
If it is a globular cluster, then SDSSJ1049+5103 follows the well known trend that all large size GCs are in the outer Galactic halo (van den Bergh, 2003). Pal 14 is the only known GC with a half-mass radius larger than 20 pc.
3.3. Stellar Luminosity Function and Total Luminosity
We use three approaches to estimate the total luminosity of SDSSJ1049+5103. We first estimate a lower limit by summing the luminosity of likely cluster stars within the half-light radius, and then doubling the summed luminosity to account for stars outside the half-light radius. Taking all stars with and , and accounting for the liberal distance uncertainty stated above, this approach yields MV,faint = -1.5 0.5.
Second, we compare the observed stellar luminosity function of the new object to that of Palomar 5. Table 1 shows the stellar luminosity functions of SDSSJ1049+5103, as observed by both SDSS and APO, and of Pal 5 projected to 45 kpc. We include all stars bluer than = 0.65 in the luminosity function of SDSSJ1049+5103. The sharp increase at faint magnitudes in the ratio of SDSSJ1049+5103 stars observed at APO to Pal 5 stars observed in SDSS is due to the fact that SDSS does not resolve stars as faint as the APO observation. The numbers in this Table show that SDSSJ1049+5103 has 1/5 of the number of Pal 5 stars in each of the magnitude bins bright enough to be well resolved by SDSS. We thus divided Pal 5’s luminosity by the conservatively small factor of 5 to yield = -3.3. However, Table 1 shows that SDSSJ1049+5103 has few, if any, stars brighter than 20.5, which means that it has few, if any, horizontal branch or red giant branch stars. We thus crudely correct for the fact that of Pal 5’s luminosity comes from stars brighter than the sub-giant branch and find MV,corr = -3.0, which we adopt as the absolute magnitude of SDSSJ1049+5103 for the rest of this paper. Accounting for distance uncertainty, we derive a maximum plausible luminosity of with this technique, resulting in a total range of -1 -3.7.
Similar to SDSSJ1049+5103, the globular cluster AM 4 has no stars brighter than its main sequence turnoff. By comparison with M3, Inman & Carney (1987) estimated that AM 4 should have 9 1 stars brighter than its turnoff; however it only has 1. SDSSJ1049+5103 is not as anomalous as AM 4 in that respect. By comparison with Pal 5, we estimate that there should be 7 stars in SDSSJ1049+5103 with an apparent magnitude brighter than 20.5. The APO observations contain 4 candidates for such stars: () = (0.41,20.12; -0.33,19.81 - the BHB star; 0.60,19.52; 0.56,18.17). It is plausible that the dearth of bright, red stars in SDSSJ1049+5103 is simply due to its low stellar surface density. Furthermore, Pal 5 has been shown to exhibit radial mass segregation. This segregation causes stars at the bright end of Pal 5’s luminosity function to be overrepresented in its central region, relative to what one would expect for an unrelaxed system. This bias could result in an overestimate of the expected number of horizontal and red giant branch stars for SDSSJ1049+5103.
4. Comparison With the Properties of Known Stellar Systems
We now compare the properties estimated above to those of known globular clusters and dSphs.
4.1. MV and
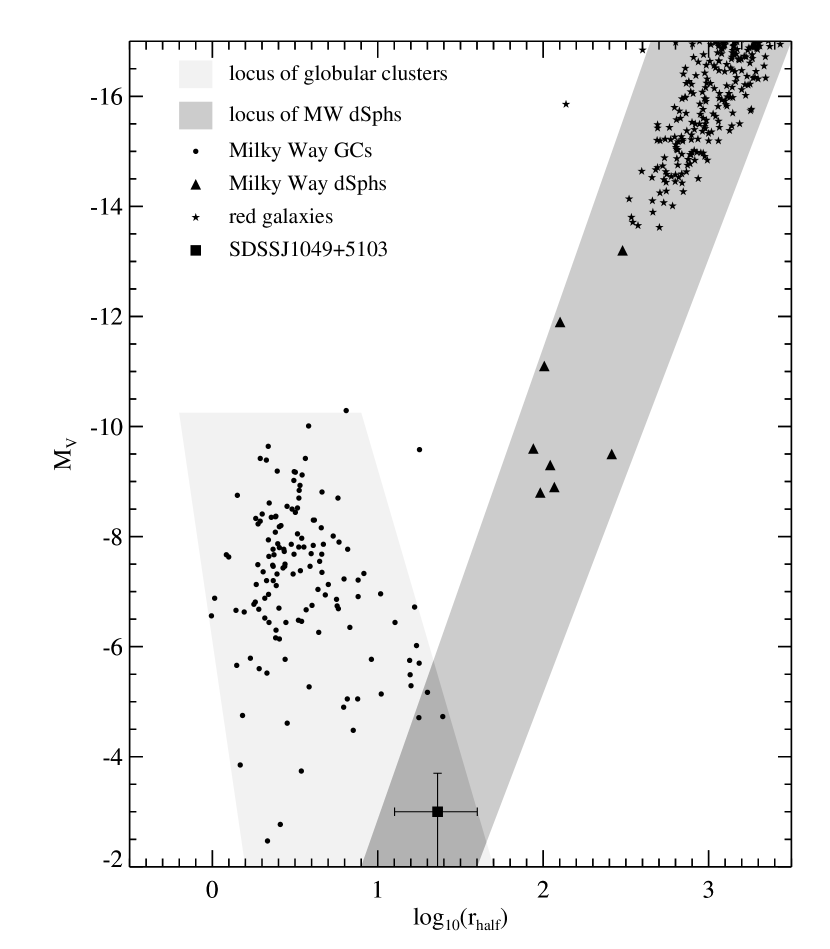
We compare the estimated half-light radius, , and absolute magnitude of SDSSJ1049+5103 to those of the known Milky Way globular clusters and the Milky Way dSphs (except for Sagittarius), in Figure 10. We estimate the half-light radii of the dSphs using data from Mateo (1998) to determine the geometric mean of each core and tidal radius along the semi-major and semi-minor axes and then integrating the corresponding King model. We shaded the empirical size-luminosity locus followed by both the globulars and the dSphs. Because there are so few known MW dSphs, their locus is not robustly known. We thus overplotted the red galaxies from the SDSS low luminosity galaxy catalog of Blanton et al. (2004). The Milky Way dSphs follow nearly the same size-luminosity relation followed by other red, low luminosity galaxies.
SDSSJ1049+5103’s combination of size and luminosity places it at the intersection of the relationships followed by globular clusters and and by the nearby dSphs. Although SDSSJ1049+5103 is 6 magnitudes fainter than the faintest known Milky Way dwarf, its low surface brightness re-raises the timely question: “What is the difference between globular clusters and dwarf galaxies?” The presence of dark matter is the apparent physical, and perhaps the fundamental, distinction between the two sets of objects. The fact that globular clusters are much more compact than dwarfs is the most easily measured and most reliable observational criterion for classification. However Figure 10 shows that the size-luminosity relationships of globular clusters and of Milky Way dSphs overlap at low luminosities, highlighting the vague distinction between these two classes of objects. Furthermore, the 6 magnitudes separating the faintest Milky Way dwarfs and SDSSJ1049+5103 have not yet been uniformly searched for dwarfs. New surveys may uncover additional nearby faint galaxies, and then SDSSJ1049+5103 would not be such an outlier from other dwarfs.
Indeed, Benson et al. (2002) predict the existence of Milky Way dwarf satellite galaxies as faint as the faintest GCs and with half mass radii that roughly follow the same luminosity-size relation as the known dSphs. Three known GCs also fall within the overlapping size-luminosity region: AM 1, Pal 5, and Pal 14. Pal 5 is well known to currently be undergoing massive disruption by the Milky Way (Rockosi et al., 2002; Odenkirchen et al., 2003). Pal 14 is a young globular cluster known to have the lowest central concentration of any known GC, and AM 1 is the most distant Milky Way GC (d = 120 kpc; Harris 1996). Pal 14 and AM 1 are obvious candidates to search for dark matter in nearby globular clusters.
Figure 10 also shows that SDSSJ1049+5103 is more than the physical size of other faint globulars. However, the fact that SDSSJ1049+5103 is an apparent outlier in size from other faint GCs could be due to observational bias. A globular cluster with a larger scale size than a cluster of the same total luminosity is more difficult to detect than the more compact cluster. Furthermore, all known large scale length GCs are in the outer halo (van den Bergh, 2003). It is thus possible that other ultra-faint, large scale size GCs exist, but have not yet been detectable because they lie at outer halo distances where far fewer of their stars are resolved than if they were more nearby. The lack of other candidates identified by out friends-of-friends search may argue against this possibility.
4.2. Mass
If SDSSJ1049+5103 is a globular cluster, Figure 10 suggests that it has an anomalously large half-light radius. This raises the possibility that it is a globular cluster undergoing tidal disruption. In this section, we do a crude calculation of cluster mass and tidal radius to investigate whether the present data are consistent with this interpretation.
Mandushev et al. (1991) used the dynamical masses of 32 globular clusters to derive an empirical relationship between cluster mass and absolute magnitude:
| (1) |
Given the result from §3.3 that , this equation yields 10 for SDSSJ1049+5103. We note that all of the clusters used in their study were brighter than MV = -5.6, so the reliability of the extrapolation to MV -3.0 is quite uncertain.
We estimate the tidal radii corresponding to this range of satellite masses using the equation:
| (2) |
from Binney & Tremaine (1987). In this equation, is the satellite’s Galactocentric distance, and is the total mass of the Milky Way within that distance. We calculated rtidal assuming RGC = 50 kpc and that = 220 km/sec at that distance (as recently shown to be the case by Bellazzini 2004). The mass range estimated above yields 22 pc 40 pc (1.7′ – 3.0′ at a solar distance of 45 kpc). This range of tidal radii is an upper limit on for SDSSJ1049+5103, if it is truly a low mass-to-light system such as a globular cluster. The satellite’s pericentric distance could be much smaller than its present Galactocentric distance, which would result in smaller derived tidal radii. Its radial profile does not exhibit a break until , and it reaches the foreground stellar density at . If the tidal radius of SDSSJ1049+5103 is actually , one may expect the stellar profile to exhibit a break characteristic of tidal stripping at . However, the data are not yet deep enough to produce a robust measurement of the stellar distribution. The existing data thus allow the possibilities that SDSSJ1049+5103 is a low mass-to-light system that might be tidally stripped, or that the stars are embedded in a more extended, higher mass-to-light system.
5. Summary and Future Work
In this paper, we report the discovery of SDSSJ1049+5103, a new stellar system that is likely in the outer halo of the Milky Way. Based on comparison with Palomar 5, this new system appears to be 50 kpc from the Galactic center, have a half light radius of 23 pc, and M. SDSSJ1049+5103 has a size and luminosity that places it at the intersection of the size-luminosity locus followed by Milky Way globular clusters and and that followed by Milky Way dSphs and nearby faint red galaxies. Both the fundamentally ambiguous distinction between some globular clusters and dSph galaxies and the fact that SDSSJ1049+5103 is unusual relative to the vast majority of GCs leaves open the possibility that it is an extreme dwarf galaxy nearly two orders of magnitude fainter than Ursa Minor, the faintest known MW dSph. Furthermore, some theories predict the presence of low central surface density, ultra-faint dSphs (e.g. Benson et al., 2002) such as SDSSJ1049+5103. If SDSSJ1049+5103 is a globular cluster, then its properties are consistent with undergoing tidal disruption.
Neither the Willman et al. (2002) survey nor a friends-of-friends search revealed additional companions similar to, or even a bit fainter than, SDSSJ1049+5103 in the 5000 square degrees analyzed thus far. This suggests that there is not a substantial unknown population of similar companions closer than 50 kpc.
We are in the process of obtaining both deep, wide field imaging to accurately measure the spatial distribution of SDSSJ1049+5103 and spectra of individual stars to measure ages, metallicities, and line-of-sight velocities. Specifically, deeper imaging may distinguish between a King and NFW surface brightness profile and may also reveal tidal features, which would provide strong constraints on its current mass (Moore, 1996).
References
- Abazajian et al. (2004) Abazajian, K. et al. 2004, AJ, 128, 502
- Ashman & Zepf (1998) Ashman, K. M., & Zepf, S. E. 1998, Globular cluster systems (Globular cluster systems / Keith M. Ashman, Stephen E. Zepf. Cambridge, U. K. ; New York : Cambridge University Press, 1998. (Cambridge astrophysics series ; 30) QB853.5 .A84 1998 ($69.95))
- Bellazzini (2004) Bellazzini, M. 2004, MNRAS, 347, 119
- Benson et al. (2002) Benson, A. J., Frenk, C. S., Lacey, C. G., Baugh, C. M., & Cole, S. 2002, MNRAS, 333, 177
- Binney & Tremaine (1987) Binney, J., & Tremaine, S. 1987, Galactic dynamics (Princeton, NJ, Princeton University Press, 1987, 747 p.)
- Blanton et al. (2004) Blanton, M. R., et al. 2004, AJ submitted, astro-ph/0410164
- Bullock et al. (2000) Bullock, J. S., Kravtsov, A. V., & Weinberg, D. H. 2000, ApJ, 539, 517
- Côté et al. (2002) Côté, P., Djorgovski, S. G., Meylan, G., Castro, S., & McCarthy, J. K. 2002, ApJ, 574, 783
- Fukugita et al. (1996) Fukugita, M., Ichikawa, T., Gunn, J. E., Doi, M., Shimasaku, K., & Schneider, D. P. 1996, AJ, 111, 1748
- Girardi et al. (2004) Girardi, L., Grebel, E. K., Odenkirchen, M., & Chiosi, C. 2004, A&A, 422, 205
- Gunn et al. (1998) Gunn, J. E. et al. 1998, AJ, 116, 3040
- Harris (1996) Harris, W. E. 1996, AJ, 112, 1487
- Harris (1997) Harris, W. E. 1997, VizieR Online Data Catalog, 7202, 0
- Harris et al. (1997) Harris, W. E., Phelps, R. L., Madore, B. F., Pevunova, O., & Skiff, B. A. 1997, AJ, 113, 688
- Hogg et al. (2001) Hogg, D. W., Finkbeiner, D. P., Schlegel, D. J., & Gunn, J. E. 2001, AJ, 122, 2129
- Hurt et al. (2000) Hurt, R. L., Jarrett, T. H., Kirkpatrick, J. D., Cutri, R. M., Schneider, S. E., Skrutskie, M., & van Driel, W. 2000, AJ, 120, 1876
- Inman & Carney (1987) Inman, R. T., & Carney, B. W. 1987, AJ, 93, 1166
- Irwin et al. (1995) Irwin, M. J., Demers, S., & Kunkel, W. E. 1995, ApJ, 453, L21+
- Ivezić et al. (2000) Ivezić, Ž. et al. 2000, AJ, 120, 963
- Klypin et al. (1999) Klypin, A., Kravtsov, A. V., Valenzuela, O., & Prada, F. 1999, ApJ, 522, 82
- Koch et al. (2004) Koch, A., Grebel, E. K., Odenkirchen, M., Martinez-Delgado, D., & Caldwell, J. A. R. 2004, AJ in press, astro-ph/0408208
- Kravtsov et al. (2004) Kravtsov, A. V., Gnedin, O. Y., & Klypin, A. A. 2004, ApJ, 609, 482
- Leon et al. (2000) Leon, S., Meylan, G., & Combes, F. 2000, A&A, 359, 907
- Lupton et al. (2004) Lupton, R., Blanton, M. R., Fekete, G., Hogg, D. W., O’Mullane, W., Szalay, A., & Wherry, N. 2004, PASP, 116, 133
- Lupton et al. (2001) Lupton, R. H., Gunn, J. E., Ivezić, Z., Knapp, G. R., Kent, S., & Yasuda, N. 2001, in ASP Conf. Ser. 238: Astronomical Data Analysis Software and Systems X, 269–+
- Mackey & Gilmore (2004) Mackey, A. D., & Gilmore, G. F. 2004, MNRAS in press, astro-ph/0408404
- Madore & Arp (1982) Madore, B. F., & Arp, H. C. 1982, PASP, 94, 40
- Mandushev et al. (1991) Mandushev, G., Staneva, A., & Spasova, N. 1991, A&A, 252, 94
- Martell et al. (2002) Martell, S. L., Smith, G. H., & Grillmair, C. J. 2002, Bulletin of the American Astronomical Society, 201, 711
- Mateo (1998) Mateo, M. L. 1998, ARA&A, 36, 435
- McLaughlin (1994) McLaughlin, D. E. 1994, PASP, 106, 47
- McLaughlin & Pudritz (1996) McLaughlin, D. E., & Pudritz, R. E. 1996, ApJ, 457, 578
- Moore (1996) Moore, B. 1996, ApJ, 461, L13+
- Moore et al. (1999) Moore, B., Ghigna, S., Governato, F., Lake, G., Quinn, T., Stadel, J., & Tozzi, P. 1999, ApJ, 524, L19
- Murphy et al. (1990) Murphy, B. W., Cohn, H. N., & Hut, P. 1990, MNRAS, 245, 335
- Odenkirchen et al. (2003) Odenkirchen, M. et al. 2003, AJ, 126, 2385
- Ortolani et al. (1993) Ortolani, S., Bica, E., & Barbuy, B. 1993, A&A, 273, 415
- Ortolani et al. (2000) —. 2000, A&A, 361, L57
- Pier et al. (2003) Pier, J. R., Munn, J. A., Hindsley, R. B., Hennessy, G. S., Kent, S. M., Lupton, R. H., & Ivezić, Ž. 2003, AJ, 125, 1559
- Rockosi et al. (2002) Rockosi, C. M. et al. 2002, AJ, 124, 349
- Schlegel et al. (1998) Schlegel, D. J., Finkbeiner, D. P., & Davis, M. 1998, ApJ, 500, 525
- Smith et al. (2002) Smith, J. A. et al. 2002, AJ, 123, 2121
- Stoughton et al. (2002) Stoughton, C. et al. 2002, AJ, 123, 485
- Susa & Umemura (2004) Susa, H., & Umemura, M. 2004, ApJ, 610, L5
- van den Bergh (2003) van den Bergh, S. 2003, ApJ, 590, 797
- Willman et al. (2002) Willman, B., Dalcanton, J., Ivezić, Ž., Jackson, T., Lupton, R., Brinkmann, J., Hennessy, G., & Hindsley, R. 2002, AJ, 123, 848
- York et al. (2000) York, D. G. et al. 2000, AJ, 120, 1579


| mr | N(SDSS)a,ba,bfootnotemark: | N(APO)a,ba,bfootnotemark: | N(Pal5)a,ca,cfootnotemark: |
|---|---|---|---|
| 20.0 | 1 | 3 | 29 |
| 20.0 - 20.5 | 1 | 1 | 8 |
| 20.5 - 21.0 | 4 | 6 | 20 |
| 21.0 - 21.5 | 4 | 5 | 53 |
| 21.5 - 22.0 | 12 | 17 | 103 |
| 22.0 - 22.5 | 9 | 16 | 114 |
| 22.5 - 23.0 | 0 | 21 | 78 |
| 23.0 - 23.5 | 0 | 31 | 81 |
| 23.5 - 24.0 | 0 | 18 | 57 aafootnotetext: The number of stars within the half-light radius, 1.75′ for SDSSJ1049+5103 and 2.9′ for Palomar 5, from Harris (1996). bbfootnotetext: These numbers only include stars that are bluer than . ccfootnotetext: These numbers have been properly corrected for field stars, and the luminosity function has been projected to 45 kpc. |