INTEGRAL/SPI Limits on Electron-Positron Annihilation Radiation from the Galactic Plane
Abstract
The center of our Galaxy is a known strong source of electron-positron 511-keV annihilation radiation. Thus far, however, there have been no reliable detections of annihilation radiation outside of the central radian of our Galaxy. One of the primary objectives of the INTEGRAL (INTErnational Gamma-RAy Astrophysics Laboratory) mission, launched in Oct. 2002, is the detailed study of this radiation. The Spectrometer on INTEGRAL (SPI) is a high resolution coded-aperture gamma-ray telescope with an unprecedented combination of sensitivity, angular resolution and energy resolution. We report results from the first 10 months of observation. During this period a significant fraction of the observing time was spent in or near the Galactic Plane. No positive annihilation flux was detected outside of the central region ) of our Galaxy. In this paper we describe the observations and data analysis methods and give limits on the 511-keV flux.
1 Introduction
Electron-positron annihilation radiation from the central region of our galaxy was first reported by balloon-borne instruments more than 30 years ago (Johnson, Harnden, & Haymes, 1972; Johnson & Haymes, 1973; Haymes et al., 1975). Since the first detection there have been many balloon and satellite observations (Leventhal, MacCallum, & Stang, 1978; Leventhal et al., 1980; Gehrels et al., 1991; Leventhal et al., 1993; Mahoney, Ling, & Wheaton, 1994; Teegarden et al., 1996; Purcell et al., 1997). Both narrow-line 511-keV and continuum positronium emission have been observed (Leventhal et al., 1980; Purcell et al., 1997; Teegarden et al., 1996; Strong et al., 2003). Early measurements (Riegler et al., 1981; Gehrels et al., 1991; Leventhal et al., 1993) suggested that the annihilation radiation was time-variable. However, more extensive later observations showed no evidence for variability (Share et al., 1988; Gehrels et al., 1991; Leventhal et al., 1993; Mahoney, Ling, & Wheaton, 1994; Teegarden et al., 1996; Purcell et al., 1997; Harris et al., 1998). The current consensus favors the latter conclusion. The most extensive results on the spatial distribution of the annihilation radiation prior to INTEGRAL came from the OSSE experiment on the Compton Gamma-Ray Observatory (CGRO). OSSE is a scintillator spectrometer with a simple collimator. Many scans were made through the central region of our Galaxy, although relatively little data was taken in the Galactic Plane outside of this region. The OSSE data were well described by a two-component bulge distribution plus a somewhat less well established disk component. One bulge model that gave a reasonable fit to the data consisted of a circularly-symmetric Gaussian of FWHM plus an elongated Gaussian with a width of in longitude and in latitude (Kinzer et al., 2001). Early OSSE papers discussed a possible positive latitude enhancement, the so-called “annihilation fountain” (Purcell et al., 1997). However, later analysis (Milne et al., 2001; Kinzer et al., 2001) found little or no evidence for such a feature.
Many different ideas have been advanced, but despite numerous observations over the past 30 years, the origin of the Galactic positrons remains a mystery. Plausible scenarios include (see Casse et al. (2004) and references therein):
Nucleosynthesis in Massive Stars: Wolf-Rayet (WR) stars are massive stars with strong stellar winds. Radioactive elements created through hydrostatic nucleosynthesis in the cores of such stars can be convected to the surface and carried into the interstellar medium (ISM) by their stellar winds. Some of the radioactive elements will undergo -decay, and the emitted positrons will annihilate in the interstellar medium long before they can escape from the Galaxy.
Type Ia Supernovae: Radioactive nuclei are created by explosive nucleosynthesis in Type Ia supernovae, some of which decay with positron emission. The positrons will annihilate either in the expanding shell or the surrounding ISM. The principle uncertainty is in the escape fraction of annihilation photons from the expanding shell.
Hypernovae: A hypernova is an asymmetric explosion of a WR star. Positrons can be efficiently transported outward by strong jets and escape into low optical depth regions where they subsequently annihilate.
Black Holes and Pulsars: Electron-positron pair production is believed to occur in black hole jets and pulsar magnetospheres.
Cosmic Ray Interactions: Cosmic rays colliding with nuclei in the ISM can produce 111 decays into which decays into positron. or excitation followed by -decay.
Dark Matter: There has been recent speculation on the possible existence of light () dark matter particles which would decay or annihilate primarily through the formation of electrons and positrons. Dark matter decay or annihilation could possibly account for the bulge component of the electron-positron annihilation radiation.
2 Observations
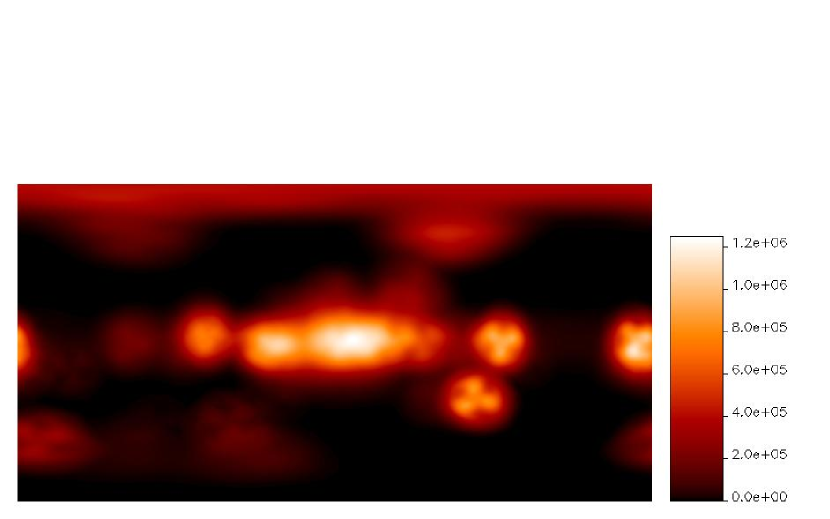
The Spectrometer on INTEGRAL (SPI) is a coded-aperture telescope using an array of 19 cooled germanium detectors for high-resolution spectroscopy (Vedrenne et al. 2003). It covers the energy range (with an energy resolution varying between keV), has an angular resolution of and a total field-of-view of FWHM. One of its primary objectives is the detailed study and mapping of diffuse gamma-ray line emission. The INTEGRAL observing program has two main parts, the Core Program, which is essentially guaranteed time for the teams of scientists who built and operate INTEGRAL, and the Open Program which comprises competitively-selected observations of guest investigators. The Core Program includes a deep exposure of the central radian of our Galaxy, repeated scans of the Galactic Plane and selected point source observations. A large fraction of the Open Program observations were in or near (within ) of the Galactic Plane. The coauthors of this paper include most of the guest investigators selected for observations within of the Galactic Plane during the first year of INTEGRAL observations. We restrict ourselves in this paper to the Galactic Plane outside of the central region (). Results from the central region have been presented in other papers (Jean et al., 2003a; Knödlseder et al., 2003; Jean et al., 2004; Knödlseder et al., 2004; Lonjou et al., 2004; Weidenspointner et al., 2004a). Fig. 1 is an exposure map of INTEGRAL observations during the period 2003 Dec to 2004 Oct. The combined data set, including Core Program, Open Program, and calibration observations amounts to 8.9 Msec exposure of the Galactic Plane of which 2.1 Msec is in the region . Solar and trapped particles can cause rapidly changing instrument background levels that can be misinterpreted as source flux. The data were carefully screened to eliminate such periods using a combination of on-board rates and data from the GOES satellites. Isolated points with large deviations that could be due to either transmission or processing errors were also removed.
3 Data Analysis
In this paper we use the so-called “light-bucket” method of analysis since we are interested mainly in broad-scale diffuse Galactic Plane emission. In this method all detectors are summed for each pointing, which suppresses the imaging information on the scale of the mask. SPI is then a light-bucket collecting all photons in its FWHM field-of-view. This mode is useful for studying diffuse emission on spatial scales and is likely to be less sensitive to systematic effects than the full imaging mode which requires an exact knowledge of the detailed properties of the coded-aperture mask and the individual detectors. We use the same Monte-Carlo-generated (GEANT) response function as is used in the imaging mode (Sturner et al., 2003), except that we sum the response over all 19 detectors. This work complements that of Knödlseder et al. (2004), which concentrates on the imaging aspects of the instrument, and provides an independent verification of some of the conclusions reached there.
SPI has a high 511-keV background level due mainly to cosmic-ray interactions in the instrument and surrounding spacecraft (Jean et al., 2003b; Weidenspointner et al., 2003; Teegarden et al., 2004). Some of these interactions make excited nuclei that undergo -decay which produces a strong 511-keV background line. The 511-keV signal-to-background ratio for observations in the central region of the Galaxy is typically only a few percent. The INTEGRAL spacecraft is in a highly eccentric orbit with an initial apogee of 155000 km and perigee of 9000 km. INTEGRAL therefore spends most of its time outside of the magnetosphere, which means that the background is relatively stable in comparison with that for a low-earth orbiting instrument (e.g. OSSE, HEAO C-1). The cosmic-ray flux typically varies by over time periods of the order of a year resulting in an instrumental background at 511 keV whose variation is of the same order or larger than the measured 511-keV flux. A precise determination of this background is therefore critical to extracting the optimum performance from SPI. In this analysis we have modeled the 511-keV background using various on-board tracers of the primary cosmic-ray intensity (Jean et al., 2003b; Lonjou et al., 2004; Teegarden et al., 2004). Two of these, the rate of saturated events in the germanium detectors (GEDSAT) and the plastic-anticoincidence rate (PSAC), have been found to be the most useful. The former samples cosmic-rays MeV and the latter MeV. We assume that far from the Galactic Plane () there is no significant 511-keV emission and use this data (3.1 Msec live time) from the first year of operation to determine the best-fit background model. If there were quasi-isotropic 511-keV emission it would be suppressed in our analysis. We calculated the total 511-keV line counting rate by integrating over a 10-keV interval centered at 511.0 keV and subtracted a continuum determined by a simple interpolation between two 10-keV windows on either side of the line. We fit this data and found that a linear combination of the GEDSAT and PSAC rates is a good background predictor, but that there is a significant long-term monotonically increasing residual in the fit.
A detailed Monte Carlo model for SPI has been implemented under the GEANT software package. An enhanced version of this package MGGPOD (Weidenspointner et al., 2004b) was used that treats gamma-ray background production in a much more extensive and complete manner. The Monte Carlo background simulations are not accurate enough to make absolute predictions of the background levels. However, they are useful in identifying the dominant isotopes for background production and their half-lives. Long half-life decays can account for the sort of residual described in the preceding paragraph. The Monte Carlo analysis identified 65Zn, a spallation product of germanium with a half-life of 244 days, as a possibly significant contributor to the 511-keV background. We included a term in the model for this decay channel and found that it significantly improved the fit although the actual value of the half-life was not well-constrained by the available data. 22Na with a 2.6 yr half-life is another possible contributor to the long-term 511-keV build-up, however its intensity in the simulation is low. The accuracy of the model 511-keV background prediction is estimated to be 0.3 %.
4 Results
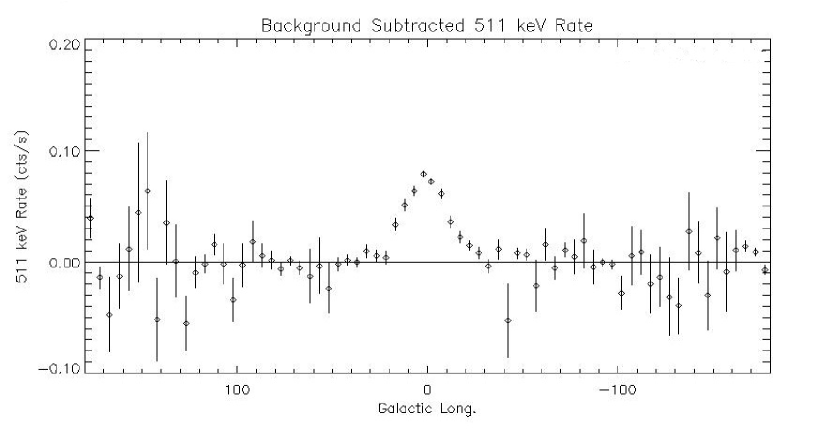
Fig. 2 is a plot of the background-subtracted SPI 511-keV counting rate in the band as a function of Galactic Longitude. A clear peak centered at is visible. The first papers of SPI results (Jean et al., 2003a; Knödlseder et al., 2003) reported that this enhanced flux region was well represented by a circularly-symmetric Gaussian with a width of . More recent work (Knödlseder et al., 2004) has found evidence for an asymmetry in the bulge with a latitude width of and longitude width of . This spatial distribution appears to be qualitatively similar to the two-component bulge plus disk description of the OSSE results (Kinzer et al., 2001). Our light-bucket analysis is not very sensitive to these differences in morphology. As a check on our method we have fit the data with a circularly-symmetric Gaussian centered at , and a fixed width of . We derive a total flux of , which is consistent with early SPI results (Jean et al. 2003a, 2004). Other authors (Share et al., 1988; Kinzer et al., 2001) have reported higher fluxes from the central region. A possible explanation for these differences is the existence of an extended emission halo to which INTEGRAL might not be sensitive. Resolution of this question must await the accumulation of more data and better coverage of regions of the sky away from the Galactic Center.
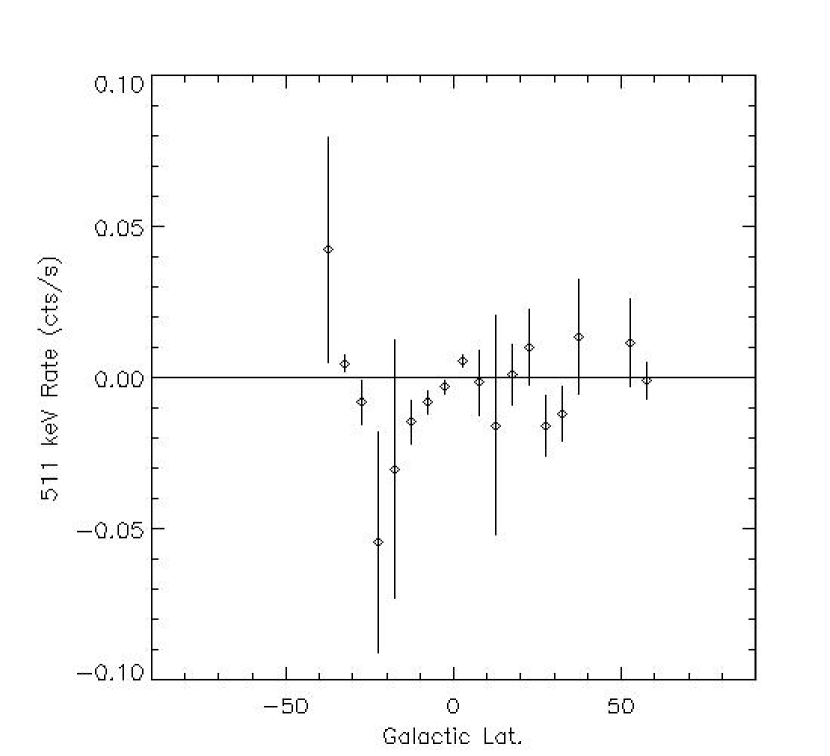
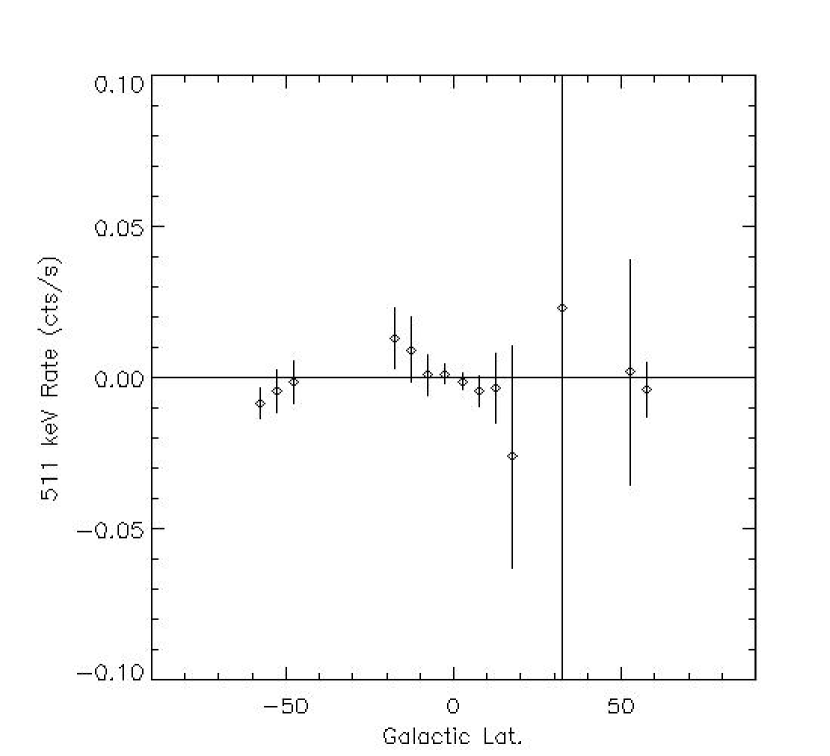
Outside of the central region there is no evidence for any significant 511-keV emission. The error bars vary widely due to the non-uniform coverage of the Galactic Plane. They are smallest in regions where the exposure is deepest, near the Crab (), Cygnus (), Vela () and Cas A (). In Fig. 3 the 511-keV counting rate is plotted as a function of Galactic latitude for two longitude regions, and . Again there is no evidence for any significant flux. Even if there were errors in our background model, we would not expect them to be correlated with the SPI pointing direction. The absence of any relative enhancement in the latitude distributions in Fig. 3 is strong evidence for the absence of detectable 511-keV emission from the Galactic Plane.
Upper limits (90 % confidence) for the 511-keV flux in the Galactic Plane are given in Table 1. The plane outside of the central region has been divided into tiles. Within each tile the SPI response to a point source anywhere in the tile has been calculated. The average value for this response was used to determine the upper limit values of Table 1. We estimate a systematic uncertainty in the flux of (due to the uncertainty of the background model) which is added in quadrature to the statistical error in calculating the upper limits. There is significant variation in the values due to the varying exposure. The lowest values () are of the order of 10 % of the total flux in the central bulge component. The lowest upper limits are at locations of high exposure where well-known sources in the Galactic Plane were observed for calibration and/or scientific study.
We have used a second method to search for large-scale 511-keV emission from the Galactic Plane . We have performed global fits to the entire data set using several source distributions. The following emissivity distributions were used:
Old Disk (Robin et al., 2003):
| (1) |
where , , ,
.
Young Disk (Robin et al., 2003):
| (2) |
where .
These emissivities were integrated along the line-of-sight to produce spatial flux distributions. For the sake of completeness we also included a flat distribution (in galactic longitude with a Gaussian latitude profile of FWHM ). The fits to these distributions all produce results that are consistent with zero 511-keV flux from the Galactic Plane (outside of the central region). The 90 %-confidence upper limits are: old disk, ; young disk, ; flat disk, .
5 Conclusions
We have analyzed data from the first 10 months of the INTEGRAL mission using the so-called “light bucket” method, which in principle is relatively less sensitive to systematic effects than the more standard imaging techniques. We have found no significant 511-keV flux from the Galactic Plane () outside of the central region (). Our method of analysis is sensitive to both point and diffuse sources. The values of the limits in tiles vary between due to large variations in the exposure in different regions of the Galactic Plane. We have also performed global fits of the entire data set which set limits on the total 511-keV flux in the Galactic Plane. These values limit the broad-scale 511-keV emission in the outer region of the Plane to of that from the central region (). Over the course of the mission (expected to last yr.) the exposure will deepen and likely become more uniform, which will lead to better and more uniform limits and, perhaps, to detections.
References
- Casse et al. (2004) Casse, M. Cordier, B., Paul, J., & Schanne, S. 2004, ApJ, 602, L17
- Gehrels et al. (1991) Gehrels, N., Barthelmy, S. D., Teegarden, B. J., Tueller, J., Leventhal, M., & MacCallum, C. J. 1991, ApJ, 375, L13
- Harris et al. (1998) Harris, M. J., Teegarden, B. J., Cline, T. L., Gehrels, N., Palmer, D. M., Ramaty, R., & Seifert, H. 1998, ApJ, 501, L55
- Haymes et al. (1975) Haymes, R. C., Walraven, G. D., Meegan, C. A., Hall, R. D., Djuth, F. T., & Shelton, D. . 1975, ApJ, 201, 593
- Jean et al. (2003a) Jean, P., et al. 2003a, A&A, 407, L55
- Jean et al. (2003b) Jean, P., et al. 2003b, A&A, 411, L107
- Jean et al. (2004) Jean, P., et al. 2004, to be published in proc. 5th INTEGRAL Symposium
- Johnson, Harnden, & Haymes (1972) Johnson, W. N., III, Harnden, F. R., & Haymes 1972, ApJ, 172, L1
- Johnson & Haymes (1973) Johnson, W. N. & Haymes, R. C., 1973, ApJ, 184, 103
- Kinzer et al. (2001) Kinzer, R. L., Milne, P. A., Kurfess, J. D., Strickman, M. S., Johnson, W. N., & Purcell, W. R. 2001, ApJ, 559, 282
- Knödlseder et al. (2003) Knödlseder, J. et al. 2003, A&A, 411, L457
- Knödlseder et al. (2004) Knödlseder, J. et al. 2004, in preparation
- Leventhal, MacCallum, & Stang (1978) Leventhal, M., MacCallum, C. J. & Stang, P. D. 1978, ApJ, 225, L11
- Leventhal et al. (1980) Leventhal, M., MacCallum, C. J., Huters, A. F., & Stang, P. D. 1980, ApJ, 240, 338
- Leventhal et al. (1982) Leventhal, M., MacCallum, C. J., Huters, A. F., & Stang, P. D. 1982, ApJ, 260, L1
- Leventhal et al. (1986) Leventhal, M., MacCallum, C. J., Huters, A. F., & Stang 1986, ApJ, 302, 459
- Leventhal et al. (1993) Leventhal, M., Barthelmy, S. D., Gehrels, N., Teegarden, B. J., & Tueller, J. 1993, ApJ, 405, L25
- Lonjou et al. (2004) Lonjou, V., et al. 2004, to be published in proc. 5th INTEGRAL Symposium
- Mahoney, Ling, & Wheaton (1994) Mahoney, W. A., Ling, J. C., & Wheaton, Wm A. 1994, ApJS, 92, 387
- Milne et al. (2001) Milne, P. A., Kurfess, J. D., Kinzer, R. L. & Leising, M. D. 2001, in AIP Conf. Proc. 587, Gamma 2001, ed. Ritz, S., Gehrels, N., & Shrader, C., (New York: AIP), 11
- Paciesas et al. (1982) Paciesas, W. S., Cline, T. L., Teegarden, B. J., Tueller, J., Durouchoux, P., & Hameury, J. M. 1982, ApJ, 260 L7
- Purcell et al. (1997) Purcell, W. R. et al. 1997, ApJ, 491, 725
- Riegler et al. (1981) Riegler, G. R., Ling, J. C., Mahoney, W. A., Wheaton, W. A., Willet, J. B., Jacobson, A. S., & Prince, T. A. 1981, ApJ, 248, L13
- Robin et al. (2003) Robin, A. C., Reyle, C., Derriere, S., & Picaud, S. 2003, A&A, 409, 523
- Share et al. (1988)
- Strong et al. (2003) Strong, A., et al. 2003, A&A, 411, L447
- Sturner et al. (2003) Sturner et al. 2003, A&A, 407, L81
- Teegarden et al. (1996) Teegarden, B. J., Cline, T. L., Gehrels, N., Palmer, D. M., Ramaty, R., & Seifert, H. 1996, ApJ, 463, L75
- Teegarden et al. (2004) Teegarden, et al. 2004, to be published in proc. 5th INTEGRAL Symposium
- Weidenspointner et al. (2003) Weidenspointner, G. et al. 2003, A&A, 411, L113
- Weidenspointner et al. (2004a) Weidenspointner, G. et al. 2004a, to be published in proc. 5th INTEGRAL Symposium
- Weidenspointner et al. (2004b) Weidenspointner, G. et al. 2004b, ApJSin press
- Vedrenne et al. (2003) Vedrenne, G. et al. 2003, A&A, 411, L63
| l/b | -175 | -165 | -155 | -145 | -135 | -125 | -115 | -105 | -95 | -85 | -75 | -65 | -55 | -45 |
|---|---|---|---|---|---|---|---|---|---|---|---|---|---|---|
| -15 | 1.31 | 1.51 | 2.89 | 8.05 | 8.55 | 9.49 | 4.45 | 2.38 | 1.82 | 1.81 | 2.07 | 2.12 | 2.21 | 2.58 |
| -5 | 1.17 | 1.36 | 2.53 | 3.42 | 3.71 | 3.42 | 2.35 | 1.41 | 1.12 | 1.29 | 1.98 | 2.51 | 2.14 | 1.91 |
| 5 | 1.62 | 2.10 | 4.03 | 3.54 | 3.46 | 3.17 | 2.66 | 1.32 | 1.13 | 1.24 | 2.53 | 2.79 | 2.12 | 2.00 |
| 15 | 5.11 | 5.79 | 11.63 | 9.02 | 7.23 | 6.73 | 6.30 | 3.47 | 1.82 | 3.75 | 8.17 | 5.37 | 2.74 | 2.17 |
| l/b | 45 | 55 | 65 | 75 | 85 | 95 | 105 | 115 | 125 | 135 | 145 | 155 | 165 | 175 |
|---|---|---|---|---|---|---|---|---|---|---|---|---|---|---|
| -15 | 1.97 | 5.13 | 5.98 | 4.68 | 4.45 | 4.64 | 5.39 | 4.33 | 5.51 | 6.46 | 4.64 | 4.11 | 2.86 | 1.48 |
| -5 | 1.20 | 1.52 | 1.44 | 1.26 | 1.75 | 2.02 | 2.32 | 1.89 | 1.89 | 3.00 | 4.32 | 3.46 | 2.07 | 1.33 |
| 5 | 1.18 | 1.37 | 1.21 | 1.14 | 1.39 | 2.07 | 2.37 | 2.05 | 1.94 | 3.54 | 5.31 | 4.44 | 3.28 | 1.92 |
| 15 | 2.34 | 3.22 | 1.64 | 1.38 | 1.95 | 4.31 | 5.43 | 4.74 | 4.68 | 10.44 | 18.55 | 11.35 | 6.20 | 6.59 |
.
Note. — Upper limits are 90 % confidence values in tiles centered on the given l,b values. Flux units are