A Deep Radio Survey of Abell 2125 II.
Accelerated Galaxy Evolution during a Cluster-Cluster Merger
Abstract
Using our extensive radio, optical, near-IR and X-ray imaging and spectroscopy, we consider the reason for the unusually large number of radio detected galaxies, mostly found outside the cluster core, in Abell 2125(, richness class 4). With 20-cm VLA data, we detect continuum emission from 90 cluster members. The multiwavelength properties of these galaxies suggest that most of the radio emission is due to an enhanced star-formation rate. The dynamical study of Miller et al. (2004) suggests that Abell 2125 is undergoing a major cluster-cluster merger, with our view within 30 degrees of the merger axis and within 0.2 Gyr of core passage. The combination of projection effects and the physical processes at work during this special time in the cluster’s evolution seem likely to be responsible for the unusual level of activity we see in the cluster. We argue that tidal effects on individual cluster members, often far from the cluster core, are responsible for the increased star formation. Our results are consistent with the idea that disk galaxies during this phase of a cluster’s evolution undergo rapid evolution, through a burst of star formation, on their way to becoming S0’s.
1 Introduction
With the recent convergence of supernova and CMB research to a remarkable consensus on the geometrical parameters of the universe, understanding the evolution of galaxies with cosmological epoch is, perhaps, the major goal of extragalactic astronomical research. From the morphology-density relation and the Butcher-Oemler effect, it is clear that the large-scale process of cluster formation must be a key part of the picture. But understanding galaxy evolution may be more difficult than geometric cosmology because of the complex role of dissipational processes, and the confusing results of observing two-dimensional projections of three dimensional physical objects (e.g. galaxies and clusters alike). Using as large a range of wavelengths as possible is one way to improve our understanding of what we are seeing. In this paper, we describe a study, using radio, optical, near-IR and X-ray imaging and spectroscopy, to try to understand how a very rich, very radio-active cluster, Abell 2125, fits into the bigger picture.
We began our study of the Abell 2125 field with moderately deep 20cm VLA C-array observations (Dwarakanath & Owen, 1999; Owen et al., 1999). We compared Abell 2125 (a richness class 4, blue cluster at ) with Abell 2645 (an apparently similar cluster at the same redshift but with much redder galaxies). We found a much higher detection rate of radio galaxies (27 vs 4) in Abell 2125, while the detection rate in A2645 is consistent with a normal AGN population in a lower redshift cluster. The excess in Abell 2125 occurs entirely in objects with W Hz-1, and thus seems consistent with a star-forming population (e.g. Condon, Cotton & Broderick, 2002). However, only a small fraction of these radio-selected galaxies shows optical evidence of so much star formation, leaving the interpretation of the radio results in some doubt. Either the star formation in most of the low-luminosity radio sources is very well hidden at optical wavelengths, or we must seek some other explanation for the radio activity.
Closer examination of the optical and X-ray properties of Abell 2125 shows that it is not a typical, very rich Abell cluster. The galaxy distribution shows a central concentration together with an extension to the southwest, spanning at least 2 Mpc. X-ray observations (Wang, Connolly, & Brunner, 1997) show the same pattern, and that the total X-ray luminosity is low for such a rich cluster. Wang, Connolly, & Brunner (1997) suggested that we might be seeing diffuse X-ray emission from a superstructure, as is seen in many cosmological simulations of large scale structure formation. Much of the excess radio-emitting galaxy population from Owen et al. (1999), like the diffuse X-ray emission, is contained in the southwest extension, not the cluster core. These factors suggest that the unusual galaxy population, especially as seen at radio frequencies, might be connected to the large-scale nature of Abell 2125 itself.
To study this cluster further, we have made much deeper and higher resolution radio observations using all four VLA configurations. These deep radio data have also motivated deep optical and NIR imaging, optical spectroscopy, deep submillimeter observations, and a long Chandra exposure. While some of these ancillary observations were motivated by possibility of studying a background sample, we consider here what they tell us about Abell 2125.
Paper I (Owen et al, 2004a) described our radio, optical and NIR observational program to study the region of the sky centered on Abell 2125. In this paper, we now discuss the properties of the cluster members, particularly in light of the unusually large number of radio detections from cluster’s members. Physical quantities are calculated using a WMAP CDM cosmology with =71 km s-1 Mpc-1, and .
2 Observations
2.1 Ground-based and X-ray Imaging and Spectroscopy
Most of the observations and reductions have been described elsewhere. The radio, optical and near IR imaging and reduction is described in paper I (Owen et al, 2004a). The optical spectroscopy is discussed in (Miller et al., 2004). The Chandra imaging, reductions and basic results are presented in (Wang, Owen & Ledlow, 2004).
2.2 HST Imaging
We observed three fields in Abell 2125 with HST and WFPC2, centered to maximize the number of radio-detected members within the fields without imposing tight orientation constraints. One field is just west of the cluster core, with the other two spanning the clump of bright galaxies 5’ SW of the center. Each of these latter two fields was observed twice; for the southwest field, at significantly different orientation angles, and for the southern field, at pointings differing by about 10 arcseconds. Both F606W and F814W filters were used, corresponding roughly to the emitted and bands at . Each filter was used for an exposure of 2600 seconds per observation, split into two equal parts for cosmic-ray rejection.
Several of the images were taken at small angles to the illuminated limb of the Earth, and suffered from scattered Earthlight. This produces a diagonal X pattern of brighter regions. These were removed following the same basic precepts as used for the original Hubble Deep Field data (Williams et al., 1996). Where multiple pointings with similar scattering properties were available, they were combined to reject actual objects, then scaled to a common scattering intensity and smoothed. This scattering model was applied, with appropriate scaling, to all the affected images. Since this procedure does not necessarily preserve mean sky brightness as it affects photometric errors, nor impose a consistent sky level across the various CCD fields, we added a constant value to give the same level for all chips.
3 Results
In Table 1, we present our basic observational results for spectroscopically confirmed, radio detected members of Abell 2125. In column 1 we list radio source name; columns 2 and 3 contain the optical R.A. and Declination (2000.0) corresponding to the galaxy (for members identified with radio emission detected at above the noise). Column 4 contains the distance in arcmin from the nominal cluster center [15 41 15, 66 16 00] (Owen et al., 1999). In columns 5 and 6, we list the peak and total flux density for each radio source in Jy. Column 7 contains the size (or a limit) in arcsec. If the source is resolved and fitted with a two dimensional Gaussian, we give the deconvolved major axis size (FWHM), the minor axis size and the position angle. If only a size is given, this value has been estimated from the image by hand. Column 8 lists our best measured value for the redshift; an “e” indicates that emission lines were present in the spectrum (Miller et al., 2004).
3.1 Photometric Analysis
We have quantified the spectral energy distribution ,SED, of each radio galaxy, using the publicly-available program hyperz (Bolzonella, Miralles, & Pelló, 2000) to fit template spectra. We measured optical magnitudes for each of our 10 bands from U to K in the Gunn-Oke aperture (radius 13.1 kpc). In table 3, we give AB magnitudes used for the hyperz results quoted. -9.00 in table 3 indicates no measurement was available. Then hyperz was used, with the redshift range constrained to fall within the cluster range in light of the spectroscopic redshifts, to fit the Bruzual-Charlot models provided with the program (GISSEL98; Bruzual & Charlot, 1993) with a Calzetti extinction law (Calzetti et al., 2000) and with a total age less than the age of the universe at , about Gyr. The result yields a spectroscopic “galaxy type”, an age for the dominant star-forming event, an extinction for the Calzetti law, and a rest-frame, R absolute magnitude. In table 2, we summarize the model star-formation histories used. The galaxy type is based on an assumed -folding timescale for the star formation. This timescale, combined with the age assigned to each template, determines each SED in the catalog. For ages which are a significant fraction of a Hubble time, templates for different galaxy types may not differ very much. It is not clear that the galaxy type assigned to each -folding timescale is closely correlated with the galaxy morphology. Finally, the galaxy ages are a (luminosity-weighted) global estimate for the stars in the aperture and may not reflect the age of the star-formation event which we are observing in the radio. Thus we prefer to look on the types as a way of parameterizing the catalog with a useful range of assumed star-formation histories. The dominant parameter in a template is the age of the assumed stellar population, especially for ages of a Gyr or less. The extinction is a useful dimension to explore and seems generally correlated with star-formation, although derived age and extinction are somewhat anti-correlated. The absolute magnitude should be robust, since we are essentially using hyperz to interpolate between our measured magnitudes using the best fitting SED.
3.2 Emission Lines
Another important clue to the nature of radio population is the detection (or lack) of emission lines. Our spectroscopy comes from several different observing runs with different wavelength ranges covered. Thus we cannot report a common set of emission lines. However, in almost all cases, we detect [OII] and/or H/[NII]. Often [OIII], H and [SII] are detected. As reported in Miller et al. (2004), almost all the galaxies with detected emission lines have line ratios indicating that they are powered by star formation. Of course, for very powerful AGNs, one expects to see a rich spectrum of broad and/or narrow lines. However, at the radio luminosities and redshift we are dealing with, one rarely can detect emission lines in contrast against the stellar continuum (Owen, Ledlow, & Keel, 1995). Thus for the relatively low-luminosity radio objects we are observing, the lack of detected emission lines together with detected radio emission is consistent with (weak) AGN activity. However, the lack of emission lines can also be consistent with significant star formation if dust obscures the line emission (Miller & Owen, 2002). Thus when we see line emission in these systems, that result normally indicates star-formation activity as the origin of the radio emission. However, for the galaxies in which we do not detect line emission, the situation is less clear.
3.3 Physical Parameters
In table 4 we summarize the physical parameters for each galaxy with radio emission. All values have been calculated assuming a redshift of 0.2465 (Miller et al., 2004). Column 1 contains the source name; column 2, the largest linear size; column 3, the absolute radio luminosity; column 4, the projected distance from the cluster center; column 5, the absolute, rest frame R magnitude, column 6, 7 and 8, the hyperz results: spectral type (table 2), age and , and column 9, the spectroscopic redshift. Once again an ”e” appended to the redshift indicates emission lines are detected.
3.4 Chandra Detections of Cluster Members
Compact X-ray sources in galaxies are usually associated with active galactic nuclei (AGN). Our Chandra data for Abell 2125 reach flux levels at which star-forming galaxies can also be detected (Ranalli, Comastri, & Setti, 2003). On the other hand, detection of X-ray emission on larger scales than galaxies is usually associated with free-free emission from the hot cluster medium. Thus one major goal of the Chandra observation was to use X-ray detections of compact emission from the individual galaxies with radio emission to recognize AGN. If a large fraction of the radio activity was driven by AGN, even in emission-line galaxies, we might expect to detect a large fraction of the radio-emitting cluster members. The Chandra observation shows 99 discrete sources, as detailed in Wang, Owen & Ledlow (2004).
Eight radio-detected galaxies in Abell 2125 also host point-like X-ray sources independently detected from the Chandra observation (table 5). One of these sources, 00047 (also called C153) shows unique extended structure on close inspection, as discussed in detail in our paper on the cluster core (Owen et al, 2004b). However, the low background level of the Chandra detectors allows deeper detections of sources if the positions are independently and accurately known; using the optical positions to fix locations of potential X-ray sources yields an additional twelve X-ray detections with probabilities of being random events. The true probability of these weaker detections being spurious was further evaluated by shuffling the coordinates of the galaxies and repeating the search. These tests indicated that detections could be expected by chance for the entire radio galaxy sample from this procedure. The errors on the fluxes are large for these detections and there is a statistical bias to overestimate the fluxes by as much as a factor of two (Wang, 2004). Thus the luminosities quoted should be taken only as very rough estimates. These additional 12 faint X-ray detections are listed in table 6. Once again one of the radio detections (00057) is clearly extended in X-ray emission, associated with one of members of the central triple in the cluster core (although it is not detected by the point source detection algorithm used by Wang (2004)). This galaxy is also discussed in Owen et al (2004b).
In table 7 we list two other cluster members which are associated X-ray sources reported by Wang, Owen & Ledlow (2004). Neither of these galaxies has detected emission lines. However, one (X072) also has a marginal radio detection, with a peak between 3–4 on the radio image. The other source (X064), associated with a cD-like galaxy, is also extended and soft.
The new X-ray analysis brings the detected fraction among radio-selected cluster members to 20/73, within the region covered by the Chandra image. Excluding the very extended sources in the cluster core, all the detections by Wang, Owen & Ledlow (2004) are associated with relatively bright galaxies () without emission lines. Three of the weaker X-ray objects from table 6 also lack emission lines and only one is fainter than (i.e. ). All of these objects seem consistent with AGN. Furthermore, the X-ray morphology of five of the additional, weaker objects associated with emission lines (and one without emission lines) are not clearly point-like (at 6 arcsec or 23 kpc resolution); therefore these X-ray sources are large with respect to the galaxy scale and these galaxies may simply be confused with a local peak in the extended X-ray emission. Thus it is hard to evaluate the origin of the the X-ray detections for these objects. Only three of the weaker galaxies with emission lines do appear point-like. These objects (00022, 00026 and 00027) are associated with relatively radio-luminous objects consistent with star formation. The X-ray luminosities of these objects also are consistent with star formation at the same general level as implied by the radio emission within the errors (Ranalli, Comastri, & Setti, 2003).
In summary, 53/73 radio-detected galaxies in the Chandra field are not detected in X-rays. Ten of the X-ray-detected objects are consistent in optical, radio, and X-ray properties with AGN. Three others are most consistent with star formation strong enough for X-ray detection. The rest are either associated with diffuse emission, or are too weak and/or in regions too complex to characterize clearly. Thus the Chandra data do not suggest that the bulk of the radio activity is due to AGN.
3.5 Radio Luminosity/Morphology
Statistically, W Hz-1 is the approximate crossing point of the luminosity functions of radio galaxies driven by AGN and star formation. Above W Hz-1 AGN dominate, below W Hz-1 star-forming galaxies dominate (Condon, Cotton & Broderick, 2002). In rich clusters, where there are more early-type galaxies, the log of the crossover luminosity is nearer 22.8 (Miller & Owen, 2002). However there are, of course, objects above and below the crossover luminosity driven by the non-prevailing mechanism. Thus radio luminosity is a statistical indicator of AGN or star-formation-driven radio emission.
Radio morphology is another important indicator. Clear, FR I or FR II morphology is a clear AGN indicator. Most of the sources with radio luminosities above W Hz-1 in A2125 show clear FR I or FR II morphology (Dwarakanath & Owen, 1999).
3.6 Radio/Optical Alignment
Beyond source luminosity, another important indicator that radio emission is driven by star formation is alignment of radio emission with the major axis of a galaxy. While star formation in some systems is too concentrated in the galaxy core to resolve at our 1.5” (5.7 kpc) limit, extended and aligned radio emission is a strong clue that the emission is driven by star formation.
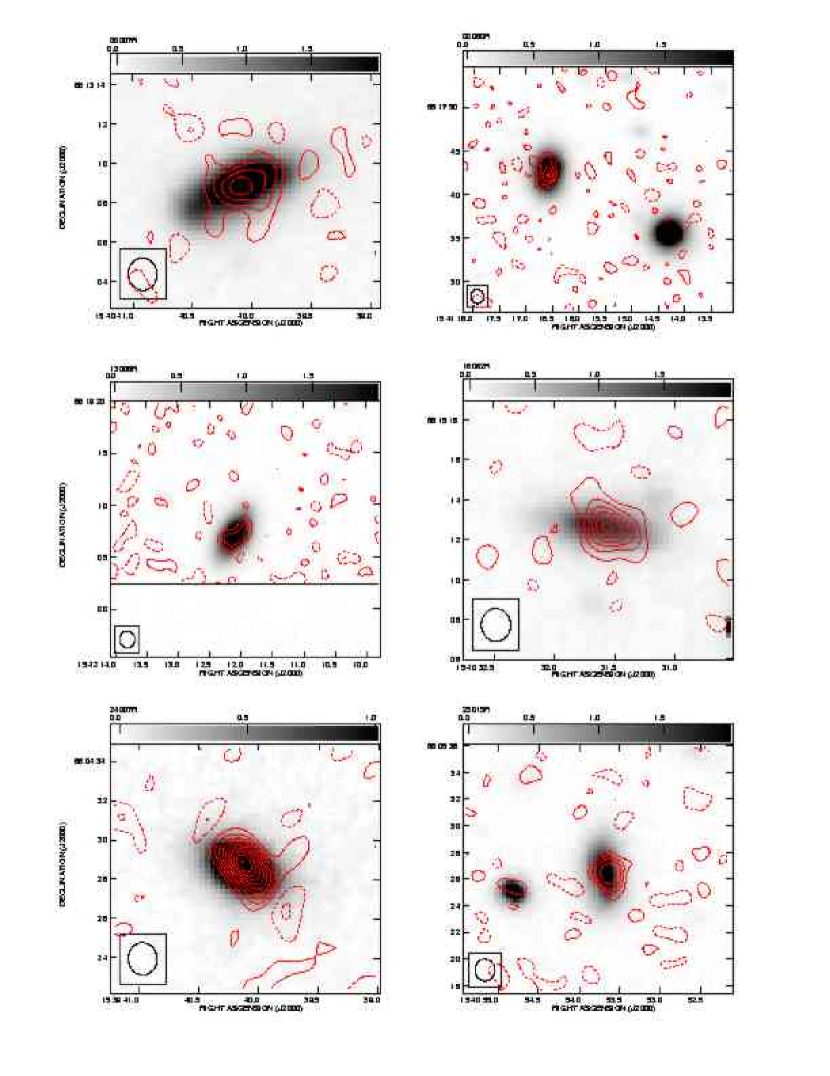
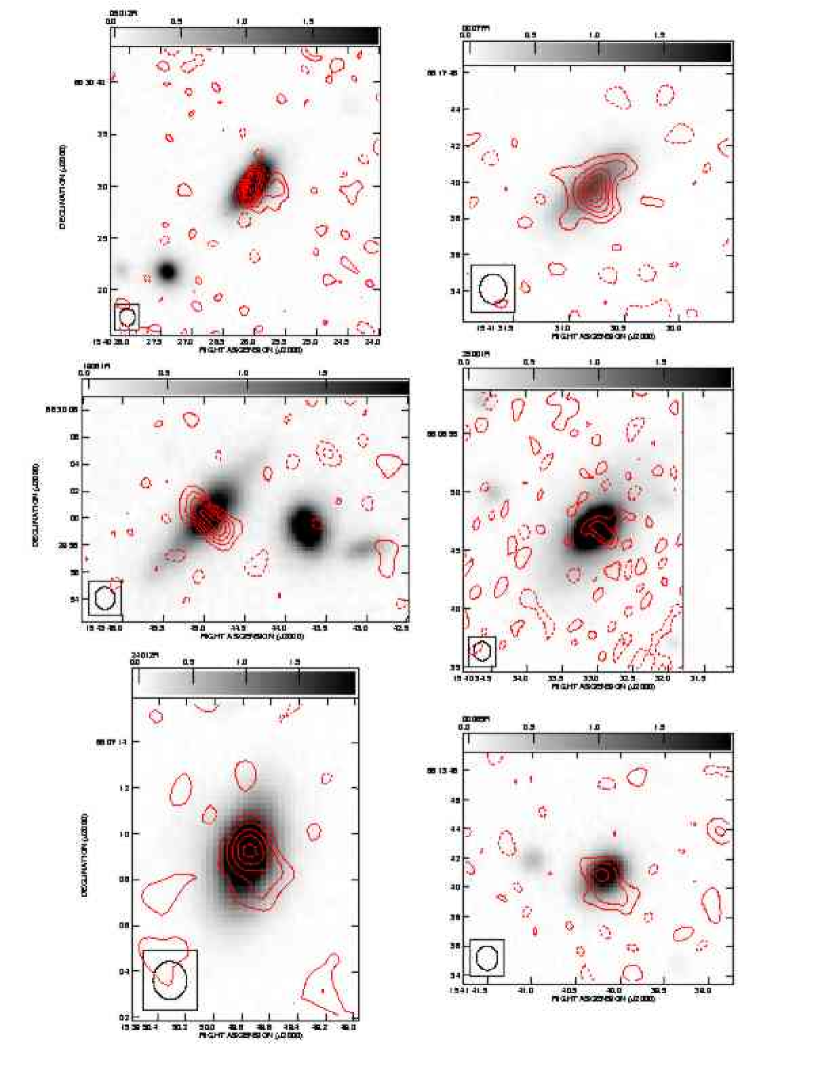
A large fraction of the lower-luminosity sources show alignment between the radio and optical structures. In figure 1 we show radio contour maps overlaid on the MOSAIC R-band optical images as examples of the aligned structures. However, some of the radio cluster members show other features which are not aligned. In many cases, both aligned and misaligned radio structure can be seen. In some cases only misaligned structures are seen. In figure 2 we show some of these misaligned features. Some of the misaligned radio features could represent outflows directed along the minor axis, either the jets of AGN, or starburst-driven winds (Colbert et al., 1996). In some cases, these features could be evidence of on-going stripping of the galaxy’s ISM as it moves relative to the external medium.
3.7 Concentration Indices
Optical morphology is another important clue to understanding what we are seeing in galaxies. However, except in the small regions imaged with HST, the resolution of our optical imaging, is too low for detailed classification. We therefore quantify the morphological types spanned by the radio galaxy sample using concentration indices measured for 81/90 of the sources. No reliable measures were obtained for the other 9 galaxies due to the proximity of brighter companions or very bright stars.
We measure the concentration index (similar to a bulge-to-disk ratio), defined as the ratio of the flux between inner and outer isophotes, where the outer isophote is measured to 24.75 magnitudes arcsec-2 in the rest-frame of the galaxy. The inner isophote is normalized to 0.3 times the radius of the outer isophote. While our imaging is sufficiently deep to extend to fainter limiting surface-brightness (Abraham et al. (1994) used 25.5 mag arcsec-2), the majority of the radio galaxies in A2125 are in high galaxy-density regions, many with close companions, making it difficult to separate overlapping isophotes. The 24.75 mag arcsec-2 limit was a compromise which allowed us, with masking, to fit nearly all the galaxies to a uniform depth. The difference in CI measure with different surface-brightness limits is fairly small (of order 0.02-0.03), which is an estimate of the typical error bars.
In figure 3 we plot the concentration index versus mean surface-brightness for 81 cluster radio galaxies. The upper dotted line shows the expected location of galaxies with laws, while exponential disks are plotted with a solid line. There is clearly a spread in values, with a substantial (30/81, 37%) fraction falling intermediate between bulge and disk-dominated profiles, as would be characteristic of an S0 classification. The open circles in figure 3 indicate objects in which the SFI, discussed in the next section, suggests little or no evidence of star-formation based on a number of indicators. The solid symbols indicate some evidence of star formation based on SFI. Clearly most of the objects near the law line are consistent with old stellar populations while most of the points below this line show some evidence for star formation.
3.8 Star formation or AGN ?
One of the major questions raised by the galaxy population in Abell 2125 is whether the excess radio emission is due to star-formation or nuclear activity. As discussed in section 3.4, the X-ray results, perhaps the most robust single tracer of AGN. show that less than 15% of the radio sample appear to be AGN. As discussed in Owen et al. (1999), for cluster of this richness, there is no excess in the radio-galaxy population above W Hz-1 where radio AGN normally dominate. However, many of the optical identifications below W Hz-1 do not show the obvious colors and emission lines one might expect from star-bursting galaxies. For galaxies at the distance of Abell 2125, mainly observed from the ground, any given star-formation indicator may or may not be detectable depending on the details of an individual galaxy’s properties. With the relatively coarse spatial sampling used for optical imaging and spectroscopy, much of the light from a massive galaxy may come from its old stellar population. The orientation and dust content will also affect the emission line equivalent widths and the effective age of the SED. For systems close to edge-on, the radio emission from star formation is expected to align with the galaxy disk, if it is resolved. But for a face-on system, this alignment is harder to detect. In practice, we need to look at several different indicators to understand the likely origin of the radio emission.
With our new dataset, much larger than used in Owen et al. (1999), we can look for evidence of star formation in several different ways. Indicators we can use include: 1) radio luminosity, 2) radio alignment with optical galaxy major axis, 3) optical emission-lines, 4) optical/NIR SED, 5) dust required by the best fit SED, 6) absolute R-magnitude. We calculate a weighted “star-formation index” (SFI) for each galaxy to give us an overall indication of the likelihood of star formation being responsible for the radio emission. Some indicators seem better than others, so we will assign weights of 0.5 or 1.0 for each of the six properties depending on how good the evidence seems to be. Radio alignment and emission lines seem to be particularly good indicators, so each of these is worth 1.0 in our scheme. Radio luminosity is only a statistical indicator and in clusters, is really only a strong one when , so we add 0.5 in this case. Likewise, Ledlow & Owen (1996) and Miller (2001) show that AGN in clusters are rarely if ever more than one magnitude fainter than . This limit corresponds to for our magnitude system. We will add 0.5 to the score for fainter than . Likewise most AGN are associated with old stellar populations and even strongly star-forming galaxies can appear to have relatively old SEDs. Thus we will add 0.5 to the score if the age of the best fit SED is Gyrs and 1.0 if it is Gyr. Finally, dust correlates with star formation. We will add 0.5 for an and 1.0 for . Thus the maximum score in this system is 5.0.
Table 8 summarizes the SFI scores for the 90 galaxies with radio detections. Only one galaxy has a perfect 5.0 rating, while 21/90 have SFI . These seem likely to be AGN. Fifteen have intermediate SFI of 1 or 1.5. These systems are consistent with star-formation but are not as certain as galaxies with higher SFI. The 54 with SFI of 2 or more and seem likely to have radio emission driven by star formation. This comparison of multiwavelength indicators suggests that most of the excess activity in Abell 2125 is driven by star formation.
In figure 4, we plot of the radio luminosity versus the absolute R magnitude. The solid symbols show which galaxies had detectable line emission; the squares show which galaxies had aligned radio and optical emission. We believe these two indicators are the best for signifying star formation. Figure 4 suggests a break point in the galaxy properties at . No galaxies brighter than show evidence of star formation, while most of the galaxies fainter than this show emission lines and/or radio alignment. Several of the remaining objects fainter than also show dusty SEDs suggesting that we may be losing the emission-line spectra to dust extinction.
In figure 5 we show histograms of the radio linear size distributions for the aligned sources (left panel) and the sources with radio emission without clear alignment (right panel, in which upper limits are shown in black). Most of the emission-line objects which show alignment (left panel) have rather extended radio emission, much larger than the galaxy core. Thus we seem to be seeing extensive star formation throughout disks of most of these systems. Most of the emission-line galaxies without clear alignment (right panel) have a much smaller radio extent. Over half only have upper limits to the radio size. These latter objects appear to be consistent with more compact star-formation events. All these objects seem to be consistent with star formation as the origin of the radio emission.
Thus there is a strong tendency for the optically and radio fainter galaxies to be consistent with star formation as the origin of the radio emission. Also, by number, most of the radio-emitting galaxies we have detected are most consistent with star formation, but almost all galaxies more than 30% brighter than are consistent with AGN activity.
In figure 6 we show the histogram for all the absolute radio luminosities. The black boxes indicate objects with brighter than . In figure 6 one can see the lower cutoff in 20cm radio luminosity, , at 21.6 and the peak in detections near 22.3. Also one can see the tendency for the optically brighter galaxies to dominate the sample above , where one would expect AGNs to dominate as discussed earlier. The drop-off in numbers at faint levels probably combines several effects. First, away from the field center the sensitivity drops off. Second, extended sources at near the point source limit will be missed. Third, a few faint objects with fainter optical IDs still do not have redshifts and could be cluster members. Thus it seems premature to conclude the the true radio detection rate in the cluster peaks at . A deeper radio survey would likely detect many more star-forming systems and there is a large population with emission lines in Miller et al. (2004) which have not yet been detected in the radio.
To estimate a SFR implied by the radio luminosities, we can use the calibration of Yun, Reddy, & Condon (2001), who used the radio-FIR correlation to estimate the radio-SFR relation. Yun, Reddy, & Condon (2001) estimate the SFR assuming a Salpeter IMF down to 0.1 M⊙. In order to include only star formation above 5 M⊙, we scale their relation by 0.18, and, corrected to our assumed cosmology, the result is
| (1) |
Thus our peak near , corresponds to about a SFR of about 2 M⊙yr-1 (or 11 M⊙yr-1 for a Salpeter IMF down to 0.1 M⊙). Mostly these galaxies appear to exhibit relatively modest rates of star-formation.
As discussed earlier, while most of the X-ray detections are most consistent with AGN or diffuse X-ray emission in the local area surrounding the detections, three of the radio galaxies have weak point-like X-ray emission. Ranalli, Comastri, & Setti (2003) have shown that the X-ray luminosity in star-forming galaxies also correlates with the SFR. Converting their results to our cosmology and to the 0.5-8 keV band, assuming a photon number index of 2 (Wang, Owen & Ledlow, 2004), we get
| (2) |
From equation 1 and the data on the only three radio detected galaxies in table 6, one gets radio SFR estimates of 3.2, 3.5 and 5.2 for 00022, 00026 and 00027, respectively. From equation 2 the estimates from the detected X-rays for the same three objects are 6.3, 14 and 14 , respectively. Given that the X-ray measurements are biased high, that we are just marginally able to detect the X-rays from the galaxies with the highest SFR’s and that there is significant scatter in the radio/X-ray correlation (Ranalli, Comastri, & Setti, 2003), the agreement in the SFR estimates from both bands is consistent with a star-formation origin to both the radio and X-ray emission for these three objects.
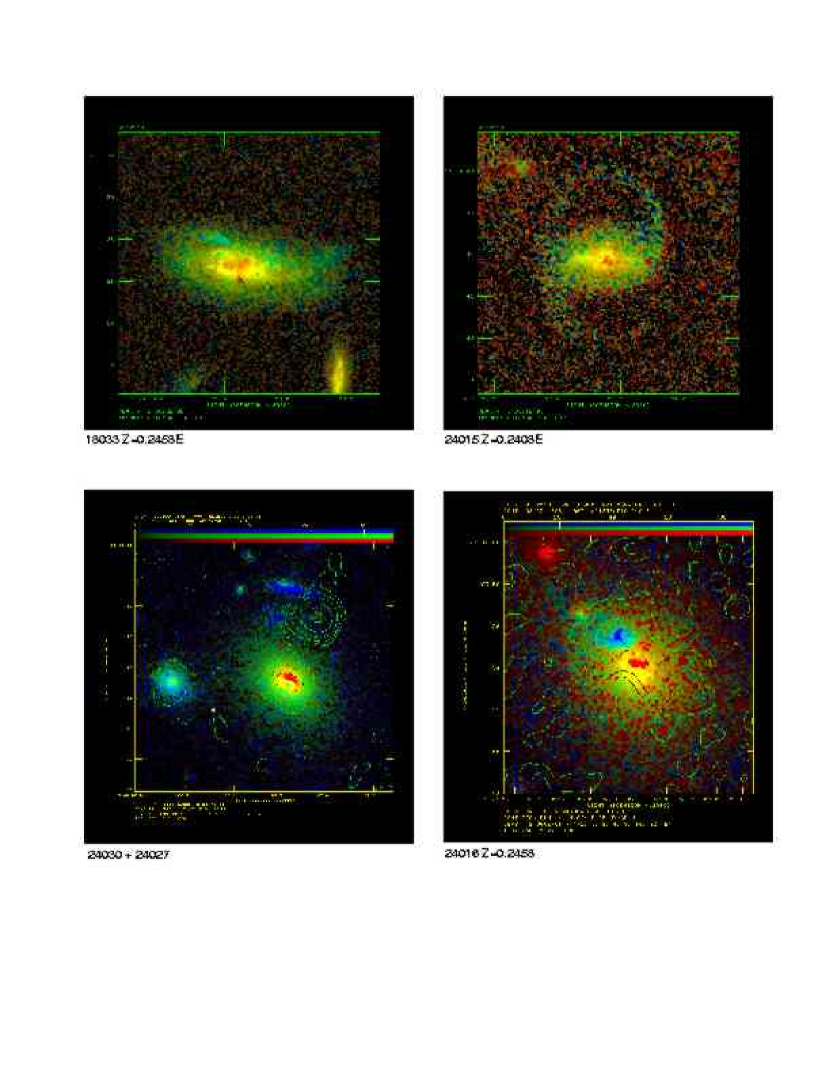
3.9 HST Images of Radio Galaxies
Figure 7 shows images of radio galaxies from the HST observations. The images are true color in the sense that red represents redder light and blue bluer light from our V and I images. In the bottom two cases, we overlay the contours of radio emission. These galaxies give some insight into what the ground-based observations are telling us about the population as a whole.
Object 18033 has an SED which hyperz fits with an old Sb. The HST morphology fits with this Hubble type. The galaxy has emission lines and aligned radio emission. It has a radio SFR of about 6 M⊙yr-1. The size of the radio source is only about 8 kpc (2 arcsec), about the size of the redder region in the galaxy core, which may indicate dust obscuration of much of the star-forming region.
Galaxy 24015 is best fit by an “elliptical” SED but with an age of only 4.5 Gyr. However, the region fitted by hyperz is interior to the the spiral arms seen with HST. The radio emission is aligned and consistent with a star-formation rate of 2 M⊙yr-1.
Galaxy 24030 (on the east side of image) is also fit by a young “elliptical” SED but shows all the other indications of star-formation at a modest rate. A close look at the HST image suggests spiral structure.
Object 24027 (in the center of the image) is fit by a burst model of the same age as 24030 (4.5 Gyr). It shows little evidence for star formation except for an of 0.6. The HST image has a red core also suggesting dust obscuration. The radio source to the north and west of 24027 appears to be unrelated since it is coincident with a very faint object on the HST image; there is a faint Chandra source at that position.
Object 24016 has an SED best fit by an old “S0” with some dust. This is consistent with the red core and the lack of emission lines. However, the radio emission appears quite extended and the NE lobe of the radio source is coincident with a very blue object. This blue object also shows strong [O II] emission in our narrow-band image. Since this object is outside the region covered by the optical spectroscopy it is hard to guess what is going on here, whether a superposition of an unrelated late-type galaxy or some sort of jet-induced star formation. This main galaxy is still most consistent with an old stellar population and AGN, but would require more study to understand the pattern we see.
Overall, the HST imaging supports the conclusions drawn from the ground-based observations. However, the galaxy types provided by hyperz through the Bruzual-Charlot templates, need to be taken with a grain of salt and only used as a general guide to the nature of each galaxy in the region covered by the aperture used for the photometry. Many of the objects do show morphological evidence for dusty cores as well as from the SED fitting.
3.10 Location of Activity in the Cluster
One of the important clues to understanding Abell 2125 is the location of the radio galaxies with respect to the nominal cluster core and the diffuse X-ray emission. In figure 8 we show the histogram of the projected distance from the nominal cluster center for the radio cluster members. The black boxes indicate sources for which , the most likely AGN. Clearly most of the radio emitters are fairly far from the cluster core, compared with the core radius from Chandra of kpc (Wang, Owen & Ledlow, 2004).
Three of the radio luminous objects are associated with the triple system in the center of the cluster core and have SFI=0. Excluding these objects, both the likely AGN and the entire sample have median projected distances from the cluster core of Mpc. Thus most of the radio detections, AGN and star-forming galaxies alike, lie far outside the cluster core.
Wang, Owen & Ledlow (2004) present the X-ray results for imaging of the diffuse structure in Abell 2125. The diffuse X-ray structure of Abell 2125 gives a picture of a relatively cool, moderately low luminosity system, erg s-1. The main cluster concentration has a temperature near 3 keV, while the more diffuse structures to the SW have keV. From Wang, Owen & Ledlow (2004) one can see that this extremely optically rich cluster (R=4) is not a particularly impressive X-ray cluster. Its luminosity, temperature and density are more like a much lower-richness cluster. Furthermore, the lower surface brightness regions outside the bright core are significantly cooler. The full size of the X-ray emitting region is at least Mpc in projection, centered SW of the core by about 1.2 Mpc.
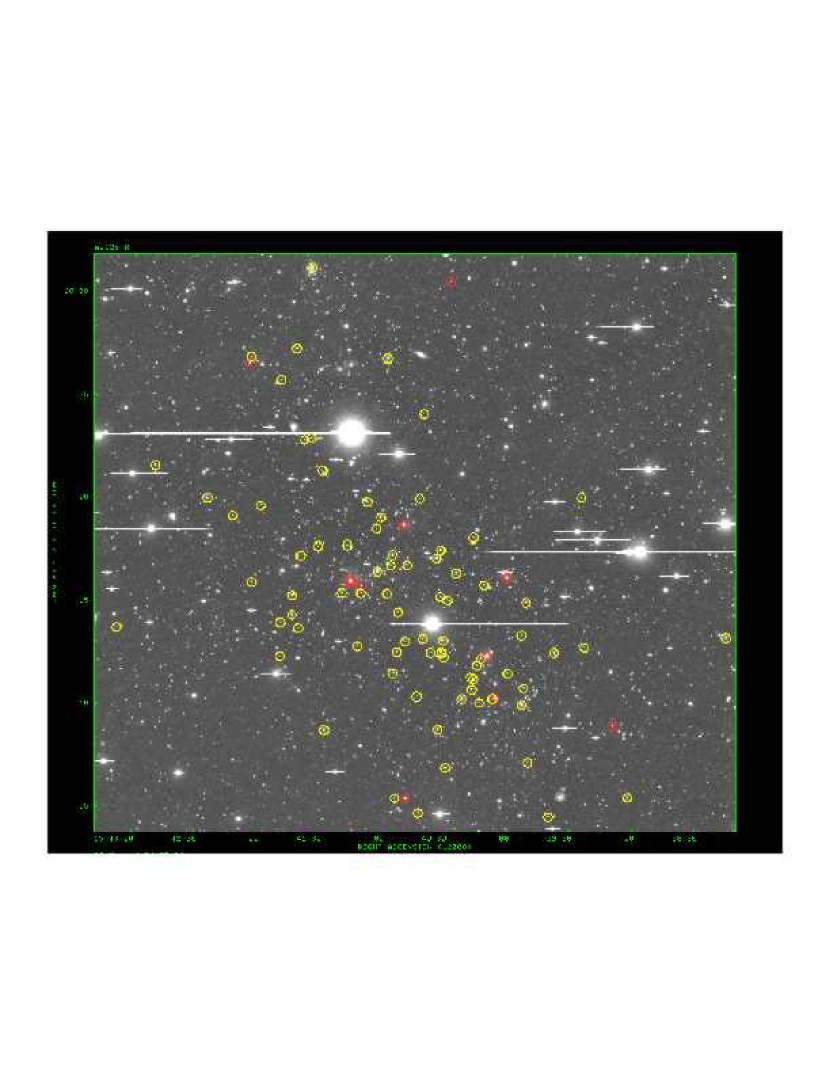
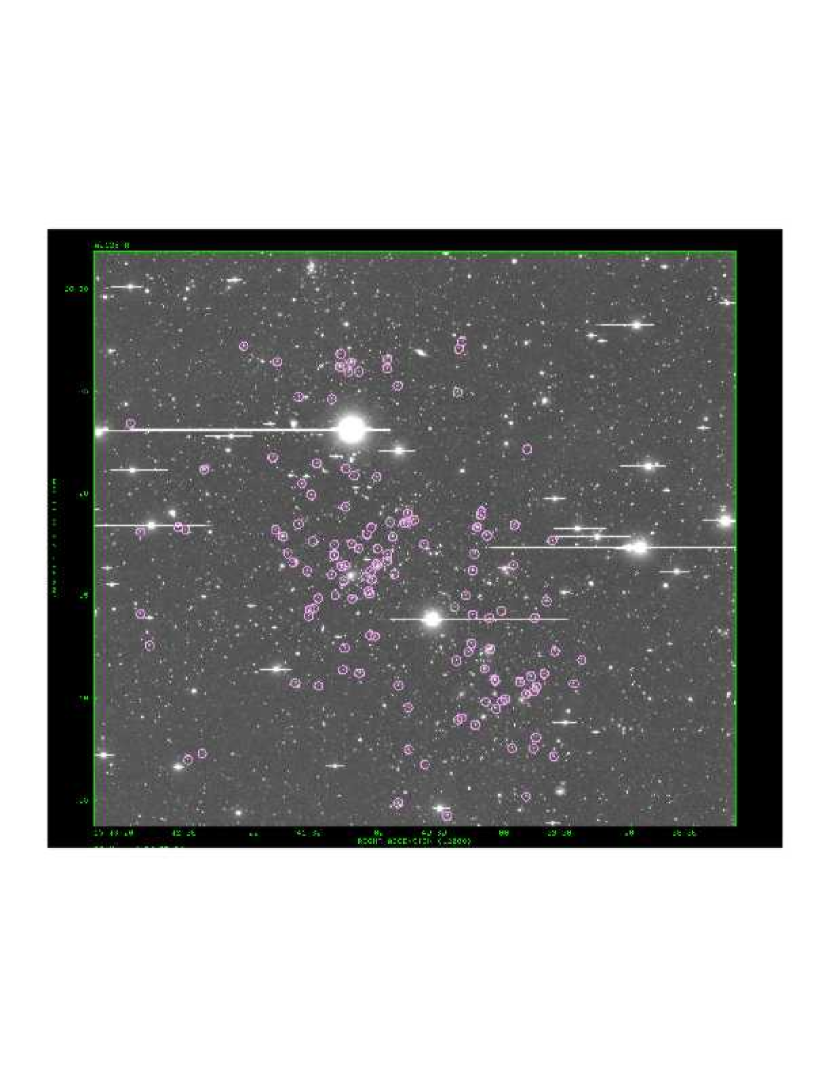
In figure 9 we mark the radio emitters on the optical field. Objects in red have , clearly above the nominal break between AGNs and starbursts (Miller & Owen, 2002). In figure 10 we show a similar plot for the cluster members without radio emission from Miller et al. (2004). Clearly, the distribution of all the galaxies is centered about 1 Mpc southwest of the nominal cluster core, near [15 41 15, 66 16 00] (Owen et al., 1999) and are distributed over a region about Mpc in projection. Unlike the impression of two concentrations of radio emitters given by the smaller sample in Owen et al. (1999), the lower luminosity radio emitters are distributed almost uniformly over this large region, and appear even somewhat less clustered than the non-radio emitters. This pattern suggests a fairly uniform distribution of radio-emitting galaxies over the entire projected volume, perhaps avoiding the core of this region. The nominal core of A2125 (where the greatest projected local density of galaxies is found) is not centered in the overall galaxy distribution, and the radio-emitting, star-forming population seems not to be aware of this dense concentration of galaxies. This situation is qualitatively similar to the Cygnus A cluster in which the dense core containing the radio galaxy is offset from the centroid of the overall galaxy distribution (Owen et al., 1997). We find absolutely no correlation between distance from the nominal cluster core and redshift for the radio population. The radio galaxies appear to have radial velocities centered on the cluster mean but including the full range seen in Miller et al.(2003). Thus there is no simple signature of an infalling radio population
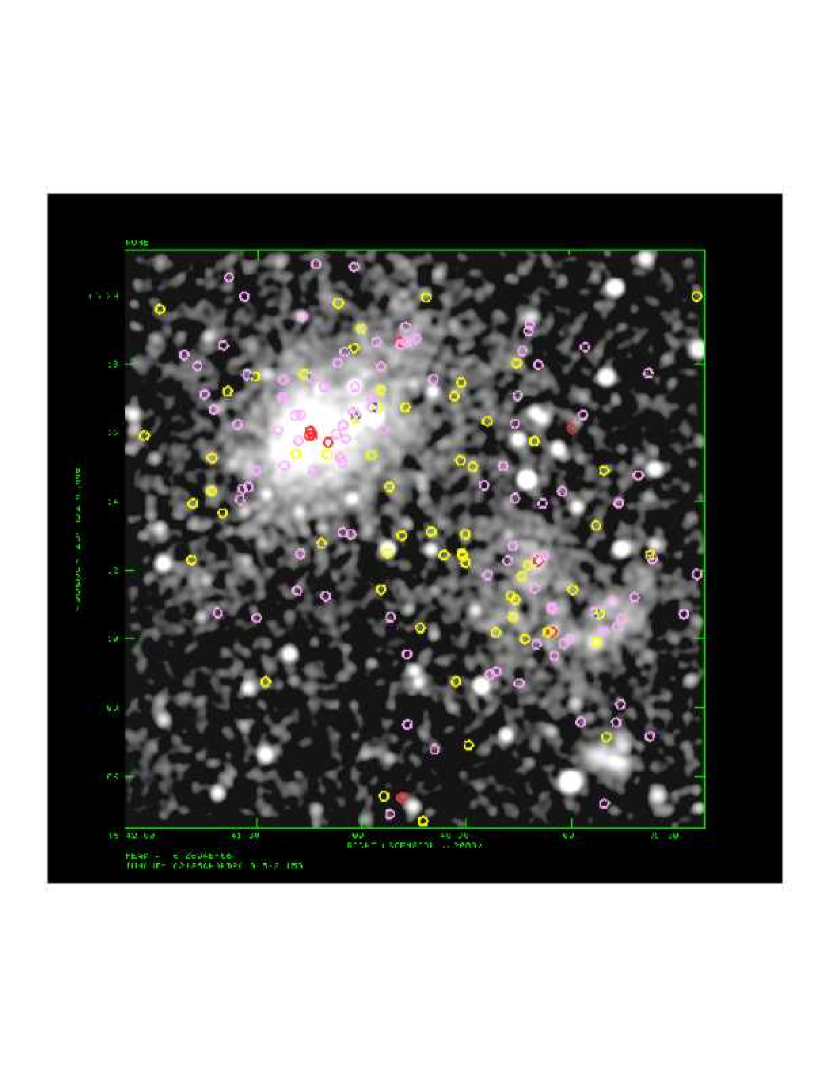
In figure 11, we show the cluster members with the same color coding as in figure 9 and figure 10 overlaid on the the Chandra 0.5-2.0 keV image (as convolved with a 15 arcsec circular Gaussian). The non-radio detected galaxies do follow the the X-ray distribution in the cluster core and to some extent the more diffuse emission to the southwest. However, the low-luminosity radio emitters (mostly star-forming galaxies) do not show much correlation with the X-ray detections except on the largest scales.
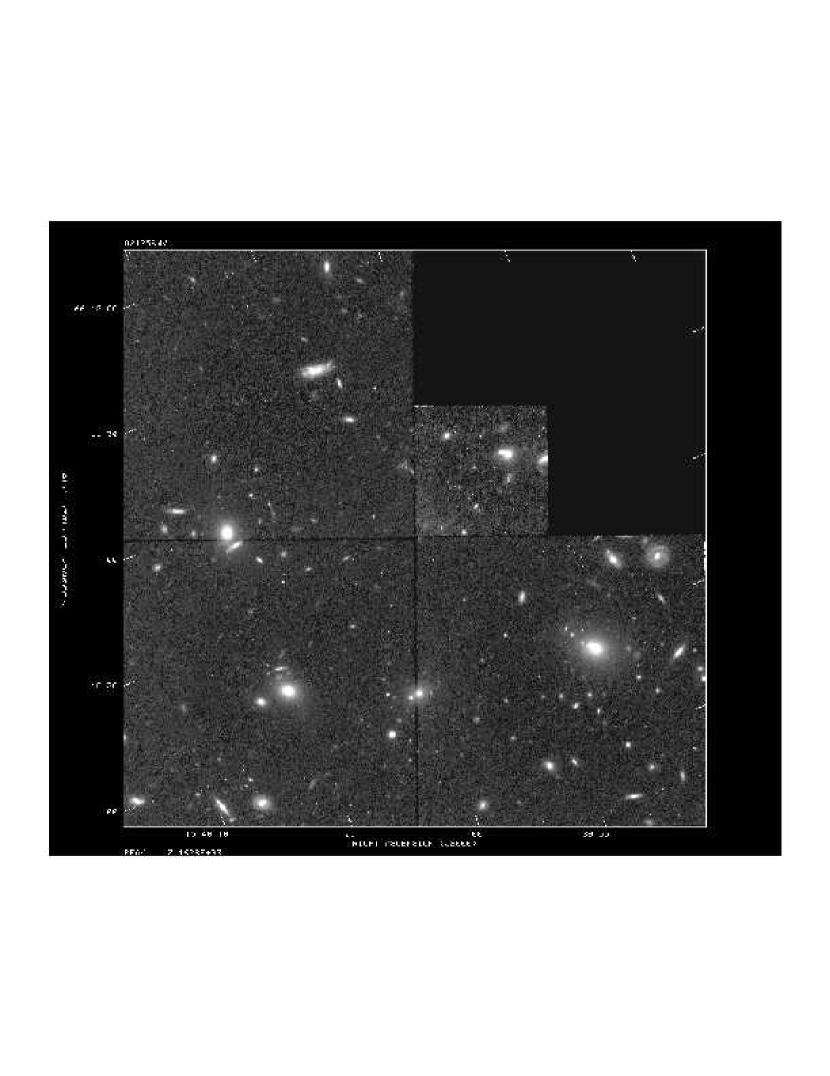
Another perspective on Abell 2125 can seen in figure 12, the HST F814W image of one of the fields in a brighter part of the SW X-ray concentration. Rather than a random distribution of galaxies we find what appear to be several groups of a various sizes. A simple 2D substructure test, not taking into account the magnitudes of the galaxies, shows substructure at % significance level (Ledlow et al, 2000). Thus in this part of the cluster, we seem to be looking through a system made up not of a monolithic cluster but rather many small groups seen in projection.
All of these results plus the broad distribution of radio galaxies in figure 9 suggest that we are dealing with a complex interaction between at least two merging subsystems and that much of the activity appears to be taking place on the outskirts of the two systems, perhaps in group-like environments. The nominal cluster core does not appear to be at the “center” of the large scale cluster but is only one over-dense region in a much larger, complex system. The X-ray luminosity and temperature are also much more consistent with this picture than for a single, monolithic cluster.
4 Discussion
4.1 General Picture of Abell 2125
From our optical and X-ray observations of Abell 2125 we conclude that the vast majority of the radio emitting galaxies in the cluster reflect star formation. The SFRs implied by this emission are relatively modest, M⊙yr-1. Only a handful of the radio emitters are compact X-ray AGN, about 10%. Most of these are close to our Chandra detection limit. Surprisingly, at least 12 more radio objects in the Chandra field are not detected by Chandra but appear to be AGN, based on a SFI . Several of these are quite clearly FR I or FR II radio galaxies (Dwarakanath & Owen, 1999). Essentially all galaxies which are at least 30% brighter than appear to be AGN driven, along with a much smaller percentage of the lower optical-luminosity galaxies. Our 80 ksec Chandra exposure does not seem to be deep enough to detect most radio AGN at found in our VLA radio survey of about the same total duration.
Except for four sources in the cluster core, which we will discuss in another paper, both the AGN and the star-forming objects are distributed on a scale of several Mpc and are less clustered than the spectroscopically confirmed non-radio members. Thus the increase in activity we are seeing in Abell 2125 with respect to other rich clusters seems to be taking place on scales closer to a supercluster than a typical cluster core.
From figure 9, we see that the distribution of lower radio luminosity detections is offset from the nominal cluster center about about 1 Mpc and distributed rather uniformly over a region Mpc in projection, much like the X-ray emission. In figure 10, we show the locations of the known cluster members without radio detections. One can see that these galaxies appear more clustered than the radio population. Thus the projected distribution suggests that the low luminosity radio population is less clustered than the radio-quiet population and thus is likely to be located in lower density regions in the cluster complex.
From Miller et al. (2004), we see that the entire system can be modeled as an ongoing cluster-cluster merger seen at an angle to the line-of-sight of about 30 degrees. In this picture, the excess star formation is taking place on the scale of the merger, not in the cluster core. Since the major axis of the merging system is near our line-of-sight, the lower density outlying regions of the cluster are projected closer to cluster center than for a more random orientation. This makes the cluster appear richer and accounts for the low X-ray luminosity for such an apparently rich cluster (Miller et al., 2004). In fact, clusters near the upper end of Abell richness must tend to be the ones with their major axis in our line-of-site, since more of the galaxies will be projected into the 2D circle on the sky where richness is estimated. Since the outer parts of clusters are bluer than the cores, such clusters should tend to have larger blue fractions than average, since more of the outer population are projected on the cluster core where the Butcher-Oemler effect is measured (Butcher & Oemler, 1984). Thus projection effects explain some of the properties of Abell 2125.
Examination of the outer parts of the cluster with HST (figure 12) shows that many of the galaxies appear to be in small groups. This is an environment one might expect to find on the outskirts of an Abell cluster, in the moderate-density regions of a supercluster. Such environments are more favorable to galaxy interactions and mergers than in regions near the dense core of a cluster. Thus the broad distribution of excess star-forming radio galaxies is consistent with most of the activity we see taking place in such medium density, group environments.
The important question is whether projection effects explain the entire radio excess in Abell 2125 relative to other similar clusters. From Morrison & Owen (2003), the median radio fraction for clusters of similar richness and redshift, considering detected cluster members within 2.5 Mpc of the cluster center, is about 2%. For Abell 2125, the radio fraction is 9%. For clusters similar to Abell 2125 in redshift and richness, only % of the brighter galaxies used in the counts out to 2 Mpc lie within 0.5 Mpc of the cluster core. Thus the richness and radio fraction estimate both describe primarily the properties of galaxies far from the cluster core.
The well-known morphology-density relation (Dressler, 1980) shows that at the densities found in rich cluster cores, very few late type galaxies are found and those show evidence for suppressed star formation (Hashimoto et al, 1998). However, outside the cluster core at distances Mpc from the cluster center, the fraction of late type galaxies typically rises to %, increasing only slowly beyond that distance (Whitmore & Gilmore, 1991). Furthermore, Hashimoto et al (1998) suggest that star formation is most active in such intermediate density regions, where galaxy interactions should be most common.
It is likely we are seeing Abell 2125 in some sort of projection. However, as long as most of the observed cluster members are in intermediate density regions, we would expect only a small bias to higher SFR systems with respect to clusters whose major axis is nearer the plane of the sky. However, the excess radio galaxy fraction is four to five times higher than we typically see in other similar rich clusters. In order to explain the high radio fraction in Abell 2125 some other effect must be important. Such an effect could well be that we see Abell 2125 at a special time. Miller et al. (2004) argue that the dynamics of Abell 2125 are consistent with such a picture. Their KMM substructure analysis of the positions and radial velocities of 224 galaxies associated with the cluster find that the Abell 2125 is most consistent with two (or possibly three) velocity systems seen in projection along the line-of-sight. A comparison of the observed dynamics with the -body merger simulations of Pinkney et al. (1996) show an excellent match to a cluster-cluster merger seen at a viewing angle of about 30 degrees from the line-of-site and within 0.2 Gyr of core passage. Assuming this physical situation, the mass of the entire system also lies within a reasonable range near M⊙. Given this picture, several physical mechanisms could be responsible for most of the increase in activity.
4.2 Mechanisms
Numerous mechanisms have been considered which affect the SFR of galaxies in clusters. Certainly, the rate of galaxy mergers, ISM stripping, galaxy harassment, changes in the external pressure and tidal effects all have the potential to increase or decrease the SFR of a galaxy. Most of the work on these subjects has considered galaxies falling radially into a massive cluster. However, the physical situation we are observing appears to be different, i.e. two massive cluster and their associated lower density outskirts involved in a major merger, probably near the point of core passage. Since we are not aware of such a simulation designed to look for the effects relevant to star-formation we will need to extrapolate a bit using the physical effects which have been discussed in a less extreme context.
In a high velocity cluster-cluster merger like Abell 2125, one would expect galaxy-galaxy mergers to be disfavored, since the probability of a galaxy-galaxy merger is proportional to the inverse fourth power of the local velocity dispersion (Gnedin, 2003a). However, the details of group-group mergers in such a system might complicate this argument. Nonetheless, we see no direct evidence that galaxy-galaxy mergers play a major role in Abell 2125.
Fujita & Nagashima (1999) conclude that ram pressure on a galaxy radially infalling into a cluster can increase the SFR by a factor of 2 near the cluster core before the rate decreases due to the stripping of the gas. In a complex cluster-cluster merger, the velocity of galaxies relative to the local medium could be much larger than in the infall case. Thus the total ram pressure could easily rise above the values found in the center of an isolated cluster Furthermore, some of the systems in figure 2 show evidence of non-aligned radio emission which could indicate stripping, lending support to ram pressure as a contributer to the increased SFR.
Galaxy harassment (Moore, Lake & Katz, 1998), involves the cumulative effects of fast encounters between galaxies in clusters. Most of the impact of this mechanism involves lower-mass galaxies near the cluster core. Since most of the activity we see is far from the core of Abell 2125 and involves relatively massive galaxies, it seem unlikely this mechanism has much to do with the effects we are seeing.
Tidal effects in clusters have been recently considered by a number of papers as a way to affect galaxy morphology and SFRs. Byrd & Valtonen (1990) and Henriksen & Byrd (1996) argue that the tidal effect of the cluster potential on an infalling galaxy would create more star-formation activity than stripping by the IGM. Bekki (1999) studied the case of the tidal effects on a spiral in a group, as the group falls into a more massive cluster; besides driving a transient starburst, the variable tidal field of the group heats the disk and ultimately leads to an S0 morphology. Gnedin (2003a) simulates the general case of galaxies falling into a cluster in the presence of the time varying tidal field resulting from other substructure which also is in the process of falling in. The simulation shows that in the frame of an infalling galaxy there exists a strongly time-variable tidal field with multiple major events far from the cluster core. Gnedin (2003b) concludes that this process leads to the transformation of spirals into S0’s.
4.3 Application to Abell 2125
The case we see in Abell 2125 is somewhat different than discussed in the previous section in that we seem to be seeing a major merger close to core passage. Thus the mechanisms discussed above need to be considered at this special time, which is supported by the fact that Abell 2125 stands out from other rich clusters that have been studied at similar redshifts (Morrison & Owen, 2003). At a later time one should expect A2125 to have settled down and to have evolved into a rich cluster like those we see locally.
In such a dynamic case, the time-variable tidal effects must be especially extreme. It thus seems likely that the effects described by Bekki (1999) and Gnedin (2003a) must be especially important. However, not enough time will have passed for the systems to reach their ultimate fate. The observations show an excess of galaxies with active star-formation but 37% of these systems have optical concentration indices lying between disks and laws. They also have SEDs far from young objects one might associate with bursts of recent star-formation.
This pattern seems consistent with star formation related to the strongly time-variable tidal forces as analyzed in Bekki (1999) and Gnedin (2003a). Once the event is over, these galaxies seem on their way to becoming dull S0’s as described by Gnedin (2003a). The distribution of concentration indices suggests that many of our detected systems are neither pure disks nor spheroids. Thus the structures of many of the radio galaxies (see figure 3) are consistent with objects which have experienced tidal heating. However, the analysis of Bekki (1999) and Gnedin (2003b) suggest that the timescale for the transition from disk to S0 is very long, many Gyrs, while the gas-dynamic processes which led to star-formation have much shorter timescales. Thus the broad distribution of concentration indices associated with the radio galaxies either suggests that tidal heating has been taking place for some time or that the tidal forces are larger in the Abell 2125 case leading to more rapid evolution of the stellar distribution. A more targeted analysis of tidal effects during a major cluster-cluster merger is needed to understand better how tidal (and other) effects would affect a system like Abell 2125. But given that cluster-cluster mergers are quite common events, our observational results suggest that core passage during a major cluster-cluster is may be an especially important time in galaxy evolution.
5 Conclusions
The excess levels of radio emission in Abell 2125 are dominantly related to star formation. Abell 2125 is a cluster-cluster merger seen in projection. Active star formation is not associated with the cluster core but spread fairly uniformly throughout a Mpc region in projection. This activity must be taking place in intermediate density regions, mostly in groups associated with the outskirts of the merging clusters.
The cluster-cluster merger seen in projection accounts for the relatively low X-ray luminosity and temperature, combined with the very high richness and relatively high Butcher-Oemler blue fraction. The excess radio population also is at least partly explained by projection effects. However, the large radio population seems also to require some other mechanism to explain the four to five times larger radio fraction than is seen in other such clusters. This extra factor may be due to the cluster-cluster merger being seen very close to core passage where the interactions of the two cluster systems should be greatest.
It seems likely that star-formation has been stimulated in the outlying group environments associated with the clusters during the time near the core passage. The variations in the tidal field, experienced by each galaxy due to the changing substructure and its position relative to each galaxy seems to be the most likely origin for the enhanced SFRs seen in Abell 2125. The activity in Abell 2125, combined with its dynamical state close to core passage of a major cluster-cluster merger, suggests that this phase in cluster evolution may be particularly important for galaxy evolution.
The authors thank A. Klypin for useful discussions about the large scale structure and J. Eilek for comments on the text.
References
- Abraham et al. (1994) Abraham R.G., Valdes, F, Yee, H.K.C., & Van Den Bergh, S. 1994, ApJ, 432, 75
- Bekki (1999) Bekki, K. 1999, ApJ, 510, L15
- Bekki, Couch & Shioya (2002) Bekki, K., Couch, W. J. & Shioya, Y. 2002, ApJ, 577, 651
- Bolzonella, Miralles, & Pelló (2000) Bolzonella, M., Miralles, J.-M., & Pelló, R. 2000, A&A, 363, 476
- Bruzual & Charlot (1993) Bruzual, G. & Charlot, S. 1993, ApJ, 405, 538
- Butcher & Oemler (1984) Butcher, H. & Oemler, A. 1984, ApJ, 285, 426
- Byrd & Valtonen (1990) Byrd, G. & Valtonen, M. 1990, ApJ, 350, 89
- Calzetti et al. (2000) Calzetti, D., Armus, L., Bohlin, R. C., Kinney, A. L., Koornneef, J., & Storchi-Bergmann, T. 2000, ApJ, 533, 682
- Colbert et al. (1996) Colbert, E. J. M., Baum, S. A., Gallimore, J. F., O’Dea, C. P. & Christensen, J. A. 1996, ApJ, 467, 551
- Condon (1992) Condon, J. J. 1992, A&A Rev., 30, 575
- Condon, Cotton & Broderick (2002) Condon, J. J., Cotton, W. D. & Broderick, J. J. 2002, AJ, 124, 675
- Dressler (1980) Dressler, A., ApJ, 236, 351
- Dwarakanath & Owen (1999) Dwarakanath, K. S. & Owen, F. N. 1999, AJ, 118, 625
- Fujita (1999) Fujita, Y. 1999, ApJ, 509, 587
- Fujita & Nagashima (1999) Fujita, Y. & Nagashima, M. 1999, ApJ, 516, 619
- Gnedin (2003a) Gnedin, O. Y. 2003a, ApJ, 582, 141
- Gnedin (2003b) Gnedin, O. Y. 2003b, ApJ, 589, 752
- Hashimoto et al (1998) Hashimoto, Y., Oemler, A., Lin, H., & Tucker, D. 1998, ApJ, 499, 589
- Henriksen & Byrd (1996) Henriksen, M., & Byrd, G. 1996, ApJ, 459, 82
- Ledlow & Owen (1996) Ledlow, M. J. & Owen, F. N. 1996, AJ, 112, 9
- Ledlow et al (2000) Ledlow, M. J., Owen, F. N., Keel, W. C. & Andersen, V. 2000, Ap&SS, 269, 613
- Miller (2001) Miller, N. A. 2001, PhD Thesis, New Mexico State University
- Miller & Owen (2002) Miller, N. A. & Owen, F. N. 2002, AJ, 124, 2453
- Miller et al. (2004) Miller, N. A., Owen, F. N., Oegerle, W., Keel, W., & Ledlow, M. 2004, ApJ, in press (astro-ph/406292)
- Moore, Lake & Katz (1998) Moore, B., Lake, G. & Katz, N. 1998, ApJ, 495, 139
- Morrison & Owen (2003) Morrison, G. E. & Owen, F. N. 2003, AJ, 125, 506
- Owen, Ledlow, & Keel (1995) Owen, F. N., Ledlow, M. J. & Keel, W. C. 1995, AJ, 109, 14
- Owen et al (2004a) Owen, F. N., Keel, W. C., Ledlow, M. J., G.E. Morrison & Windhorst, R. A. 2004a, submitted
- Owen et al (2004b) Owen, F. N., Keel, W. C., Wang, Q. D., & Ledlow, M. J. 2004b, in preparation
- Owen et al. (1999) Owen, F. N., Ledlow, M. J., Keel, W. C., & Morrison, G. E, 1999, AJ, 118, 633
- Owen et al. (1997) Owen, F. N., Ledlow, M. J., Morrison, G. E., & Hill, J. M. 1997, ApJ, 488, L15
- Pinkney et al. (1996) Pinkney, J., Roettiger, K., Burns, J. O., & Bird, C. M. 1996, ApJS, 104, 1
- Ranalli, Comastri, & Setti (2003) Ranalli, P., Comastri, A., & Setti, G. 2003, A&A, 399, 39
- Wang (2004) Wang, Q. D. 2004 ApJ, in press (astro-ph/0405272)
- Wang, Connolly, & Brunner (1997) Wang, Q. D., Connolly, A. & Brunner, R. J. 1997, ApJ, 487, L13
- Wang, Owen & Ledlow (2004) Wang, Q. D., Owen, F. N., & Ledlow, M. J. 2004, ApJ, in press (astro-ph/0404602)
- Whitmore & Gilmore (1991) Whitmore, B. C. & Gilmore, D. M. 1991, ApJ, 367, 64
- Yun, Reddy, & Condon (2001) Yun, M. S., Reddy, N. A., & Condon, J. J. 2001, ApJ, 554, 803
- Williams et al. (1996) Williams, R. E., Blacker, B., Dickinson, M., Dixon, W. V., Ferguson, H. C., Fruchter, A. S., Giavalisco, M., Gilliland, R. L., Heyer, I., Katsanis, R., Levy, Z., Lucas, R. A., McElroy, D. B., Petro, L., Postman, M., Adorf, H., & Hook, R. N. AJ, 112, 1335


| Name | RA(2000.0) | Dec(2000.0) | Dist | Peak | Total | Size | z |
|---|---|---|---|---|---|---|---|
| Mpc | Jy/b | Jy | arcsec | ||||
| 17017 | 15 38 13.80(0.08) | 66 13 05.9(0.5) | 18.3 | 32.1 | 148.5( 33.) | 2.2 | 0.2475 |
| 23009 | 15 39 01.94(0.09) | 66 05 24.2(0.5) | 16.5 | 39.8 | 300.6( 85.) | 4.1 | 0.2575 |
| 23016 | 15 39 08.69(0.02) | 66 08 52.8(0.1) | 14.1 | 764.1 | 60235.0(1829.) | 25.0 | 0.2449 |
| 18013 | 15 39 22.18(0.05) | 66 12 41.6(0.3) | 11.5 | 75.1 | 152.4( 15.) | 1.3 | 0.2449e |
| 11700 | 15 39 23.16(0.09) | 66 19 57.7(0.5) | 12.2 | 25.3 | 53.3( 15.) | 2.5 | 0.2442e |
| 18023 | 15 39 36.86(0.04) | 66 12 27.0(0.3) | 10.1 | 109.1 | 191.6( 14.) | 1.2 | 0.2448 |
| 24007 | 15 39 40.10(0.05) | 66 04 28.7(0.3) | 14.2 | 128.5 | 364.1( 26.) | 1.0x0p=46 | 0.2468e |
| 24012 | 15 39 49.73(0.06) | 66 07 99.1(0.4) | 11.6 | 62.2 | 170.8( 26.) | 1.6x0.5p=5 | 0.2445e |
| 18700 | 15 39 50.14(0.08) | 66 14 54.7(0.5) | 8.4 | 27.1 | 39.7( 10.) | 1.8 | 0.2458 |
| 24015 | 15 39 51.62(0.08) | 66 10 43.8(0.5) | 9.3 | 42.6 | 114.7( 29.) | 2.6x0p=108 | 0.2408e |
| 18030 | 15 39 52.47(0.06) | 66 13 18.5(0.4) | 8.4 | 55.6 | 83.3( 11.) | 0.9 | 0.2482e |
| 24016 | 15 39 52.52(0.07) | 66 09 54.3(0.4) | 9.7 | 50.6 | 270.1( 48.) | 3.6 | 0.2458 |
| 18033 | 15 39 59.31(0.04) | 66 11 26.6(0.3) | 8.3 | 166.4 | 348.4( 23.) | 2.0x0.7p=71 | 0.2458e |
| 18072 | 15 39 59.43(0.02) | 66 16 07.5(0.1) | 7.6 | 600.4 | 10668.0( 335.) | 99.0 | 0.2459 |
| 24027 | 15 40 05.34(0.03) | 66 10 12.9(0.2) | 8.4 | 359.5 | 970.0( 45.) | 4.6 | 0.2425 |
| 24030 | 15 40 06.60(0.08) | 66 10 12.8(0.5) | 8.3 | 38.3 | 82.6( 21.) | 1.9x0p=156 | 0.2436e |
| 18041 | 15 40 09.11(0.05) | 66 12 17.1(0.3) | 7.1 | 114.3 | 390.0( 30.) | 2.3x0.6p=75 | 0.2455 |
| 18701 | 15 40 10.34(0.09) | 66 15 46.2(0.6) | 6.5 | 32.3 | 149.1( 46.) | 8.5x2.0p=156 | 0.2477 |
| 18042 | 15 40 12.05(0.03) | 66 12 09.9(0.2) | 6.9 | 167.5 | 330.5( 15.) | 0.7 | 0.2558 |
| 24111 | 15 40 13.05(0.10) | 66 10 01.1(0.6) | 7.9 | 27.3 | 107.2( 42.) | 5.5x0p=93 | 0.2460e |
| 18045 | 15 40 13.98(0.09) | 66 11 50.7(0.5) | 6.8 | 35.1 | 62.1( 17.) | 1.6x0p=71 | 0.2458e |
| 18047 | 15 40 15.38(0.08) | 66 18 02.5(0.5) | 6.6 | 43.6 | 101.2( 22.) | 2.2x0.6p=54 | 0.2433e |
| 18048 | 15 40 15.84(0.04) | 66 11 09.9(0.3) | 7.0 | 134.6 | 334.3( 23.) | 1.7x1.5p=57 | 0.2455e |
| 24701 | 15 40 16.49(0.08) | 66 10 39.7(0.5) | 7.2 | 29.8 | 39.9( 9.) | 1.9 | 0.2559 |
| 18702 | 15 40 17.14(0.12) | 66 11 15.9(0.7) | 6.8 | 25.8 | 37.6( 19.) | 2.7x0p=115 | 0.2443e |
| 24033 | 15 40 21.42(0.07) | 66 10 12.1(0.4) | 7.2 | 36.6 | 48.8( 9.) | 1.9 | 0.2565 |
| 18703 | 15 40 23.87(0.12) | 66 16 21.4(0.7) | 5.2 | 21.8 | 33.5( 18.) | 2.5x0p=84 | 0.2500 |
| 05012 | 15 40 26.03(0.06) | 66 30 29.5(0.3) | 16.2 | 88.9 | 426.7( 49.) | 1.8x0.8p155 | 0.2573 |
| 18070 | 15 40 28.02(0.09) | 66 15 01.9(0.5) | 4.6 | 29.8 | 50.3( 15.) | 1.5x0.6p=80 | 0.2475e |
| 24115 | 15 40 29.36(0.07) | 66 06 55.1(0.4) | 9.3 | 35.6 | 56.6( 11.) | 1.3 | 0.2421 |
| 18056 | 15 40 30.13(0.04) | 66 12 14.2(0.3) | 5.2 | 144.3 | 195.0( 12.) | 0.9x0p=123 | 0.2456e |
| 18057 | 15 40 30.23(0.05) | 66 13 04.1(0.3) | 4.8 | 114.7 | 151.2( 12.) | 1.20x0p=27 | 0.2494e |
| 18300 | 15 40 30.98(0.09) | 66 12 26.2(0.5) | 5.0 | 25.3 | 29.2( 8.) | 2.0 | 0.2458e |
| 18060 | 15 40 31.21(0.06) | 66 12 30.5(0.3) | 5.0 | 81.2 | 199.2( 24.) | 2.6x1.5p=3 | 0.2474e |
| 18061 | 15 40 31.27(0.08) | 66 17 28.9(0.5) | 5.0 | 43.9 | 98.2( 24.) | 3.1x1.9p=4 | 0.2430 |
| 18062 | 15 40 31.55(0.06) | 66 15 12.6(0.3) | 4.3 | 76.1 | 149.3( 18.) | 1.9x0.8p=66 | 0.2444e |
| 25001 | 15 40 32.93(0.09) | 66 08 46.7(0.5) | 7.5 | 35.6 | 143.4( 41.) | 4.9x2.5p=68 | 0.2430e |
| 00002 | 15 40 33.28(0.04) | 66 17 05.8(0.2) | 4.6 | 137.4 | 156.7( 9.) | 0.9 | 0.2548 |
| 00600 | 15 40 36.31(0.07) | 66 12 28.0(0.4) | 4.6 | 35.0 | 39.4( 8.) | 1.5 | 0.2423e |
| 12004 | 15 40 39.09(0.09) | 66 24 05.8(0.5) | 9.7 | 40.0 | 67.9( 19.) | 1.7x0p=15 | 0.2381e |
| 00007 | 15 40 40.05(0.07) | 66 13 08.9(0.4) | 3.9 | 56.3 | 150.4( 24.) | 2.7x1.1p=104 | 0.2462e |
| 12007 | 15 40 41.44(0.09) | 66 19 57.2(0.6) | 5.9 | 39.0 | 74.8( 23.) | 3.1x0p=137 | 0.2429e |
| 25100 | 15 40 42.46(0.09) | 66 04 42.5(0.5) | 10.8 | 34.9 | 210.1( 57.) | 4.8x2.3p=107 | 0.2521e |
| 25010 | 15 40 43.17(0.03) | 66 10 20.6(0.2) | 5.6 | 222.0 | 264.7( 12.) | 0.7 | 0.2558 |
| 00700 | 15 40 47.55(0.10) | 66 16 45.5(0.6) | 3.2 | 24.8 | 40.6( 16.) | 2.1x0p=47 | 0.2469 |
| 00014 | 15 40 48.54(0.08) | 66 13 01.3(0.5) | 3.2 | 34.5 | 182.2( 42.) | 5.5x4.7p=127 | 0.2423 |
| 25702 | 15 40 48.63(0.06) | 66 05 24.1(0.4) | 9.9 | 79.6 | 419.8( 52.) | 11.03x6.5p=14 | 0.2561 |
| 00104 | 15 40 49.16(0.02) | 66 18 39.8(0.1) | 4.4 | 504.0 | 16108.0( 497.) | 25.0 | 0.2433 |
| 00020 | 15 40 52.14(0.08) | 66 14 27.0(0.5) | 2.3 | 32.1 | 144.6( 37.) | 4.5x1.7p=9 | 0.2419e |
| 00022 | 15 40 52.63(0.05) | 66 12 30.4(0.3) | 3.3 | 97.2 | 190.5( 16.) | 1.5x1.3p=96 | 0.2588e |
| 25015 | 15 40 53.63(0.05) | 66 05 26.4(0.3) | 9.8 | 94.3 | 153.5( 12.) | 1.0 | 0.2508e |
| 00026 | 15 40 54.49(0.04) | 66 11 27.4(0.2) | 4.1 | 191.3 | 210.0( 10.) | 0.7 | 0.2484e |
| 00027 | 15 40 54.67(0.03) | 66 17 15.7(0.2) | 3.0 | 246.0 | 310.1( 13.) | 0.8x0.5p=119 | 0.2560e |
| 00028 | 15 40 55.56(0.06) | 66 16 44.7(0.4) | 2.5 | 53.3 | 55.5( 7.) | 1.1 | 0.2486 |
| 12027 | 15 40 56.88(0.06) | 66 26 45.6(0.3) | 11.9 | 122.5 | 308.6( 35.) | 3.1x0.6p=167 | 0.2463 |
| 00031 | 15 40 57.30(0.08) | 66 15 22.5(0.5) | 1.7 | 51.6 | 96.0( 19.) | 2.7x0p=16 | 0.2545e |
| 00034 | 15 41 00.33(0.07) | 66 19 02.5(0.4) | 4.3 | 37.8 | 41.9( 8.) | 1.0 | 0.2395 |
| 00039 | 15 41 01.93(0.03) | 66 16 26.6(0.2) | 1.9 | 202.7 | 207.2( 9.) | 0.8 | 0.2457 |
| 00201 | 15 41 02.33(0.06) | 66 18 29.4(0.4) | 3.7 | 38.7 | 72.7( 10.) | 5.4 | 0.2454e |
| 12033 | 15 41 06.84(0.09) | 66 19 47.5(0.5) | 4.8 | 32.0 | 125.0( 35.) | 4.2x1.7p=55 | 0.2406e |
| 00047 | 15 41 09.73(0.02) | 66 15 44.5(0.1) | 0.9 | 21783.0 | 22944.0( 689.) | 14.0 | 0.2528e |
| 00703 | 15 41 09.97(0.08) | 66 15 23.6(0.5) | 0.6 | 35.6 | 156.2( 38.) | 6.3x4.7p=55 | 0.2494 |
| 00051 | 15 41 11.59(0.09) | 66 12 47.9(0.6) | 2.2 | 33.0 | 54.4( 18.) | 2.5x0p=113 | 0.2473e |
| 00057 | 15 41 14.37(0.02) | 66 15 57.1(0.1) | 1.0 | 1300.0 | 2910.0( 90.) | 2.8x0.8p=12 | 0.2518 |
| 00105 | 15 41 14.87(0.04) | 66 16 03.8(0.2) | 1.1 | 272.0 | 677.0( 33.) | 4.0 | 0.2470 |
| 00106 | 15 41 15.24(0.02) | 66 15 56.7(0.1) | 1.0 | 1052.0 | 15712.0( 477.) | 23.0 | 0.2466 |
| 00060 | 15 41 16.60(0.08) | 66 17 42.6(0.5) | 2.7 | 47.4 | 112.1( 23.) | 2.9x0.8p=178 | 0.2422e |
| 00701 | 15 41 19.06(0.09) | 66 15 24.2(0.5) | 0.6 | 24.2 | 24.2( 7.) | 2.3 | 0.2480 |
| 25701 | 15 41 27.59(0.09) | 66 8 45.6(0.5) | 6.4 | 25.6 | 32.5( 9.) | 1.3 | 0.2454 |
| 12068 | 15 41 28.51(0.06) | 66 21 20.1(0.4) | 6.5 | 53.4 | 67.1( 9.) | 1.4 | 0.2484e |
| 00077 | 15 41 30.76(0.06) | 66 17 39.5(0.3) | 3.1 | 76.5 | 132.4( 15.) | 1.6x0.9p=163 | 0.2516e |
| 06008 | 15 41 33.87(0.05) | 66 31 11.7(0.3) | 16.3 | 96.4 | 347.1( 27.) | 1.2 | 0.2369 |
| 12058 | 15 41 33.89(0.05) | 66 22 54.7(0.3) | 8.2 | 105.5 | 149.6( 11.) | 0.9 | 0.2514 |
| 12100 | 15 41 37.29(0.09) | 66 22 49.8(0.5) | 8.2 | 36.6 | 104.4( 29.) | 2.9x0p=104 | 0.2488e |
| 00084 | 15 41 38.90(0.06) | 66 17 13.3(0.4) | 3.3 | 62.6 | 82.7( 11.) | 1.2x0.2p=24 | 0.2397e |
| 00085 | 15 41 40.16(0.08) | 66 13 40.3(0.5) | 3.0 | 41.0 | 145.8( 31.) | 3.7x1.4p=37 | 0.2517 |
| 12702 | 15 41 41.13(0.08) | 66 27 12.7(0.5) | 12.5 | 29.3 | 65.3( 16.) | 3.1 | 0.2398e |
| 00089 | 15 41 43.23(0.05) | 66 15 16.6(0.3) | 3.0 | 128.8 | 152.1( 12.) | 1.4x0.4p=145 | 0.2518 |
| 00704 | 15 41 43.28(0.06) | 66 14 19.2(0.3) | 3.0 | 97.2 | 297.8( 34.) | 8.1x6.1p=179 | 0.2547 |
| 12061 | 15 41 48.61(0.05) | 66 25 45.4(0.3) | 11.3 | 80.0 | 151.1( 14.) | 0.9 | 0.2492e |
| 00705 | 15 41 48.77(0.07) | 66 13 57.2(0.4) | 3.7 | 62.8 | 193.8( 34.) | 9.3x5.0p=129 | 0.2444 |
| 00098 | 15 41 49.03(0.06) | 66 12 18.2(0.3) | 4.4 | 66.1 | 74.6( 8.) | 0.9 | 0.2473e |
| 13700 | 15 41 58.49(0.08) | 66 19 36.4(0.5) | 6.4 | 27.7 | 35.0( 9.) | 1.4 | 0.2534 |
| 19011 | 15 42 02.85(0.10) | 66 15 54.8(0.6) | 5.0 | 38.2 | 69.4( 25.) | 4.6x0p=101 | 0.2412e |
| 13003 | 15 42 03.39(0.08) | 66 26 48.7(0.5) | 12.8 | 45.3 | 179.4( 43.) | 2.8x0p=101 | 0.2468e |
| 13004 | 15 42 03.82(0.06) | 66 26 31.8(0.4) | 12.6 | 80.4 | 458.6( 60.) | 4.3x0p=151 | 0.2458e |
| 13008 | 15 42 12.07(0.09) | 66 19 07.0(0.6) | 7.1 | 34.0 | 89.5( 28.) | 3.2x0p=121 | 0.2501e |
| 13015 | 15 42 24.27(0.05) | 66 19 58.3(0.3) | 8.6 | 141.7 | 231.2( 17.) | 1.3x0p=127 | 0.2473 |
| 13702 | 15 42 49.60(0.07) | 66 21 33.2(0.4) | 11.6 | 71.5 | 224.4( 40.) | 6.6x4.1p=175 | 0.2390 |
| 19061 | 15 43 07.80(0.08) | 66 13 41.4(0.5) | 11.5 | 46.5 | 129.0( 29.) | 2.0x0p=72 | 0.2394e |
| Spec Type | Number | SFR | Timescale |
|---|---|---|---|
| Burst | 1 | Single Burst | — |
| E | 2 | Exponential | Gyr |
| S0 | 3 | Exponential | Gyr |
| Sa | 4 | Exponential | Gyr |
| Sb | 5 | Exponential | Gyr |
| Sc | 6 | Exponential | Gyr |
| Sd | 7 | Exponential | Gyr |
| Im | 8 | Constant | — |
| Name | U | B | V | R | I | 8010 | 9170 | J | H | K |
|---|---|---|---|---|---|---|---|---|---|---|
| 17017 | 22.08 | 20.65 | 19.36 | 18.45 | 17.93 | 17.94 | 17.50 | |||
| 23009 | 22.71 | 21.38 | 20.08 | 19.10 | 18.47 | 18.44 | 18.05 | |||
| 23016 | 22.30 | 21.00 | 19.74 | 18.84 | 18.39 | 18.35 | 17.99 | |||
| 18013 | 23.14 | 21.95 | 20.92 | 20.12 | 19.71 | 19.73 | 19.33 | |||
| 11700 | 22.99 | 21.84 | 20.81 | 19.98 | 19.53 | 19.57 | 19.20 | |||
| 18023 | 22.39 | 21.01 | 19.72 | 18.76 | 18.19 | 18.22 | 17.78 | |||
| 24007 | 22.70 | 21.57 | 20.57 | 19.66 | 19.10 | 19.17 | 18.88 | |||
| 24012 | 22.33 | 21.29 | 20.21 | 19.30 | 18.79 | 18.74 | 18.39 | 17.94 | 17.50 | 17.36 |
| 18700 | 21.89 | 20.51 | 19.15 | 18.23 | 17.73 | 17.73 | 17.32 | 16.83 | 16.60 | 16.50 |
| 24015 | 21.77 | 20.99 | 20.05 | 19.32 | 18.91 | 18.86 | 18.61 | 18.24 | 17.97 | 17.92 |
| 18030 | 23.43 | 22.00 | 20.83 | 19.92 | 19.47 | 19.48 | 19.08 | 18.51 | 18.20 | 18.04 |
| 24016 | 21.08 | 20.01 | 18.87 | 17.97 | 17.47 | 17.47 | 17.11 | 16.62 | 16.42 | 16.32 |
| 18033 | 20.94 | 20.31 | 19.55 | 18.90 | 18.49 | 18.54 | 18.22 | 17.74 | 17.54 | 17.33 |
| 18072 | 21.91 | 20.43 | 19.13 | 18.19 | 17.65 | 17.75 | 17.22 | 16.81 | 16.61 | 16.51 |
| 24027 | 21.99 | 20.54 | 19.18 | 18.22 | 17.66 | 17.69 | 17.26 | 16.70 | 16.42 | 16.29 |
| 24030 | 22.24 | 21.48 | 20.59 | 19.89 | 19.50 | 19.49 | 19.18 | 19.03 | 18.73 | 18.76 |
| 18041 | 21.64 | 20.12 | 18.75 | 17.78 | 17.26 | 17.31 | 16.89 | 16.41 | 16.23 | 16.07 |
| 18071 | 21.92 | 20.75 | 19.60 | 18.75 | 18.26 | 18.35 | 17.90 | 17.33 | 17.01 | 16.95 |
| 18042 | 22.02 | 20.54 | 19.21 | 18.24 | 17.75 | 17.80 | 17.39 | 16.85 | 16.63 | 16.49 |
| 24111 | 21.27 | 20.74 | 20.10 | 19.61 | 19.52 | 19.56 | 19.22 | 18.93 | 18.82 | 18.67 |
| 18045 | 20.85 | 20.41 | 19.86 | 19.44 | 19.34 | 19.40 | 19.18 | 18.94 | 18.77 | 18.93 |
| 18047 | 21.15 | 20.64 | 20.01 | 19.51 | 19.29 | 19.36 | 19.10 | 18.80 | 18.72 | 18.63 |
| 18048 | 20.73 | 20.10 | 19.37 | 18.78 | 18.39 | 18.44 | 18.13 | 17.74 | 17.49 | 17.44 |
| 24701 | 22.33 | 20.99 | 19.66 | 18.70 | 18.24 | 18.26 | 17.91 | 17.26 | 17.08 | 16.96 |
| 18702 | 21.05 | 20.41 | 19.67 | 19.03 | 18.71 | 18.72 | 18.47 | 18.13 | 18.01 | 17.97 |
| 24033 | 22.04 | 20.61 | 19.27 | 18.31 | 17.79 | 17.82 | 17.47 | 16.87 | 16.61 | 16.50 |
| 18703 | 22.25 | 20.88 | 19.60 | 18.69 | 18.20 | 18.24 | 17.88 | 17.29 | 17.05 | 17.00 |
| 05012 | 21.96 | 20.77 | 19.68 | 18.81 | 18.30 | 18.32 | 17.87 | |||
| 18070 | 22.23 | 21.70 | 21.06 | 20.48 | 20.39 | 20.42 | 20.10 | 19.88 | 19.56 | 19.47 |
| 24115 | 22.47 | 21.00 | 19.73 | 18.80 | 18.35 | 18.32 | 17.97 | 17.56 | 17.36 | 17.20 |
| 18056 | 21.90 | 21.02 | 20.03 | 19.25 | 18.80 | 18.88 | 18.48 | 17.92 | 17.75 | 17.45 |
| 18057 | 21.85 | 20.55 | 19.28 | 18.34 | 17.81 | 17.89 | 17.41 | 16.96 | 16.72 | 16.58 |
| 18300 | 21.68 | 21.10 | 20.29 | 19.76 | 19.51 | 19.65 | 19.45 | 18.96 | 18.82 | 18.80 |
| 18060 | 21.42 | 20.58 | 19.58 | 18.80 | 18.40 | 18.48 | 18.12 | 17.58 | 17.42 | 17.17 |
| 18061 | 21.60 | 20.51 | 19.38 | 18.51 | 18.05 | 18.07 | 17.72 | 17.33 | 17.09 | 16.93 |
| 18062 | 22.04 | 21.36 | 20.56 | 19.90 | 19.65 | 19.59 | 19.34 | 18.71 | 18.40 | 18.06 |
| 25001 | 21.69 | 20.47 | 19.25 | 18.38 | 17.87 | 17.90 | 17.53 | 17.06 | 16.77 | 16.64 |
| 00002 | 22.09 | 20.55 | 19.25 | 18.31 | 17.82 | 17.88 | 17.53 | 17.15 | 16.81 | 16.68 |
| 00600 | 22.57 | 21.77 | 20.86 | 20.11 | 19.73 | 19.80 | 19.46 | 18.76 | 18.85 | 18.56 |
| 12004 | 21.87 | 21.19 | 20.50 | 19.86 | 19.50 | 19.44 | 19.26 | |||
| 00007 | 20.79 | 20.25 | 19.62 | 19.05 | 18.73 | 18.76 | 18.24 | 18.33 | 18.14 | 17.98 |
| 12007 | 21.93 | 21.01 | 20.03 | 19.26 | 18.80 | 18.84 | 18.46 | 18.09 | 17.75 | 17.71 |
| 25100 | 21.08 | 20.39 | 19.58 | 18.93 | 18.50 | 18.49 | 18.22 | |||
| 25010 | 23.10 | 22.12 | 21.08 | 20.23 | 19.70 | 19.87 | 19.47 | 18.77 | 18.30 | 18.04 |
| 00700 | 22.68 | 21.79 | 20.82 | 19.95 | 19.61 | 19.66 | 19.18 | 18.86 | 18.64 | 18.60 |
| 00014 | 22.77 | 21.73 | 20.57 | 19.59 | 19.26 | 19.23 | 18.83 | 18.09 | 17.73 | 17.57 |
| 25702 | 21.32 | 20.28 | 19.12 | 18.27 | 17.72 | 17.78 | 17.42 | |||
| 00104 | 22.31 | 20.91 | 19.62 | 18.72 | 18.24 | 18.28 | 17.89 | 17.50 | 17.20 | 17.24 |
| 00020 | 21.38 | 20.63 | 19.84 | 19.14 | 18.72 | 18.83 | 18.51 | 17.89 | 17.66 | 17.65 |
| 00022 | 21.83 | 21.22 | 20.42 | 19.77 | 19.57 | 19.53 | 19.33 | 18.54 | 18.25 | 18.08 |
| 25015 | 22.35 | 21.39 | 20.37 | 19.59 | 19.11 | 19.03 | 18.72 | |||
| 00026 | 22.65 | 21.97 | 20.92 | 19.93 | 19.30 | 19.35 | 18.94 | 18.30 | 17.93 | 17.82 |
| 00027 | 21.40 | 20.49 | 19.47 | 18.63 | 18.20 | 18.18 | 17.84 | 17.26 | 16.98 | 16.85 |
| 00028 | 22.83 | 21.33 | 20.03 | 19.07 | 18.62 | 18.61 | 18.21 | 17.69 | 17.42 | 17.39 |
| 12027 | 21.80 | 20.52 | 19.33 | 18.46 | 17.99 | 17.96 | 17.59 | |||
| 00031 | 22.19 | 21.46 | 20.57 | 19.85 | 19.49 | 19.68 | 19.26 | 18.69 | 18.41 | 18.36 |
| 00034 | 21.68 | 20.27 | 18.99 | 18.07 | 17.56 | 17.62 | 17.23 | 16.68 | 16.38 | 16.32 |
| 00039 | 21.42 | 19.96 | 18.64 | 17.70 | 17.16 | 17.23 | 16.80 | 16.24 | 15.95 | 15.90 |
| 00201 | 21.96 | 21.30 | 20.52 | 19.87 | 19.61 | 19.64 | 19.34 | 18.74 | 18.55 | 18.57 |
| 12033 | 21.05 | 20.19 | 19.23 | 18.45 | 18.05 | 17.95 | 17.67 | 17.15 | 16.84 | 16.79 |
| 00047 | 20.76 | 20.20 | 19.55 | 18.92 | 18.67 | 18.67 | 18.40 | 17.80 | 17.47 | 17.38 |
| 00703 | 23.08 | 21.70 | 20.51 | 19.54 | 19.30 | 19.31 | 18.94 | 18.25 | 17.98 | 17.94 |
| 00051 | 22.04 | 21.34 | 20.57 | 19.94 | 19.61 | 19.74 | 19.38 | 18.84 | 18.78 | 18.80 |
| 00057 | 21.20 | 19.72 | 18.40 | 17.42 | 16.90 | 16.94 | 16.54 | 16.00 | 15.69 | 15.66 |
| 00105 | 21.25 | 19.78 | 18.42 | 17.47 | 16.92 | 16.99 | 16.54 | 16.00 | 15.70 | 15.65 |
| 00106 | 21.74 | 20.30 | 18.90 | 18.01 | 17.46 | 17.49 | 17.11 | 16.75 | 16.43 | 16.44 |
| 00060 | 21.29 | 20.44 | 19.50 | 18.74 | 18.31 | 18.34 | 17.99 | 17.48 | 17.23 | 17.13 |
| 00701 | 22.36 | 21.19 | 19.94 | 18.99 | 18.55 | 18.60 | 18.16 | 17.49 | 17.19 | 17.13 |
| 25701 | 21.86 | 20.50 | 19.25 | 18.35 | 17.84 | 17.83 | 17.53 | 17.11 | 16.86 | 16.70 |
| 12068 | 22.34 | 21.77 | 20.94 | 20.13 | 19.93 | 19.96 | 20.20 | 19.30 | 19.15 | 18.77 |
| 00077 | 22.81 | 21.87 | 20.93 | 20.15 | 20.09 | 19.97 | 19.64 | 18.93 | 18.55 | 18.29 |
| 06008 | 21.02 | 19.62 | 18.35 | 17.46 | 16.91 | 16.95 | 16.48 | |||
| 12058 | 23.21 | 21.85 | 20.64 | 19.68 | 19.18 | 19.10 | 18.81 | 18.33 | 17.73 | 18.20 |
| 12100 | 23.30 | 22.18 | 21.06 | 20.20 | 19.78 | 19.72 | 19.56 | 18.94 | 18.40 | 18.19 |
| 00084 | 23.57 | 22.53 | 21.63 | 20.84 | 20.44 | 20.44 | 20.19 | 19.46 | 19.06 | 18.95 |
| 00085 | 21.83 | 21.16 | 20.39 | 19.78 | 19.58 | 19.57 | 19.30 | 18.83 | 18.63 | 18.63 |
| 12702 | 20.89 | 20.21 | 19.48 | 18.83 | 18.44 | 18.38 | 18.20 | |||
| 00089 | 22.20 | 20.91 | 19.47 | 18.73 | 18.25 | 18.18 | 17.85 | 17.30 | 17.05 | 17.03 |
| 00704 | 21.74 | 20.68 | 19.52 | 18.60 | 18.13 | 18.19 | 17.79 | 17.21 | 16.92 | 16.94 |
| 12061 | 22.54 | 21.65 | 20.68 | 19.93 | 19.45 | 19.49 | 19.15 | -9.00 | -9.00 | -9.00 |
| 00705 | 22.51 | 21.18 | 19.96 | 19.04 | 18.61 | 18.58 | 18.23 | 17.63 | 17.33 | 17.35 |
| 00098 | 22.30 | 21.25 | 20.16 | 19.29 | 18.84 | 18.77 | 18.43 | 17.81 | 17.52 | 17.43 |
| 13700 | 22.08 | 21.30 | 20.37 | 19.61 | 19.21 | 19.25 | 18.86 | 18.39 | 18.05 | 18.02 |
| 19011 | 22.60 | 21.51 | 20.38 | 19.46 | 18.97 | 18.88 | 18.58 | 17.83 | 17.42 | 17.35 |
| 13003 | 21.89 | 21.02 | 20.06 | 19.25 | 18.78 | 18.78 | 18.40 | |||
| 13004 | 22.09 | 21.17 | 20.17 | 19.31 | 18.68 | 18.70 | 18.26 | |||
| 13008 | 21.67 | 20.89 | 20.01 | 19.27 | 18.91 | 18.87 | 18.58 | 18.02 | 17.77 | 17.64 |
| 13015 | 21.89 | 20.45 | 19.15 | 18.19 | 17.69 | 17.69 | 17.28 | 17.03 | 16.75 | 16.58 |
| 13702 | 22.33 | 20.98 | 19.75 | 18.82 | 18.30 | 18.31 | 17.89 | |||
| 19061 | 21.34 | 20.68 | 20.00 | 19.42 | 19.05 | 18.88 | 18.80 |
| Name | Size | ) | Proj Dist | Spec T. | Age | z | ||
|---|---|---|---|---|---|---|---|---|
| kpc | W/Hz | Mpc | mag | Gyrs | mag | |||
| 17017 | 8.4 | 22.40 | 3.7 | -22.1 | 1 | 2.6 | 0.8 | 0.2475 |
| 23009 | 15.7 | 22.70 | 3.43 | -21.6 | 2 | 5.5 | 1.2 | 0.2575 |
| 23016 | 95.8 | 25.00 | 2.93 | -21.8 | 2 | 6.5 | 0.6 | 0.2449 |
| 18013 | 5.0 | 22.41 | 2.38 | -20.5 | 1 | 2.0 | 0.2 | 0.2449e |
| 11700 | 9.6 | 21.95 | 2.40 | -20.7 | 2 | 6.5 | 0.0 | 0.2442e |
| 18023 | 4.6 | 22.51 | 2.12 | -21.9 | 1 | 2.0 | 1.0 | 0.2448 |
| 24007 | 3.8 | 22.79 | 3.00 | -21.2 | 2 | 5.5 | 0.4 | 0.2468e |
| 24012 | 6.1 | 22.46 | 2.48 | -21.3 | 3 | 9.5 | 0.6 | 0.2445e |
| 18700 | 6.9 | 21.82 | 1.74 | -22.4 | 2 | 9.5 | 0.2 | 0.2458 |
| 24015 | 10.0 | 22.28 | 2.00 | -21.4 | 2 | 4.5 | 0.2 | 0.2408e |
| 18030 | 3.4 | 22.15 | 1.76 | -20.8 | 1 | 1.7 | 0.8 | 0.2482e |
| 24016 | 13.8 | 22.66 | 2.07 | -22.6 | 3 | 11.5 | 0.2 | 0.2458 |
| 18033 | 7.7 | 22.77 | 1.79 | -21.8 | 5 | 11.5 | 0.4 | 0.2458e |
| 18072 | 379.2 | 24.25 | 1.54 | -22.4 | 1 | 7.5 | 0.2 | 0.2459 |
| 24027 | 17.6 | 23.21 | 1.83 | -22.5 | 1 | 4.5 | 0.6 | 0.2425 |
| 24030 | 7.3 | 22.14 | 1.81 | -20.8 | 2 | 4.5 | 0.0 | 0.2436e |
| 18041 | 8.8 | 22.82 | 1.54 | -22.9 | 1 | 11.5 | 0.0 | 0.2455 |
| 18701 | 32.6 | 22.40 | 1.32 | -21.8 | 2 | 5.5 | 0.6 | 0.2477 |
| 18042 | 2.7 | 22.74 | 1.50 | -22.4 | 2 | 9.5 | 0.2 | 0.2458 |
| 24111 | 21.1 | 22.26 | 1.74 | -20.8 | 2 | 1.7 | 0.4 | 0.2460e |
| 18045 | 6.1 | 22.02 | 1.50 | -21.1 | 1 | 0.1 | 0.8 | 0.2458e |
| 18047 | 8.4 | 22.23 | 1.28 | -21.1 | 4 | 5.5 | 0.0 | 0.2433e |
| 18048 | 6.5 | 22.75 | 1.55 | -21.9 | 5 | 11.5 | 0.2 | 0.2455e |
| 24701 | 7.3 | 21.83 | 1.60 | -22.0 | 2 | 8.5 | 0.2 | 0.2559 |
| 18702 | 10.3 | 21.80 | 1.51 | -21.6 | 3 | 6.5 | 0.0 | 0.2443e |
| 24033 | 7.3 | 21.91 | 1.60 | -22.4 | 1 | 5.5 | 0.4 | 0.2565 |
| 18703 | 9.6 | 21.75 | 1.05 | -22.0 | 2 | 8.5 | 0.2 | 0.2500 |
| 05012 | 6.9 | 22.86 | 3.06 | -21.8 | 2 | 5.5 | 0.6 | 0.2573 |
| 18070 | 5.7 | 21.93 | 0.98 | -20.0 | 3 | 3.5 | 0.2 | 0.2475e |
| 24115 | 5.0 | 21.98 | 2.04 | -21.8 | 1 | 8.5 | 0.0 | 0.2421 |
| 18056 | 3.4 | 22.52 | 1.19 | -21.3 | 3 | 7.5 | 0.6 | 0.2456e |
| 18057 | 4.6 | 22.40 | 1.09 | -22.2 | 2 | 7.5 | 0.4 | 0.2494e |
| 18300 | 7.7 | 21.69 | 1.15 | -21.0 | 2 | 2.6 | 0.2 | 0.2458e |
| 18060 | 10.0 | 22.52 | 1.14 | -21.9 | 2 | 4.5 | 0.4 | 0.2474e |
| 18061 | 11.9 | 22.22 | 0.95 | -22.2 | 3 | 11.5 | 0.0 | 0.2430 |
| 18062 | 7.3 | 22.40 | 0.91 | -20.7 | 3 | 1.0 | 1.6 | 0.2444e |
| 25001 | 18.8 | 22.38 | 1.68 | -22.3 | 1 | 2.0 | 0.6 | 0.2530e |
| 00002 | 3.4 | 22.42 | 0.89 | -22.4 | 1 | 8.5 | 0.0 | 0.2548 |
| 00600 | 5.7 | 21.82 | 1.07 | -20.6 | 4 | 10.5 | 0.2 | 0.2423e |
| 12004 | 6.5 | 22.06 | 1.78 | -20.9 | 4 | 9.5 | 0.0 | 0.2381e |
| 00007 | 10.3 | 22.40 | 0.92 | -21.6 | 3 | 5.5 | 0.0 | 0.2462e |
| 12007 | 11.9 | 22.10 | 1.05 | -21.4 | 2 | 4.5 | 0.4 | 0.2429e |
| 25100 | 18.4 | 22.55 | 2.35 | -21.8 | 5 | 10.5 | 0.6 | 0.2521e |
| 25010 | 2.7 | 22.65 | 1.31 | -20.5 | 2 | 2.3 | 1.6 | 0.2558 |
| 00700 | 8.0 | 21.83 | 0.59 | -20.6 | 3 | 9.5 | 0.0 | 0.2469 |
| 00014 | 21.1 | 22.49 | 0.81 | -20.9 | 2 | 4.5 | 1.0 | 0.2423 |
| 25702 | 42.1 | 22.85 | 2.19 | -22.4 | 3 | 10.5 | 0.4 | 0.2561 |
| 00104 | 95.8 | 24.43 | 0.76 | -22.0 | 1 | 7.5 | 0.0 | 0.2433 |
| 00020 | 17.2 | 22.39 | 0.57 | -21.6 | 4 | 8.5 | 0.4 | 0.2419e |
| 00022 | 5.7 | 22.50 | 0.84 | -20.8 | 2 | 0.7 | 1.6 | 0.2588e |
| 25015 | 3.8 | 22.41 | 2.16 | -21.1 | 2 | 4.5 | 0.6 | 0.2508e |
| 00026 | 2.7 | 22.55 | 1.01 | -20.9 | 4 | 10.5 | 1.0 | 0.2484e |
| 00027 | 3.1 | 22.72 | 0.50 | -22.1 | 2 | 4.5 | 0.6 | 0.2460e |
| 00028 | 4.2 | 21.97 | 0.44 | -21.5 | 1 | 7.5 | 0.2 | 0.2486 |
| 12027 | 11.9 | 22.71 | 2.18 | -22.2 | 1 | 2.0 | 0.6 | 0.2463 |
| 00031 | 10.3 | 22.21 | 0.40 | -20.7 | 2 | 2.3 | 1.0 | 0.2545e |
| 00034 | 3.8 | 21.85 | 0.68 | -22.6 | 1 | 3.5 | 0.4 | 0.2395 |
| 00039 | 3.1 | 22.54 | 0.30 | -23.0 | 1 | 5.5 | 0.4 | 0.2457 |
| 00201 | 20.7 | 22.09 | 0.57 | -20.6 | 2 | 2.6 | 0.6 | 0.2454e |
| 12033 | 16.1 | 22.32 | 0.78 | -22.1 | 4 | 11.5 | 0.4 | 0.2406e |
| 00047 | 53.6 | 24.59 | 0.14 | -21.7 | 8 | 3.5 | 1.0 | 0.2528e |
| 00703 | 24.1 | 22.42 | 0.17 | -20.9 | 1 | 1.4 | 0.8 | 0.2494 |
| 00051 | 9.6 | 21.96 | 0.65 | -20.6 | 4 | 9.5 | 0.0 | 0.2473e |
| 00057 | 10.7 | 23.69 | 0.03 | -23.3 | 1 | 5.5 | 0.4 | 0.2518 |
| 00105 | 15.3 | 23.06 | 0.03 | -23.1 | 1 | 7.5 | 0.4 | 0.2470 |
| 00106 | 88.1 | 24.42 | 0.02 | -22.7 | 1 | 9.5 | 0.0 | 0.2466 |
| 00060 | 11.1 | 22.27 | 0.34 | -22.0 | 3 | 7.5 | 0.4 | 0.2422e |
| 00701 | 8.8 | 21.61 | 0.13 | -21.6 | 3 | 11.5 | 0.4 | 0.2480 |
| 25701 | 5.0 | 21.74 | 1.47 | -22.4 | 1 | 4.5 | 0.2 | 0.2454 |
| 12068 | 5.4 | 22.05 | 1.10 | -20.5 | 2 | 2.3 | 0.6 | 0.2484e |
| 00077 | 6.1 | 22.35 | 0.44 | -20.2 | 1 | 0.2 | 1.8 | 0.2516e |
| 06008 | 4.6 | 22.77 | 3.06 | -23.1 | 1 | 2.3 | 0.8 | 0.2369 |
| 12058 | 3.4 | 22.40 | 1.43 | -21.0 | 1 | 5.5 | 0.2 | 0.2514 |
| 12100 | 11.1 | 22.24 | 1.43 | -20.5 | 2 | 4.5 | 0.8 | 0.2488e |
| 00084 | 4.6 | 22.14 | 0.52 | -19.8 | 2 | 2.6 | 1.2 | 0.2397e |
| 00085 | 14.2 | 22.39 | 0.67 | -20.9 | 2 | 2.6 | 0.4 | 0.2517 |
| 12702 | 11.9 | 22.04 | 2.30 | -21.9 | 5 | 11.5 | 0.4 | 0.2398e |
| 00089 | 5.4 | 22.41 | 0.57 | -21.8 | 2 | 8.5 | 0.2 | 0.2518 |
| 00704 | 31.0 | 22.70 | 0.64 | -22.0 | 3 | 11.5 | 0.2 | 0.2547 |
| 12061 | 3.4 | 22.40 | 2.06 | -20.9 | 2 | 4.5 | 0.4 | 0.2492e |
| 00705 | 35.6 | 22.51 | 0.78 | -21.6 | 1 | 2.3 | 0.6 | 0.2444 |
| 00098 | 3.4 | 22.10 | 0.99 | -21.3 | 2 | 4.5 | 0.8 | 0.2473e |
| 13700 | 5.4 | 21.77 | 1.12 | -20.9 | 4 | 10.5 | 0.4 | 0.2534 |
| 19011 | 17.6 | 22.07 | 0.94 | -21.2 | 2 | 4.5 | 1.0 | 0.2412e |
| 13003 | 10.7 | 22.48 | 2.36 | -21.4 | 4 | 9.5 | 0.8 | 0.2468e |
| 13004 | 16.5 | 22.89 | 2.31 | -21.5 | 5 | 7.5 | 1.8 | 0.2458e |
| 13008 | 12.3 | 22.18 | 1.29 | -21.4 | 4 | 9.5 | 0.4 | 0.2501e |
| 13015 | 5.0 | 22.59 | 1.59 | -22.4 | 1 | 9.5 | 0.0 | 0.2473 |
| 13702 | 25.3 | 22.58 | 2.18 | -21.8 | 1 | 2.0 | 0.8 | 0.2390 |
| 19061 | 7.7 | 22.34 | 2.29 | -21.4 | 5 | 11.5 | 0.2 | 0.2394e |
| Name | RA(2000.0) | Dec(2000.0) | X Name | Abs mag | z | ||
|---|---|---|---|---|---|---|---|
| 24016 | 15 39 52.60 | 66 09 54.1 | X014 | 41.9 | 22.66 | -22.6 | 0.2458 |
| 24027 | 15 40 05.34 | 66 10 12.9 | X022 | 41.7 | 23.21 | -22.5 | 0.2425 |
| 18041 | 15 40 09.11 | 66 12 17.1 | X025 | 41.7 | 22.82 | -22.9 | 0.2455 |
| 24701 | 15 40 16.49 | 66 10 39.7 | X033 | 41.7 | 21.83 | -22.0 | 0.2559 |
| 00034 | 15 41 00.37 | 66 19 02.8 | X063 | 41.6 | 21.85 | -22.6 | 0.2395 |
| 00039 | 15 41 01.94 | 66 16 26.5 | X065 | 42.1 | 22.54 | -23.0 | 0.2457 |
| 00047 | 15 41 09.73 | 66 15 44.5 | X068 | 41.7 | 24.59 | -21.7 | 0.2528e |
| 00704 | 15 41 43.39 | 66 14 19.1 | X087 | 41.7 | 22.70 | -22.0 | 0.2547 |
| Name | RA(2000.0) | Dec(2000.0) | X band | X class | Abs mag | z | ||
|---|---|---|---|---|---|---|---|---|
| 18030 | 15 39 52.47 | 66 13 18.5 | 41.1 | S | d | 22.15 | -20.8 | 0.2482e |
| 18700 | 15 39 50.14 | 66 14 54.7 | 41.4 | B | p | 21.82 | -22.4 | 0.2458 |
| 18701 | 15 40 10.34 | 66 15 46.2 | 40.9 | S | p | 22.40 | -21.8 | 0.2477 |
| 18045 | 15 40 13.98 | 66 11 50.7 | 41.3 | B | e | 22.02 | -21.1 | 0.2458e |
| 18048 | 15 40 15.84 | 66 11 09.9 | 40.9 | S | ? | 22.75 | -21.9 | 0.2455e |
| 18702 | 15 40 17.14 | 66 11 15.9 | 41.2 | B | ? | 21.80 | -21.6 | 0.2443e |
| 24033 | 15 40 21.42 | 66 10 12.1 | 41.3 | B | e | 21.91 | -22.4 | 0.2565 |
| 00022 | 15 40 52.63 | 66 12 30.4 | 40.8 | B | p | 22.50 | -20.8 | 0.2588e |
| 00026 | 15 40 54.49 | 66 11 27.4 | 41.3 | S | p | 22.55 | -20.9 | 0.2484e |
| 00027 | 15 40 54.67 | 66 17 15.7 | 41.3 | B | p | 22.72 | -22.1 | 0.2460e |
| 00051 | 15 41 11.59 | 66 12 47.9 | 40.9 | S | ? | 21.96 | -20.6 | 0.2473e |
| 00057 | 15 41 14.37 | 66 15 57.1 | 41.6 | B | d | 23.69 | -23.3 | 0.2518 |
Note. — col 1: radio source name, col 2-3 R.A., Dec (2000.0), col 4: log keV X-ray luminosity, col 5: log 20cm radio luminosity, col 6: X-ray band in which detection was made: S:soft(0.5–2.0 keV), B:both(0.5–8.0 keV), col 7: detection class: d: diffuse feature, e: clearly extended, p: point-like, ?: too faint to make a classification, col 8: absolute R magnitude, col 9: redshift (Miller et al., 2004)
| Name | Align | Mag | Emis | Age | Dust | Total | |
|---|---|---|---|---|---|---|---|
| 17017 | 0.5 | 0.0 | 0.0 | 0.0 | 0.5 | 0.5 | 1.5 |
| 23009 | 0.0 | 1.0 | 0.0 | 0.0 | 0.0 | 1.0 | 2.0 |
| 23016 | 0.0 | 0.0 | 0.0 | 0.0 | 0.5 | 0.0 | 0.5 |
| 18013 | 0.5 | 0.0 | 0.5 | 1.0 | 0.5 | 0.0 | 2.5 |
| 11700 | 0.5 | 0.0 | 0.5 | 1.0 | 0.0 | 0.0 | 2.0 |
| 18023 | 0.5 | 0.0 | 0.0 | 0.0 | 0.5 | 1.0 | 2.0 |
| 24007 | 0.0 | 1.0 | 0.0 | 1.0 | 0.0 | 0.0 | 2.0 |
| 24012 | 0.5 | 1.0 | 0.0 | 1.0 | 0.0 | 0.5 | 3.0 |
| 18700 | 0.5 | 0.0 | 0.0 | 0.0 | 0.0 | 0.0 | 0.5 |
| 24015 | 0.5 | 1.0 | 0.0 | 1.0 | 0.5 | 0.0 | 3.0 |
| 18030 | 0.5 | 0.0 | 0.5 | 1.0 | 0.5 | 0.5 | 3.0 |
| 24016 | 0.5 | 0.0 | 0.0 | 0.0 | 0.0 | 0.0 | 0.5 |
| 18033 | 0.0 | 1.0 | 0.0 | 1.0 | 0.0 | 0.0 | 2.0 |
| 18072 | 0.0 | 0.0 | 0.0 | 0.0 | 0.0 | 0.0 | 0.0 |
| 24027 | 0.0 | 0.0 | 0.0 | 0.0 | 0.5 | 0.5 | 1.0 |
| 24030 | 0.5 | 1.0 | 0.5 | 1.0 | 0.5 | 0.0 | 3.5 |
| 18041 | 0.0 | 0.0 | 0.0 | 0.0 | 0.0 | 0.0 | 0.0 |
| 18701 | 0.5 | 1.0 | 0.0 | 0.0 | 0.0 | 0.5 | 2.0 |
| 18042 | 0.0 | 0.0 | 0.0 | 0.0 | 0.0 | 0.0 | 0.0 |
| 24111 | 0.5 | 1.0 | 0.5 | 1.0 | 0.5 | 0.0 | 3.5 |
| 18045 | 0.5 | 0.0 | 0.0 | 1.0 | 1.0 | 0.5 | 3.0 |
| 18047 | 0.5 | 1.0 | 0.0 | 1.0 | 0.0 | 0.0 | 2.5 |
| 18048 | 0.0 | 1.0 | 0.0 | 1.0 | 0.0 | 0.0 | 2.0 |
| 24701 | 0.5 | 0.0 | 0.0 | 0.0 | 0.0 | 0.0 | 0.5 |
| 18702 | 0.5 | 1.0 | 0.0 | 1.0 | 0.0 | 0.0 | 2.5 |
| 24033 | 0.5 | 0.0 | 0.0 | 0.0 | 0.0 | 0.0 | 0.5 |
| 18703 | 0.5 | 1.0 | 0.0 | 0.0 | 0.0 | 0.0 | 1.5 |
| 05012 | 0.0 | 1.0 | 0.0 | 0.0 | 0.0 | 0.5 | 1.5 |
| 18070 | 0.5 | 0.0 | 0.5 | 1.0 | 0.5 | 0.0 | 2.5 |
| 24115 | 0.5 | 0.0 | 0.0 | 0.0 | 0.0 | 0.0 | 0.5 |
| 18056 | 0.5 | 1.0 | 0.0 | 1.0 | 0.0 | 0.0 | 2.5 |
| 18057 | 0.5 | 1.0 | 0.0 | 1.0 | 0.0 | 0.0 | 2.5 |
| 18300 | 0.5 | 0.0 | 0.5 | 1.0 | 0.5 | 0.0 | 2.5 |
| 18060 | 0.5 | 1.0 | 0.0 | 1.0 | 0.5 | 0.0 | 3.0 |
| 18061 | 0.5 | 0.0 | 0.0 | 0.0 | 0.0 | 0.0 | 0.5 |
| 18062 | 0.5 | 0.0 | 0.5 | 1.0 | 1.0 | 1.0 | 4.0 |
| 25001 | 0.5 | 0.0 | 0.0 | 1.0 | 0.5 | 0.5 | 2.5 |
| 00002 | 0.5 | 0.0 | 0.0 | 0.0 | 0.0 | 0.0 | 0.5 |
| 00600 | 0.5 | 0.0 | 0.5 | 1.0 | 0.0 | 0.0 | 2.0 |
| 12004 | 0.5 | 1.0 | 0.5 | 1.0 | 0.0 | 0.0 | 3.0 |
| 00007 | 0.5 | 1.0 | 0.0 | 1.0 | 0.0 | 0.0 | 2.5 |
| 12007 | 0.5 | 1.0 | 0.0 | 1.0 | 0.5 | 0.0 | 3.0 |
| 25100 | 0.5 | 0.0 | 0.0 | 1.0 | 0.0 | 0.5 | 2.0 |
| 25010 | 0.5 | 0.0 | 0.5 | 0.0 | 0.5 | 1.0 | 2.5 |
| 00700 | 0.5 | 0.0 | 0.5 | 0.0 | 0.0 | 0.0 | 1.0 |
| 00014 | 0.5 | 1.0 | 0.5 | 0.0 | 0.5 | 1.0 | 3.5 |
| 25702 | 0.0 | 0.0 | 0.0 | 0.0 | 0.0 | 0.0 | 0.0 |
| 00104 | 0.0 | 0.0 | 0.0 | 0.0 | 0.0 | 0.0 | 0.0 |
| 00020 | 0.5 | 1.0 | 0.0 | 1.0 | 0.0 | 0.0 | 2.5 |
| 00022 | 0.5 | 0.0 | 0.5 | 1.0 | 1.0 | 1.0 | 4.0 |
| 25015 | 0.5 | 0.0 | 0.0 | 1.0 | 0.5 | 0.5 | 2.5 |
| 00026 | 0.5 | 0.0 | 0.5 | 1.0 | 0.0 | 1.0 | 3.0 |
| 00027 | 0.0 | 0.0 | 0.0 | 1.0 | 0.5 | 0.5 | 2.0 |
| 00028 | 0.5 | 0.0 | 0.0 | 0.0 | 0.0 | 0.0 | 0.5 |
| 12027 | 0.0 | 1.0 | 0.0 | 0.0 | 0.5 | 0.5 | 2.0 |
| 00031 | 0.5 | 1.0 | 0.5 | 1.0 | 0.5 | 1.0 | 4.5 |
| 00034 | 0.0 | 0.0 | 0.0 | 0.0 | 0.5 | 0.0 | 1.0 |
| 00039 | 0.5 | 0.0 | 0.0 | 0.0 | 0.0 | 0.0 | 0.5 |
| 00201 | 0.5 | 0.0 | 0.5 | 1.0 | 0.5 | 0.5 | 3.0 |
| 12033 | 0.5 | 1.0 | 0.0 | 1.0 | 0.0 | 0.0 | 2.5 |
| 00047 | 0.0 | 1.0 | 0.0 | 1.0 | 0.5 | 1.0 | 3.5 |
| 00703 | 0.5 | 0.0 | 0.5 | 0.0 | 0.5 | 0.5 | 2.0 |
| 00051 | 0.5 | 0.0 | 0.5 | 1.0 | 0.0 | 0.0 | 2.0 |
| 00057 | 0.0 | 0.0 | 0.0 | 0.0 | 0.0 | 0.0 | 0.0 |
| 00105 | 0.0 | 0.0 | 0.0 | 0.0 | 0.0 | 0.0 | 0.0 |
| 00106 | 0.0 | 0.0 | 0.0 | 0.0 | 0.0 | 0.0 | 0.0 |
| 00060 | 0.5 | 1.0 | 0.0 | 1.0 | 0.0 | 0.0 | 2.5 |
| 00701 | 0.5 | 0.0 | 0.0 | 0.0 | 0.0 | 0.0 | 0.5 |
| 25701 | 0.5 | 0.0 | 0.0 | 0.0 | 0.5 | 0.0 | 1.0 |
| 12068 | 0.5 | 0.0 | 0.5 | 1.0 | 0.5 | 0.5 | 3.0 |
| 00077 | 0.5 | 1.0 | 0.5 | 1.0 | 1.0 | 0.5 | 5.0 |
| 06008 | 0.0 | 0.0 | 0.0 | 0.0 | 0.5 | 0.5 | 1.0 |
| 12058 | 0.5 | 0.0 | 0.0 | 0.0 | 0.0 | 0.0 | 0.5 |
| 12100 | 0.5 | 0.0 | 0.5 | 1.0 | 0.5 | 0.5 | 3.0 |
| 00084 | 0.5 | 1.0 | 0.5 | 1.0 | 0.5 | 1.0 | 4.5 |
| 00085 | 0.5 | 0.0 | 0.5 | 0.0 | 0.5 | 0.0 | 1.5 |
| 12702 | 0.5 | 0.0 | 0.0 | 1.0 | 0.0 | 0.0 | 1.5 |
| 00089 | 0.5 | 0.0 | 0.0 | 0.0 | 0.0 | 0.0 | 0.5 |
| 00704 | 0.0 | 0.0 | 0.0 | 0.0 | 0.0 | 0.0 | 0.0 |
| 12061 | 0.5 | 0.0 | 0.5 | 1.0 | 0.5 | 0.0 | 2.5 |
| 00705 | 0.5 | 0.0 | 0.0 | 0.0 | 0.5 | 0.5 | 1.5 |
| 00098 | 0.5 | 0.0 | 0.0 | 1.0 | 0.5 | 0.5 | 2.5 |
| 13700 | 0.5 | 0.0 | 0.5 | 0.0 | 0.0 | 0.0 | 1.0 |
| 19011 | 0.5 | 1.0 | 0.0 | 1.0 | 0.5 | 1.0 | 4.0 |
| 13003 | 0.5 | 1.0 | 0.0 | 1.0 | 0.0 | 0.5 | 3.0 |
| 13004 | 0.0 | 1.0 | 0.0 | 1.0 | 0.0 | 1.0 | 3.0 |
| 13008 | 0.5 | 1.0 | 0.0 | 1.0 | 0.0 | 0.0 | 2.5 |
| 13015 | 0.5 | 0.0 | 0.0 | 0.0 | 0.0 | 0.0 | 0.5 |
| 13702 | 0.5 | 1.0 | 0.0 | 0.0 | 0.5 | 0.5 | 2.5 |
| 19061 | 0.5 | 1.0 | 0.0 | 0.0 | 0.0 | 0.0 | 1.5 |