The Third Data Release of the Sloan Digital Sky Survey
Kevork Abazajian\ref{LANLtheory}\ref{LANLtheory}affiliationmark: ,
Jennifer K. Adelman-McCarthy\ref{Fermilab}\ref{Fermilab}affiliationmark: ,
Marcel A. Agüeros\ref{Washington}\ref{Washington}affiliationmark: ,
Sahar S. Allam\ref{Fermilab}\ref{Fermilab}affiliationmark: ,
Kurt S. J. Anderson\ref{APO}\ref{APO}affiliationmark: \ref{NMSU}\ref{NMSU}affiliationmark: ,
Scott F. Anderson\ref{Washington}\ref{Washington}affiliationmark: ,
James Annis\ref{Fermilab}\ref{Fermilab}affiliationmark: ,
Neta A. Bahcall\ref{Princeton}\ref{Princeton}affiliationmark: ,
Ivan K. Baldry\ref{JHU}\ref{JHU}affiliationmark: ,
Steven Bastian\ref{Fermilab}\ref{Fermilab}affiliationmark: ,
Andreas Berlind\ref{Chicago}\ref{Chicago}affiliationmark: \ref{CfCP}\ref{CfCP}affiliationmark: \ref{NYU}\ref{NYU}affiliationmark: ,
Mariangela Bernardi\ref{Pitt}\ref{Pitt}affiliationmark: \ref{CMU}\ref{CMU}affiliationmark: ,
Michael R. Blanton\ref{NYU}\ref{NYU}affiliationmark: ,
John J. Bochanski Jr.\ref{Washington}\ref{Washington}affiliationmark: ,
William N. Boroski\ref{Fermilab}\ref{Fermilab}affiliationmark: ,
Howard J. Brewington\ref{APO}\ref{APO}affiliationmark: ,
John W. Briggs\ref{NMIT}\ref{NMIT}affiliationmark: ,
J. Brinkmann\ref{APO}\ref{APO}affiliationmark: ,
Robert J. Brunner\ref{Illinois}\ref{Illinois}affiliationmark: ,
Tamás Budavári\ref{JHU}\ref{JHU}affiliationmark: ,
Larry N. Carey\ref{Washington}\ref{Washington}affiliationmark: ,
Francisco J. Castander\ref{Barcelona}\ref{Barcelona}affiliationmark: ,
A. J. Connolly\ref{Pitt}\ref{Pitt}affiliationmark: ,
Kevin R. Covey\ref{Washington}\ref{Washington}affiliationmark: ,
István Csabai\ref{Eotvos}\ref{Eotvos}affiliationmark: \ref{JHU}\ref{JHU}affiliationmark: ,
Julianne J. Dalcanton\ref{Washington}\ref{Washington}affiliationmark: ,
Mamoru Doi\ref{IoAUT}\ref{IoAUT}affiliationmark: ,
Feng Dong\ref{Princeton}\ref{Princeton}affiliationmark: ,
Daniel J. Eisenstein\ref{Arizona}\ref{Arizona}affiliationmark: ,
Michael L. Evans\ref{Washington}\ref{Washington}affiliationmark: ,
Xiaohui Fan\ref{Arizona}\ref{Arizona}affiliationmark: ,
Douglas P. Finkbeiner\ref{Princeton}\ref{Princeton}affiliationmark: \ref{Russell}\ref{Russell}affiliationmark: ,
Scott D. Friedman\ref{STScI}\ref{STScI}affiliationmark: ,
Joshua A. Frieman\ref{Fermilab}\ref{Fermilab}affiliationmark: \ref{Chicago}\ref{Chicago}affiliationmark: \ref{CfCP}\ref{CfCP}affiliationmark: ,
Masataka Fukugita\ref{ICRRUT}\ref{ICRRUT}affiliationmark: ,
Bruce Gillespie\ref{APO}\ref{APO}affiliationmark: ,
Karl Glazebrook\ref{JHU}\ref{JHU}affiliationmark: ,
Jim Gray\ref{Microsoft}\ref{Microsoft}affiliationmark: ,
Eva K. Grebel\ref{MPIA}\ref{MPIA}affiliationmark: ,
James E. Gunn\ref{Princeton}\ref{Princeton}affiliationmark: ,
Vijay K. Gurbani\ref{Fermilab}\ref{Fermilab}affiliationmark: \ref{Lucent2}\ref{Lucent2}affiliationmark: ,
Patrick B. Hall\ref{Princeton}\ref{Princeton}affiliationmark: \ref{York}\ref{York}affiliationmark: ,
Masaru Hamabe\ref{JapanWomen}\ref{JapanWomen}affiliationmark: ,
Daniel Harbeck\ref{Wisconsin}\ref{Wisconsin}affiliationmark: ,
Frederick H. Harris\ref{NOFS}\ref{NOFS}affiliationmark: ,
Hugh C. Harris\ref{NOFS}\ref{NOFS}affiliationmark: ,
Michael Harvanek\ref{APO}\ref{APO}affiliationmark: ,
Suzanne L. Hawley\ref{Washington}\ref{Washington}affiliationmark: ,
Jeffrey Hayes\ref{Catholic}\ref{Catholic}affiliationmark: ,
Timothy M. Heckman\ref{JHU}\ref{JHU}affiliationmark: ,
John S. Hendry\ref{Fermilab}\ref{Fermilab}affiliationmark: ,
Gregory S. Hennessy\ref{USNO}\ref{USNO}affiliationmark: ,
Robert B. Hindsley\ref{NRL}\ref{NRL}affiliationmark: ,
Craig J. Hogan\ref{Washington}\ref{Washington}affiliationmark: ,
David W. Hogg\ref{NYU}\ref{NYU}affiliationmark: ,
Donald J. Holmgren\ref{Fermilab}\ref{Fermilab}affiliationmark: ,
Jon A. Holtzman\ref{NMSU}\ref{NMSU}affiliationmark: ,
Shin-ichi Ichikawa\ref{NAOJ}\ref{NAOJ}affiliationmark: ,
Takashi Ichikawa\ref{TohokuU}\ref{TohokuU}affiliationmark: ,
Željko Ivezić\ref{Princeton}\ref{Princeton}affiliationmark: ,
Sebastian Jester\ref{Fermilab}\ref{Fermilab}affiliationmark: ,
David E. Johnston\ref{Princeton}\ref{Princeton}affiliationmark: ,
Anders M. Jorgensen\ref{LANL}\ref{LANL}affiliationmark: ,
Mario Jurić\ref{Princeton}\ref{Princeton}affiliationmark: ,
Stephen M. Kent\ref{Fermilab}\ref{Fermilab}affiliationmark: ,
S. J. Kleinman\ref{APO}\ref{APO}affiliationmark: ,
G. R. Knapp\ref{Princeton}\ref{Princeton}affiliationmark: ,
Alexei Yu. Kniazev\ref{MPIA}\ref{MPIA}affiliationmark: ,
Richard G. Kron\ref{Chicago}\ref{Chicago}affiliationmark: \ref{Fermilab}\ref{Fermilab}affiliationmark: ,
Jurek Krzesinski\ref{APO}\ref{APO}affiliationmark: \ref{MSO}\ref{MSO}affiliationmark: ,
Donald Q. Lamb\ref{Chicago}\ref{Chicago}affiliationmark: \ref{EFI}\ref{EFI}affiliationmark: ,
Hubert Lampeitl\ref{Fermilab}\ref{Fermilab}affiliationmark: ,
Brian C. Lee\ref{LBL}\ref{LBL}affiliationmark: ,
Huan Lin\ref{Fermilab}\ref{Fermilab}affiliationmark: ,
Daniel C. Long\ref{APO}\ref{APO}affiliationmark: ,
Jon Loveday\ref{Sussex}\ref{Sussex}affiliationmark: ,
Robert H. Lupton\ref{Princeton}\ref{Princeton}affiliationmark: ,
Ed Mannery\ref{Washington}\ref{Washington}affiliationmark: ,
Bruce Margon\ref{STScI}\ref{STScI}affiliationmark: ,
David Martínez-Delgado\ref{MPIA}\ref{MPIA}affiliationmark: ,
Takahiko Matsubara\ref{Nagoya}\ref{Nagoya}affiliationmark: ,
Peregrine M. McGehee\ref{NMSU}\ref{NMSU}affiliationmark: \ref{LANL2}\ref{LANL2}affiliationmark: ,
Timothy A. McKay\ref{Michigan}\ref{Michigan}affiliationmark: ,
Avery Meiksin\ref{Edinburgh}\ref{Edinburgh}affiliationmark: ,
Brice Ménard\ref{IAS}\ref{IAS}affiliationmark: ,
Jeffrey A. Munn\ref{NOFS}\ref{NOFS}affiliationmark: ,
Thomas Nash\ref{Fermilab}\ref{Fermilab}affiliationmark: ,
Eric H. Neilsen, Jr.\ref{Fermilab}\ref{Fermilab}affiliationmark: ,
Heidi Jo Newberg\ref{RPI}\ref{RPI}affiliationmark: ,
Peter R. Newman\ref{APO}\ref{APO}affiliationmark: ,
Robert C. Nichol\ref{Portsmouth}\ref{Portsmouth}affiliationmark: ,
Tom Nicinski\ref{Fermilab}\ref{Fermilab}affiliationmark: \ref{CMCElectronics}\ref{CMCElectronics}affiliationmark: ,
Maria Nieto-Santisteban\ref{STScI}\ref{STScI}affiliationmark: ,
Atsuko Nitta\ref{APO}\ref{APO}affiliationmark: ,
Sadanori Okamura\ref{DoAUT}\ref{DoAUT}affiliationmark: ,
William O’Mullane\ref{JHU}\ref{JHU}affiliationmark: ,
Russell Owen\ref{Washington}\ref{Washington}affiliationmark: ,
Nikhil Padmanabhan\ref{Princetonphys}\ref{Princetonphys}affiliationmark: ,
George Pauls\ref{Princeton}\ref{Princeton}affiliationmark: ,
John Peoples\ref{Fermilab}\ref{Fermilab}affiliationmark: ,
Jeffrey R. Pier\ref{NOFS}\ref{NOFS}affiliationmark: ,
Adrian C. Pope\ref{JHU}\ref{JHU}affiliationmark: ,
Dimitri Pourbaix\ref{Princeton}\ref{Princeton}affiliationmark: \ref{Bruxelles}\ref{Bruxelles}affiliationmark: ,
Thomas R. Quinn\ref{Washington}\ref{Washington}affiliationmark: ,
M. Jordan Raddick\ref{JHU}\ref{JHU}affiliationmark: ,
Gordon T. Richards\ref{Princeton}\ref{Princeton}affiliationmark: ,
Michael W. Richmond\ref{RIT}\ref{RIT}affiliationmark: ,
Hans-Walter Rix\ref{MPIA}\ref{MPIA}affiliationmark: ,
Constance M. Rockosi\ref{Lick}\ref{Lick}affiliationmark: ,
David J. Schlegel\ref{Princeton}\ref{Princeton}affiliationmark: ,
Donald P. Schneider\ref{PSU}\ref{PSU}affiliationmark: ,
Joshua Schroeder\ref{Princeton}\ref{Princeton}affiliationmark: \ref{Colorado}\ref{Colorado}affiliationmark: ,
Ryan Scranton\ref{Pitt}\ref{Pitt}affiliationmark: ,
Maki Sekiguchi\ref{JPG}\ref{JPG}affiliationmark: ,
Erin Sheldon\ref{Chicago}\ref{Chicago}affiliationmark: \ref{CfCP}\ref{CfCP}affiliationmark: ,
Kazu Shimasaku\ref{DoAUT}\ref{DoAUT}affiliationmark: ,
Nicole M. Silvestri\ref{Washington}\ref{Washington}affiliationmark: ,
J. Allyn Smith\ref{Wyoming}\ref{Wyoming}affiliationmark: \ref{LANL}\ref{LANL}affiliationmark: ,
Vernesa Smolčić\ref{Zagreb}\ref{Zagreb}affiliationmark: ,
Stephanie A. Snedden\ref{APO}\ref{APO}affiliationmark: ,
Albert Stebbins\ref{Fermilab}\ref{Fermilab}affiliationmark: ,
Chris Stoughton\ref{Fermilab}\ref{Fermilab}affiliationmark: ,
Michael A. Strauss\ref{Princeton}\ref{Princeton}affiliationmark: ,
Mark SubbaRao\ref{Chicago}\ref{Chicago}affiliationmark: \ref{Adler}\ref{Adler}affiliationmark: ,
Alexander S. Szalay\ref{JHU}\ref{JHU}affiliationmark: ,
István Szapudi\ref{Hawaii}\ref{Hawaii}affiliationmark: ,
Paula Szkody\ref{Washington}\ref{Washington}affiliationmark: ,
Gyula P. Szokoly\ref{MPIEP}\ref{MPIEP}affiliationmark: ,
Max Tegmark\ref{Penn}\ref{Penn}affiliationmark: ,
Luis Teodoro\ref{LANLtheory}\ref{LANLtheory}affiliationmark: ,
Aniruddha R. Thakar\ref{JHU}\ref{JHU}affiliationmark: ,
Christy Tremonti\ref{Arizona}\ref{Arizona}affiliationmark: ,
Douglas L. Tucker\ref{Fermilab}\ref{Fermilab}affiliationmark: ,
Alan Uomoto\ref{JHU}\ref{JHU}affiliationmark: \ref{CarnegieObs}\ref{CarnegieObs}affiliationmark: ,
Daniel E. Vanden Berk\ref{PSU}\ref{PSU}affiliationmark: ,
Jan Vandenberg\ref{JHU}\ref{JHU}affiliationmark: ,
Michael S. Vogeley\ref{Drexel}\ref{Drexel}affiliationmark: ,
Wolfgang Voges\ref{MPIEP}\ref{MPIEP}affiliationmark: ,
Nicole P. Vogt\ref{NMSU}\ref{NMSU}affiliationmark: ,
Lucianne M. Walkowicz\ref{Washington}\ref{Washington}affiliationmark: ,
Shu-i Wang\ref{CMCElectronics}\ref{CMCElectronics}affiliationmark: ,
David H. Weinberg\ref{OSU}\ref{OSU}affiliationmark: ,
Andrew A. West\ref{Washington}\ref{Washington}affiliationmark: ,
Simon D.M. White\ref{MPA}\ref{MPA}affiliationmark: ,
Brian C. Wilhite\ref{Chicago}\ref{Chicago}affiliationmark: ,
Yongzhong Xu\ref{LANLtheory}\ref{LANLtheory}affiliationmark: ,
Brian Yanny\ref{Fermilab}\ref{Fermilab}affiliationmark: ,
Naoki Yasuda\ref{ICRRUT}\ref{ICRRUT}affiliationmark: ,
Ching-Wa Yip\ref{Pitt}\ref{Pitt}affiliationmark: ,
D. R. Yocum\ref{Fermilab}\ref{Fermilab}affiliationmark: ,
Donald G. York\ref{Chicago}\ref{Chicago}affiliationmark: \ref{EFI}\ref{EFI}affiliationmark: ,
Idit Zehavi\ref{Arizona}\ref{Arizona}affiliationmark: ,
Stefano Zibetti\ref{MPA}\ref{MPA}affiliationmark: ,
Daniel B. Zucker\ref{MPIA}\ref{MPIA}affiliationmark:
Abstract
This paper describes the Third Data Release of the Sloan Digital Sky
Survey (SDSS). This release, containing data taken up through June
2003, includes imaging data in five bands over 5282 deg2,
photometric and astrometric catalogs of the 141 million objects
detected in these imaging data, and spectra of 528,640 objects
selected over 4188 deg2. The pipelines analyzing both images and
spectroscopy are unchanged from those used in our Second
Data Release.
Atlases—Catalogs—Surveys
11affiliationtext:
Theoretical Division, MS B285, Los Alamos National Laboratory, Los Alamos, NM 87545.
22affiliationtext:
Fermi National Accelerator Laboratory, P.O. Box 500, Batavia, IL 60510.
33affiliationtext:
Department of Astronomy, University of Washington, Box 351580, Seattle, WA
98195.
44affiliationtext:
Apache Point Observatory, P.O. Box 59, Sunspot, NM 88349.
55affiliationtext:
Department of Astronomy, MSC 4500, New Mexico State University,
P.O. Box 30001, Las Cruces, NM 88003.
66affiliationtext:
Department of Astrophysical Sciences, Princeton University, Princeton, NJ
08544.
77affiliationtext:
Center for Astrophysical Sciences, Department of Physics and Astronomy, Johns
Hopkins University, 3400 North Charles Street, Baltimore, MD 21218.
88affiliationtext:
Department of Astronomy and Astrophysics, University of Chicago, 5640 South
Ellis Avenue, Chicago, IL 60637.
99affiliationtext:
Center for Cosmological Physics, The University of Chicago,
5640 South Ellis Avenue, Chicago, IL 60637.
1010affiliationtext:
Center for Cosmology and Particle Physics,
Department of Physics,
New York University,
4 Washington Place,
New York, NY 10003.
1111affiliationtext:
Department of Physics and Astronomy, University of Pittsburgh, 3941 O’Hara
Street, Pittsburgh, PA 15260.
1212affiliationtext:
Department of Physics, Carnegie Mellon University, 5000 Forbes Avenue,
Pittsburgh, PA 15213.
1313affiliationtext:
Madgalena Ridge Observatory
New Mexico Institute of Technology
801 Leroy Place
Socorro, NM 87801.
1414affiliationtext:
Department of Astronomy
University of Illinois
1002 West Green Street, Urbana, IL 61801.
1515affiliationtext: Institut d’Estudis Espacials de Catalunya/CSIC, Gran Capitá 2-4,
E-08034 Barcelona, Spain.
1616affiliationtext:
Department of Physics of Complex Systems, Eötvös Loránd University, Pf. 32,
H-1518 Budapest, Hungary.
1717affiliationtext: Institute of Astronomy and Research Center for the
Early Universe, School
of Science, University of Tokyo,
2-21-1 Osawa, Mitaka, Tokyo 181-0015, Japan.
1818affiliationtext:
Steward Observatory, 933 North Cherry Avenue, Tucson, AZ 85721.
1919affiliationtext:
Russell-Cotsen Fellow
2020affiliationtext:
Space Telescope Science Institute, 3700 San Martin Drive, Baltimore, MD
21218.
2121affiliationtext: Institute for Cosmic Ray Research, University of Tokyo, 5-1-5 Kashiwa,
Kashiwa City, Chiba 277-8582, Japan.
2222affiliationtext:
Microsoft Research, 455 Market Street, Suite 1690, San Francisco, CA 94105.
2323affiliationtext:
Max-Planck-Institut für Astronomie, Königstuhl 17, D-69117 Heidelberg,
Germany.
2424affiliationtext:
Lucent Technologies, 2000 Lucent Lane, Naperville, IL 60566.
2525affiliationtext:
Dept. of Physics & Astronomy,
York University,
4700 Keele St.,
Toronto, ON, M3J 1P3,
Canada
2626affiliationtext:
Department of Mathematical and Physical Sciences,
Japan Women’s University
2-8-1 Mejirodai, Bunkyo, Tokyo 112-8681, Japan.
2727affiliationtext:
Department of Astronomy, University of Wisconsin, 475 North Charter
Street, Madison, WI 53706.
2828affiliationtext:
US Naval Observatory, Flagstaff Station, P.O. Box 1149, Flagstaff, AZ
86002-1149.
2929affiliationtext:
Institute for Astronomy and Computational Sciences
Physics Department
Catholic University of America
Washington DC 20064
3030affiliationtext:
US Naval Observatory, 3540 Massachusetts Avenue NW, Washington, DC 20392.
3131affiliationtext:
Code 7215, Remote Sensing Division
Naval Research Laboratory
4555 Overlook Avenue SW
Washington, DC 20392
3232affiliationtext: National Astronomical Observatory, 2-21-1 Osawa, Mitaka, Tokyo 181-8588,
Japan.
3333affiliationtext: Astronomical Institute, Tohoku University, Aramaki, Aoba, Sendai 980-8578,
Japan.
3434affiliationtext:
ISR-4, MS D448, Los Alamos National Laboratory, P.O.Box 1663, Los Alamos, NM 87545.
3535affiliationtext:
Obserwatorium Astronomiczne na Suhorze, Akademia Pedogogiczna w
Krakowie, ulica Podchora̧żych 2,
PL-30-084 Kraców, Poland.
3636affiliationtext:
Enrico Fermi Institute, University of Chicago, 5640 South Ellis Avenue,
Chicago, IL 60637.
3737affiliationtext:
Lawrence Berkeley National Laboratory, One Cyclotron Road,
Berkeley CA 94720-8160.
3838affiliationtext:
Astronomy Centre, University of Sussex, Falmer, Brighton BN1 9QJ, UK.
3939affiliationtext:
Department of Physics and Astrophysics,
Nagoya University,
Chikusa, Nagoya 464-8602,
Japan.
4040affiliationtext:
SNS-4, MS H820, Los Alamos National Laboratory, P.O.Box 1663, Los Alamos, NM 87545.
4141affiliationtext:
Department of Physics, University of Michigan, 500 East University Avenue, Ann
Arbor, MI 48109.
4242affiliationtext:
Institute for Astronomy,
Royal Observatory,
University of Edinburgh,
Blackford Hill,
Edinburgh EH9 3HJ,
UK.
4343affiliationtext:
Institute for Advanced Study, Olden Lane, Princeton, NJ 08540
4444affiliationtext:
Department of Physics, Applied Physics, and Astronomy, Rensselaer
Polytechnic Institute, 110 Eighth Street, Troy, NY 12180.
4545affiliationtext:
Institute of Cosmology and Gravitation (ICG),
Mercantile House, Hampshire Terrace,
Univ. of Portsmouth, Portsmouth, PO1 2EG, UK
4646affiliationtext:
CMC Electronics Aurora,
84 N. Dugan Rd.
Sugar Grove, IL 60554.
4747affiliationtext: Department of Astronomy and Research Center for the Early Universe,
University of Tokyo,
7-3-1 Hongo, Bunkyo, Tokyo 113-0033, Japan.
4848affiliationtext:
Joseph Henry Laboratories, Princeton University, Princeton, NJ
08544.
4949affiliationtext:
FNRS
Institut d’Astronomie et d’Astrophysique,
Université Libre de Bruxelles, CP. 226, Boulevard du Triomphe, B-1050
Bruxelles, Belgium
5050affiliationtext:
Department of Physics, Rochester Institute of Technology, 84 Lomb Memorial
Drive, Rochester, NY 14623-5603.
5151affiliationtext:
UCO/Lick Observatory, University of California, Santa Cruz, CA 95064
5252affiliationtext:
Department of Astronomy and Astrophysics, 525 Davey Laboratory, Pennsylvania State
University, University Park, PA 16802.
5353affiliationtext:
Center for Astrophysics and Space Astronomy, University of Colorado,
Boulder, CO 80309.
5454affiliationtext:
Japan Participation Group,
c/o Institute for Cosmic Ray Research, University of Tokyo, 5-1-5
Kashiwa, Kashiwa City, Chiba 277-8582, Japan.
5555affiliationtext:
Department of Physics and Astronomy, University of Wyoming, Laramie, WY 82071.
5656affiliationtext: University of Zagreb,
Department of Physics, Bijenička cesta 32,
10000 Zagreb, Croatia.
5757affiliationtext:
Adler Planetarium and Astronomy Museum,
1300 Lake Shore Drive,
Chicago, IL 60605.
5858affiliationtext:
Institute for Astronomy, 2680 Woodlawn Road, Honolulu, HI 96822.
5959affiliationtext:
Max-Planck-Institut für extraterrestrische Physik,
Giessenbachstrasse 1, D-85741 Garching, Germany.
6060affiliationtext:
Department of Physics, University of Pennsylvania, Philadelphia, PA 19104.
6161affiliationtext:
Observatories of the Carnegie Institution of Washington,
813 Santa Barbara Street,
Pasadena, CA 91101.
6262affiliationtext:
Department of Physics, Drexel University, 3141 Chestnut Street, Philadelphia, PA 19104.
6363affiliationtext:
Department of Astronomy, Ohio State University, 140 West 8th Avenue, Columbus, OH 43210.
6464affiliationtext:
Max Planck Institut für Astrophysik, Postfach 1,
D-85748 Garching, Germany.
1 Introduction
The Sloan Digital Sky Survey (SDSS; York et al. 2000) is carrying out
an imaging and spectroscopic CCD survey of the sky at high Galactic
latitudes, using a dedicated wide-field 2.5m telescope at Apache Point
Observatory in South-East New Mexico. The telescope saw first light in
May 1998, and following an extensive period of commissioning, formal
survey operations began in April 2000. The resulting data have been
distributed to the public via web interfaces accessible from the SDSS
public web site111http://www.sdss.org, and have been
described in a series of papers:
•
The Early Data Release, including data taken during
commissioning, Stoughton et al. (2002; hereafter EDR paper),
consisting of 462 deg2 of imaging data and spectra of 54,000
objects.
•
The First Data Release, Abazajian et al. (2003; hereafter DR1
paper), consisting of imaging data over 2099 square degrees and
spectra of 186,240 objects.
•
The Second Data Release, Abazajian et al. (2004; hereafter
DR2 paper), consisting of imaging data over 3324 square degrees
and spectra of 367,360 objects.
These data allow investigations in all areas of optical astronomy,
from asteroids to quasars. Among the papers which have appeared
since the Second Data Release are studies of the stellar masses of
galaxies (Brinchmann et al. 2004; Kauffmann et al. 2004), measurements
of the dark matter power spectrum from the Ly forest
(McDonald et al. 2004) and corresponding constraints on cosmological
parameters (Seljak et al. 2004); studies of quasars (Lacy et al. 2004)
and galaxies (Hogg et al. 2004) by cross-correlating SDSS data with
the Spitzer First-Look Survey; the discovery of new structures in the
halo of M31 (Zucker et al. 2004ab); measurements of the detailed shape
of the galaxy correlation function and relation to halo occupation
models (Zehavi et al. 2004); and studies of populations of
stars at the bottom of the HR diagram (West et al. 2004; Knapp et al. 2004).
The SDSS imaging data are taken on photometric moonless nights (with
photometricity determined by an auxiliary telescope; Hogg et al. 2001)
of good
seeing with a wide-field imaging camera operating in drift-scan mode
(Gunn et al. 1998). Six parallel scanlines on the sky, each
wide, are observed by each of the columns of CCDs. Each
of the five rows of the CCDs in the camera is fronted by a different
filter, thus each scanline is observed in five filters, denoted (in
order of observation) (Fukugita et al. 1996; Gunn
et al. 1998; EDR paper). The imaging data are processed by automated
software pipelines that measure the properties of all detected objects
(Lupton et al. 2001), and perform astrometric (Pier et al. 2003) and
photometric calibration, the latter to a set of standard stars
observed with the Photometric Telescope (Smith et al. 2003). The
resulting object catalogs are used to
select targets for spectroscopy, including the “Main” sample of
galaxies, magnitude-limited to (Strauss et al. 2002), a sample of luminous red ellipticals to
(Eisenstein et al. 2001; DR2 paper), quasar candidates selected by
their colors to (for candidates) and (for
higher-redshift candidates) (Richards et al. 2002), as well as a host
of additional targets, including optical counterparts to ROSAT X-ray
sources (Anderson et al. 2003), unusual stars, and calibration
observations (EDR paper). All magnitude limits here are corrected for
Galactic extinction following Schlegel, Finkbeiner, & Davis (1998).
The list of spectroscopic targets is
distributed among a series of spectroscopic tiles of
diameter (Blanton et al. 2003) to maximize observing
efficiency. Each tile then forms the design for a spectroscopic
plate: holes are drilled in aluminum plates corresponding to the
position of each object for which spectra will be measured. At the
telescope, optical fibers feeding a pair of double spectrographs are
plugged into each plate; the spectroscopic observations, carried out
under conditions not pristine enough for imaging, are typically 45
minutes per plate. The spectra are wavelength- and flux-calibrated,
and run through an automatic pipeline to classify them and determine
redshifts (EDR paper).
The previous data release papers describe the quality of the data;
the basic attributes of the data are given in
Table 1.
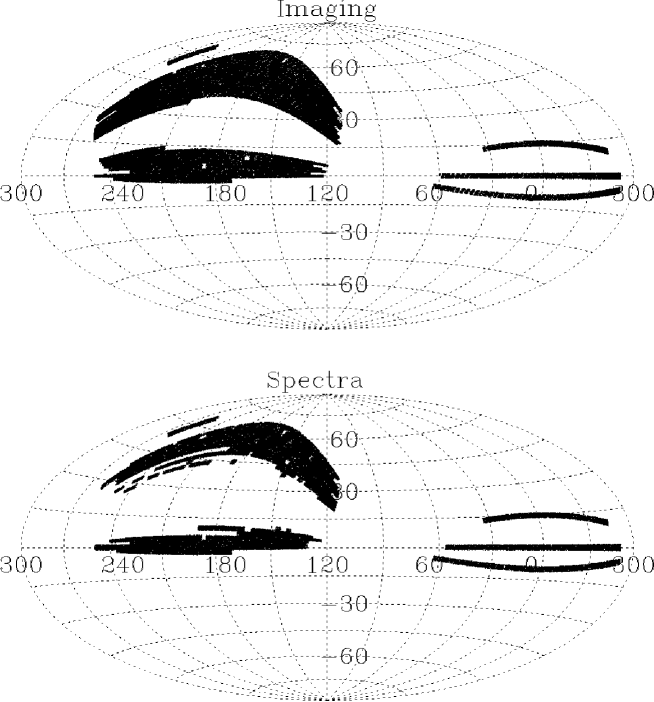
2 The Third Data Release
The SDSS Third Data Release (DR3) consists of all survey-quality data
taken through June 2003 as part of the main SDSS survey. The
footprints of the imaging and spectroscopic data are shown in
Figure 1. The spectroscopic footprint is smaller:
because spectroscopic targets are chosen from the imaging data, the
spectroscopy always lags the imaging. As with previous data releases, DR3 does
not include repeat imaging scans (mostly on the Celestial
Equator in the Southern Galactic Cap; see Figure 1),
repeat observations of spectroscopic plates that have been
observed more than once, or imaging or spectroscopic data taken
significantly outside the ellipse of the main survey footprint (as
described in York et al. 2000). However, six spectroscopic plates, and thirty-four square
degrees of imaging data in the Northern Galactic Cap in DR3 lie just
outside this ellipse. As in previous data releases, DR3
does include imaging data that overlap between adjacent runs.
The SDSS has taken a
considerable amount of imaging data at low Galactic latitudes outside
the survey footprint; the subset of these data taken before Summer
2003 have been made publically available in a release separate from
DR3, and is described by Finkbeiner et al. (2004).
As the survey has progressed, we have steadily improved the software
used to process the imaging and spectroscopic data. These changes
are described in the DR1 and DR2 papers, and at the public SDSS web
site. Each subsequent release has incorporated all the data
included in the previous release, necessitating a reprocessing of
those data. For DR3, however, we have made no changes in the
processing software, and therefore the DR2 subset of the DR3 data
are identical to the data already made public in 2004 March.
There is one exception to this statement, namely that we have
updated some incorrect spectral classifications in DR3. We have
also added several new auxiliary tables to the SDSS Catalog
Archive Server (CAS) which will be useful for those using SDSS data.
The Archive Introduction page in the Help menu on the CAS website222http://skyserver.sdss.org describes the CAS data model. It has a
new link at the top for release-specific notes.
2.1 Updated redshifts
We have visually inspected the spectra of all objects which
remained unclassified (spectral class UNKNOWN), and have updated the
classification and redshift where appropriate. Many of these
objects are of low signal-to-noise ratio, or are unusual objects of
various types, especially unusual quasars (see Hall et al. 2002).
There are 477 objects whose classifications were updated in this
effort, including 377 objects included in DR2.
2.2 New auxiliary tables
We have added a separate database table that includes stellar
B, V, R, and I Kron-Cousins photometry with accuracy of 0.02 mag or
better from Stetson (2000), as downloaded from the Canadian Astronomy Data Centre
photometric standards website333http://cadcwww.dao.nrc.ca/standards/. These data, when
cross-matched with SDSS, allow SDSS photometry of stars to be
compared with an external catalog. After fitting for the conversion
between the SDSS photometric system to the Kron-Cousins
photometry used by Stetson, we find the residuals shown in
Figure 2; the rms scatter is of order 2.5% in each
band. There is some evidence that this scatter is dominated by
errors in the photometric calibration of the SDSS. Further details
will be given in
Holtzman et al. (in preparation). We
have also included data from the Third Reference Catalog of Galaxies
(de Vaucouleurs et al. 1991), again to allow cross-reference to SDSS
data. Please see the CAS Archive Introduction page on the SkyServer
website’s Help page for more information about the Stetson and RC3
databases.
2.3 Imaging quality measures on a field-by-field basis
As part of quality assurance of the SDSS data, each of the fields within DR3 is assigned a
quality flag, FieldQAll, which is now made available in a
separate table, entitled RunQA in both the Catalog Archive
Server and Data Archive Server. This flag is based on five attributes:
•
The seeing in the band.
•
The mean offset between the aperture magnitude,
and the Point Spread Function (PSF) magnitude for bright stars on the
frame. The accuracy of the
results of the photometric pipeline are critically dependent on a
correct model for the PSF, and the aperture minus PSF magnitude is
an excellent diagnostic for problems in the PSF determination. This
magnitude difference typically is large under conditions in which
the seeing is varying rapidly (see the discussion in Ivezić et al. 2004).
•
Systematic offsets of the stellar locus in color space, and/or
increased width of the stellar locus.
As described in Fan (1999), Finlator et al. (2000),
Helmi
et al. (2003), and many other papers, stars in the SDSS photometric
system follow a narrow locus in color-color diagrams. One can
define a series of four principal colors from fits to the
stellar locus, which are linear transformations of the SDSS
magnitudes which empirically are essentially constant over the sky
(after correcting for foreground reddening following Schlegel et al. 1998). That is, systematic deviations of these principal colors as
small as 1% could indicate problems in the data. These principal
colors are defined as:
–
The color, , which is
perpendicular to the stellar locus in the diagram.
–
The color, , which is
perpendicular to the blue branch of the stellar locus in the diagram.
–
The color, , which is perpendicular
to the red branch of the stellar locus in the diagram.
–
The color, , which is
perpendicular to the stellar locus in the diagram.
These principal colors are measured directly from the stars
in running bins four fields wide. Deviations from the global mean
principal colors are indications of photometric errors, especially
those due to photometric calibration. Scatter around the principal
colors within a single bin (i.e., a broad stellar locus) is another
indication of poor data. For the present, we use the so-called
color in our overall quality assessment of each field (although
statistics on all four colors are available in the RunQA
table). In future work, we plan to incorporate information about all
four colors in the field quality.
•
Finally, the processing of the data itself can indicate
problems. As described in §4.6 of the EDR paper (§4.6), a field can be
given a so-called operational database quality of BAD, MISSING, or HOLE, often because the
data corresponding to the field is particularly poor, or the
photometric pipeline timed out on processing it (e.g., because of
the presence of a naked-eye star in the field).
Based on these quantities, we assign FieldQAll for each field,
as follows:
•
By default, the field in question is assigned FieldQAll=
ACCEPTABLE (listed in the RunQA table numerically as 1).
•
If the absolute value of the median PSF-aperture difference is
greater than 0.05 magnitudes in any of the five bands, or if the
absolute value of the color median is larger than 0.05
magnitudes, or if the color distribution width is 2.5 times
larger than its median value for the whole run, or if the -band
seeing is worse than 3 arcseconds, or if the operational database
quality is BAD, MISSING, or HOLE, the field in question is downgraded
to BAD (listed as 0).
•
If the absolute median PSF-aperture difference is smaller than 0.03
magnitudes in all five bands, and if the absolute value
of the color median is smaller than 0.03 mag, and if the
color distribution width is smaller than twice
its median value for the whole run, the field in question is
upgraded to GOOD (listed as 2).
•
If the median PSF-aperture difference is smaller than 0.02
magnitudes in all five bands, and if the absolute value
of the color median is smaller than 0.02 mag, and if the
color distribution width is smaller than 1.5 times
its median value for the whole run, and the -band seeing
is better than 2 arcseconds, the field in question is
upgraded to EXCELLENT (listed as 3).
In the DR3, 58% of fields are EXCELLENT, 26% are GOOD, 13% are
ACCEPTABLE, and only 3% are BAD.
Examples of how to use the RunQA table can be found by selecting this
table in the CAS Schema Browser on the SkyServer website.
3 Looking to the Future
It is worth emphasizing that doing statistical analyses off the SDSS
spectroscopic data requires detailed understanding of the
completeness of any particular sample. With this in mind, we have
undertaken various efforts to compile complete samples of various
subsets of spectroscopic objects, including quasars (e.g., Schneider
et al. 2003), white dwarfs (Kleinman et al. 2004), asteroids
(Ivezić et al. 2002), clusters of galaxies (Miller et al. 2004)
and galaxies themselves
(Blanton et al. 2004; this latter includes detailed information on
the geometry of the sample), as well as photometric samples of
quasars (Richards et al. 2004). We are actively preparing updated
samples for DR3.
Our next data release after DR3 will consist of data taken through
July 2004; it will occur in July 2005. SDSS survey operations
will end at about that time, and a final data release (DR5) is planned
for early 2006. As Figure 1 implies, there will still
be a substantial gap between the Northern and Southern pieces of the
sky covered in the North Galactic Cap (i.e., ), and we are actively seeking funds to extend operations
beyond summer 2005 to fill the gap.
Funding for the creation and distribution of the SDSS Archive has been
provided by the Alfred P. Sloan Foundation, the Participating
Institutions, the National Aeronautics and Space Administration, the
National Science Foundation, the U.S. Department of Energy, the
Japanese Monbukagakusho, and the Max Planck Society. The SDSS Web site
is http://www.sdss.org/.
The SDSS is managed by the Astrophysical Research Consortium (ARC) for
the Participating Institutions. The Participating Institutions are The
University of Chicago, Fermilab, the Institute for Advanced Study, the
Japan Participation Group, The Johns Hopkins University, the Korean
Scientist Group, Los Alamos National Laboratory, the
Max-Planck-Institute for Astronomy (MPIA), the Max-Planck-Institute
for Astrophysics (MPA), New Mexico State University, University of
Pittsburgh, Princeton University, the United States Naval Observatory,
and the University of Washington.
References
(1) Abazajian, K. et al. 2003, AJ, 126, 2018 (DR1 paper)
(2) Abazajian, K. et al. 2004, AJ, 128, 502 (DR2 paper)
(3) Anderson, S. et al. 2003, AJ, 126, 2209
(4) Blanton, M.R., Lin, H., Lupton, R.H., Maley, F.M., Young,
N., Zehavi, I., & Loveday, J. 2003, AJ, 125, 2276
(5) Blanton, M.R. et al. 2004, AJ, submitted (astro-ph/0410164)
(6) Brinchmann, J. et al. 2004, MNRAS, 351, 1151
(7) de Vaucouleurs, G., de Vaucouleurs, A., Corwin, H.G.,
Buta, R.J., Paturel, G., & Fouque, P. 1991, The Third Reference
Catalog of Galaxies (Berlin: Springer-Verlag), Volumes 1-3
(8) Eisenstein, D.J. et al. 2001, AJ, 122, 2267
(9) Fan, X. 1999, AJ, 117, 2528
(10) Finkbeiner, D. et al. 2004, AJ, in press (astro-ph/0409700)
(11) Finlator, K. et al. 2000, AJ, 120, 2615
(12) Fukugita, M., Ichikawa, T., Gunn, J.E., Doi, M.,
Shimasaku, K., & Schneider, D.P. 1996, AJ, 111, 1748
(13) Gunn, J.E. et al. 1998, AJ, 116, 3040
(14) Hall, P. et al. 2002, ApJS, 141, 267
(15) Helmi, A. et al. 2003, ApJ, 586, 195
(16) Hogg, D.W. et al. 2004, ApJ, submitted (astro-ph/0408420)
(19) Ivezić, Ž., Jurić, M., Lupton, R.H., Tabachnik,
S., Quinn T. 2002, in
Survey and Other Telescope Technologies and Discoveries,
J.A. Tyson, S. Wolff, Editors, Proceedings of SPIE Vol. 4836, 98
(20) Kauffmann, G. et al. 2004, MNRAS, 353, 713
(21) Kleinman, S.J. et al. 2004, ApJ, 607, 426
(22) Knapp, G.R. et al. 2004, AJ, 127, 3553
(23) Lacy, M. et al. 2004, ApJS, 154, 166
(24) Lupton, R.H., Gunn, J.E., Ivezić, Ž., Knapp, G.R.,
Kent, S., & Yasuda, N. 2001, in Astronomical Data Analysis
Software and Systems X, edited by F. R. Harnden Jr., F. A. Primini,
and H. E. Payne, ASP Conference Proceedings, 238, 269
(25) McDonald, P. et al. 2004, ApJ, submitted (astro-ph/0405013)
(32) Seljak, U. et al. 2004, ApJ, submitted (astro-ph/0408003)
(33) Smith, J.A. et al. 2002, AJ, 123, 2121
(34) Stetson, P. B. 2000, PASP, 112, 925
(35) Stoughton, C. et al. 2002, AJ, 123, 485 (EDR paper)
(36) Strauss, M.A. et al. 2002, AJ, 124, 1810
(37) West, A. et al. 2004, AJ, 128, 426
(38) York, D.G. et al. 2000, AJ, 120, 1579
(39) Zehavi, I. et al. 2004, ApJ, 608, 16
(40) Zucker, D. et al. 2004a, ApJ, 612, L117
(41) Zucker, D. et al. 2004b, ApJ, 612, L121
Figure 1: The footprint of the SDSS imaging (top) and spectroscopic
(bottom) data included in DR3. The former covers 5282 deg2,
while the latter is 4188 deg2. The figure is an Aitoff
projection in equatorial coordinates. Note that it wraps at . The data in the Southern Galactic Cap () consist of three stripes. In the Northern
Galactic Cap, the SDSS is working North from the Celestial Equator,
and South from a region centered on .
Figure 2: A comparison of SDSS and Stetson (2000) photometry of stars.
After finding the best-fit conversion from SDSS photometry
to the Kron-Cousins system used by Stetson, the residuals are found
to be independent of magnitude (perhaps indicating that they are
dominated by photometric calibration, and/or the uncertainties in
the transformation between the two photometric systems), and have an
rms of .
Table 1: Characteristics of the SDSS Third Data
Release (DR3)
Imaging
Footprint area
5282 deg2
Imaging catalog
141 million unique objects
Magnitude limits:aa95% completeness for point sources in
typical seeing; 50% completeness numbers are typically 0.4 mag
fainter (DR1 paper).