Resolved Molecular Gas in a Quasar Host Galaxy at Redshift z=6.42
Abstract
We present high-resolution VLA observations of the molecular gas in the host galaxy of the highest redshift quasar currently known, SDSS J1148+5251 (z=6.42). Our VLA data of the CO(3–2) emission have a maximum resolution of 0.17 (1 kpc), and enable us to resolve the molecular gas emission both spatially and in velocity. The molecular gas in J1148+5251 is extended to a radius of 2.5 kpc, and the central region shows 2 peaks, separated by 0.3′′ (1.7 kpc). These peaks account for about half of the total emission, while the remainder is more extended. Each of these unresolved peaks contains a molecular gas mass of M⊙ (similar to the total mass found in nearby ULIRGS) and has an intrinsic brightness temperature of K (averaged over the 1 kpc-sized beam), comparable to what is found in nearby starburst centers. Assuming that the molecular gas is gravitationally bound, we estimate a dynamical mass of M⊙ within a radius of 2.5 kpc ( M⊙ if corrected for a derived inclination of ). This dynamical mass estimate leaves little room for matter other than the detected molecular gas, and in particular the data are inconsistent with a M☉ stellar bulge which would be predicted based on the M relation. This finding may indicate that black holes form prior to the assembly of the stellar bulges and that the dark matter halos are less massive than predicted based on the black hole/bulge mass relationship.
1 Introduction
More and more objects have been found at the highest redshifts in recent years, back to the ’Dark Ages’ (the epoch of formation of the first luminous structures), at z6 when the universe was less than a gigayear old (e.g., Fan et al. 2002, 2003, 2004, Hu et al. 2002, Stanway et al. 2003). Optical spectra of the brightest quasars at z6 show a clear Gunn & Peterson (1965) effect, demonstrating that these objects are located at the end of cosmic reionization (Becker et al. 2001, Fan et al. 2003, White et al. 2003). It is of paramount importance to study these sources in detail to measure the stellar and gaseous constituents, chemical abundances and dynamical masses of the host galaxies, which in turn constrain galaxy evolution models in the very early universe. Studies of the host galaxies of bright quasars are extremely challenging in the optical and/or near-infrared as the central active galactic nucleus (AGN) greatly overshines its surrounding. Radio observations of the molecular gas phase, however, are a promising method to measure such important properties of distant quasar host galaxies as the total quantity of molecular gas and the dynamical masses.
The highest redshift quasar currently known is SDSS J114816.64+525150.3 (hereafter: J1148+5251) at z=6.42 (Fan et al. 2003). J1148+5251 is a highly luminous object which is thought to be powered by mass accretion onto a supermassive black hole of mass 1–5 M⊙ (which accrets at the Eddington limit, Willot et al. 2003). Thermal emission from warm dust has been detected at millimetre wavelengths, implying a far infrared (FIR) luminosity of L⊙ (Bertoldi et al. 2003a), corresponding to about 10 of the bolometric luminosity of the system. J1148+5251 falls on the radio-FIR correlation found for nearby starburst galaxies (Carilli et al. 2004); if the heating of the dust is dominated by young stars, then the implied star formation rate is an impressive M⊙ yr-1. High–resolution HST imaging does not reveal multiple imaging of the central AGN (White et al. 2004), rendering strong magnification unlikely (cf. the multiple optical imaging in the gravitationally lensed system PSS2322+1944, Carilli et al. 2003).
Using the Very Large Array (VLA) and the Plateau de Bure interferometer (PdBI), we have detected various rotational lines of carbon monoxide (CO), the most common tracer of molecular gas, in J1148+5251 (Walter et al. 2003, Bertoldi et al. 2003b). This discovery demonstrated that abundant, dense and warm molecular gas (the requisite fuel for star formation) is already present at these large lookback times (a redshift of z=6.4 corresponds to an age of the universe of 870 Myr in a cosmology with H km sMpc-1, =0.73, =0.27 which we adopt in the following).
Here we present follow-up high-resolution observations of the molecular gas distribution of J1148+5251 obtained with the NRAO VLA111The National Radio Astronomy Observatory is a facility of the National Science Foundation operated under cooperative agreement by Associated Universities, Inc.. These observations resolve, for the first time, the host galaxy of this luminous quasar on kiloparsec scales (1 kpc = 0.18′′ at z=6.42) and enable us to constrain its molecular gas properties and the dynamical mass.
2 Observations
Using the VLA in D configuration, Walter et al. (2003) detected the CO(3–2) line (= 345.796 GHz) in J1148+5251, which is shifted to 46.61 GHz (6.43 mm) at z=6.419. The emission was unresolved in the D-array observations at 1.5′′ resolution but the line strength of 0.6 mJy indicated that follow-up VLA observations at higher spatial and spectral resolution were possible. In addition, surface brightness arguments yielded a minimum size of 0.2′′(TB[50K])-0.5, a resolution which can be reached with the VLA B–array. We therefore performed follow-up observations of J1148+5251 at the VLA in B array (60 hours) and C array (24 hours) from January – April 2004 (total time on source: 60 hours). Observations were done in fast switching mode using the nearby source 11534+49311 for secondary amplitude and phase calibration; the phase stability in all runs was excellent ( phase rms on 10 km baselines).
Two 25 MHz intermediate frequencies (IFs, centered at 46.603250 GHz and 46.622050 GHz, respectively) with 7 channels each (channel width: 3.1250 MHz) were observed simultaneously, leading to a total coverage of 37.5 MHz (or 240 km s-1, excluding the overlap and edge channel). This velocity range encompasses most of the CO line-width measured by the VLA and the PdBI (FWHM=280 km s-1), but does not include the line wings and the continuum (in earlier observations we derived a upper limit of the continuum at 46 GHz of 0.1 mJy, Walter et al. 2003). Given the limited signal to noise ratio in individual channels, three individual channels were binned to one channel, resulting in a total of 4 independent channels (width=9.375 MHz, or 60 km s-1).
For our analysis we created two datasets. The first dataset is based on the new C and B array data with a UV taper of 1 M, resulting in a beamsize of and an rms noise of 86Jy beam-1 in a 9.375 MHz channel. The rms noise in the map covering the entire bandpass (37.5 MHz) is 43Jy beam-1. To boost the resolution in the central region, the B array data only were mapped using ’Natural’ weighting; this results in a beam of and an rms noise of 45Jy beam-1. The original D array data were not included in this analysis as they were not observed in spectral line mode.
3 Results
3.1 Global Distribution of Molecular Gas
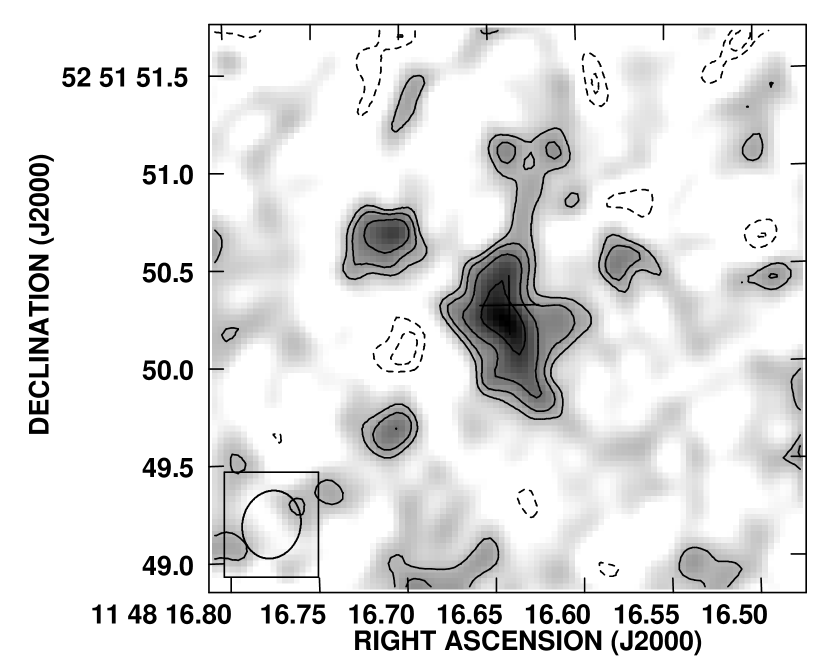
In Fig. 1 we present the CO(3–2) emission in J1148+5251 over the total measured bandwidth (37.5 MHz, 240 km s-1) at (1.9 kpc1.7 kpc) resolution. The emission is clearly extended and Gaussian fitting in the map plane gives a deconvolved major axis (FWHM) of 0.65 (3.6 kpc), a marginally resolved minor axis of 0.25 (1.4 kpc) and a position angle of 15 (measured east from north). Molecular gas can be seen out to distances of 0.42′′ from the centre (2.5 kpc, numbers are deconvolved for the beam size). The source is possibly extended towards the north (see also Fig. 2, first channel map) but more sensitive observations are needed to confirm this extension. If we assume that the main molecular gas concentration forms an inclined disk, this gives an inclination of 65∘ (where 0∘ corresponds to face–on) which implies that any inclination correction to the measured rotational velocities is minimal. The fitted peak to the central distribution is 0.21 mJy beam-1 and the integral intensity is 0.55 mJy. This corresponds to an H2 mass of M(H M⊙.222Here and in the following we assume constant brightness in the CO(3–2) and CO(1–0) transitions and a conversion factor to convert CO luminosities to H2 masses of M⊙ (K km s-1 pc, see Walter et al. 2003. A 1 mJy continuum point source 40′′ north-east of the QSO is unresolved, emphasizing that phase decoherence is not the reason that the emission of J1148+5251 appears extended.
Given our beamsize of 0.350.30′′, the peak brightness of 0.21 mJy beam-1 corresponds to a surface brightness of 1.1 K, or a beam–smoothed brightness temperature of 1.1=8.3 K at z=6.42.
3.2 Dynamics of the Molecular Gas
Assuming that the molecular gas is gravitationally bound and forms an inclined disk with a radius of 2.5 kpc (see previous section) and that the gas seen in the PdBI spectrum emerges from the same region (full width at zero intensity: 560 km s-1 or v280 km s-1, Bertoldi et al. 2003b), we derive an approximate dynamical mass for J1148+5251 of M⊙ (or M⊙ if we correct for an inclination of 65∘) with an error of order 50%. Within the large uncertainties, this number is compatible with the derived molecular gas mass and the mass of the central black hole, but does not leave much room for additional matter (e.g. a massive stellar bulge, see discussion below).
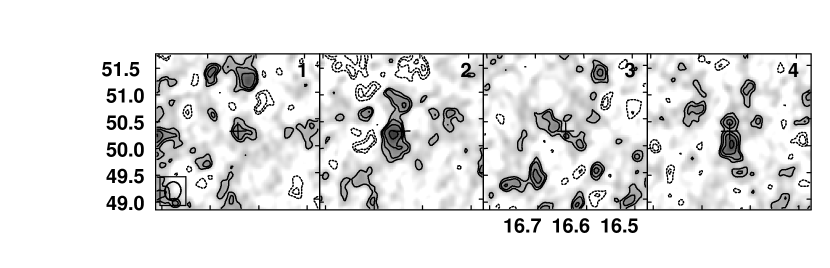
Using the velocity information in our new observations, we can now investigate the spatially resolved dynamics in the centre of J1148+5251. Fig. 2 shows four channel maps (width of one channel: 9.375 MHz, or 60 km s-1) which cover the entire observed bandpass at (2.0 kpc kpc) resolution. Due to the intrinsic faintness of the emission, the channel maps are noisy, however some interesting features can still be identified. In particular there is some indication that emission is moving from the north to the south with increasing channel number (i.e., increasing frequency). Observations with better sensitivity (and covering more of the total CO line–width) are required to further constrain the internal dynamics of J1148+5251.
3.3 Distribution of CO at 1 kpc scale
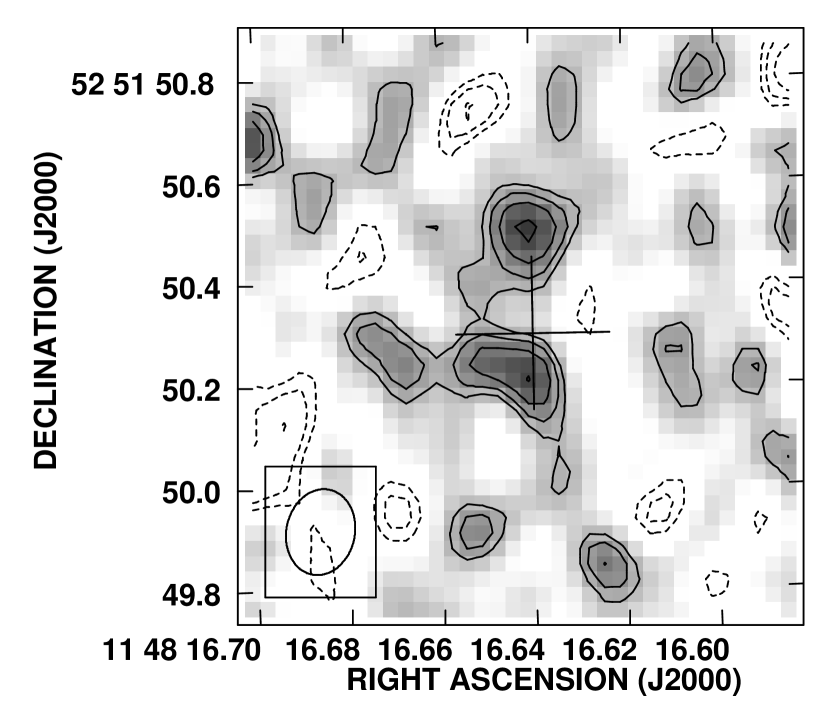
The distribution of molecular gas at even higher resolution reveals that the situation is likely more complex than described by the simple disk model above. In Fig. 3 we show our highest resolution CO(3–2) map derived from B-array data only. Here the resolution is only , or 0.95 kpc kpc.333We note that this is comparable to resolutions typically achieved with single-dish telescopes when studying galaxies in the nearby universe in the CO(1–0) transition. This map shows that the emission breaks up into two regions, a northern source at 11h48m16.640, 52∘51′50.51 (peak flux density: 192 Jy), and a southern source at 11h48m16.641, 52∘51′50.21 (flux density: 180 Jy), i.e., separated by 0.3′′ (1.7 kpc). On a Kelvin scale, both sources are at 4.5 K, which corresponds to a lower limit for the beam–averaged brightness temperature of 35 K at z=6.42.
To interpret this morphology and its relation to the optical quasar, astrometric precision to better than 0.05′′ is needed. However, at the scales under consideration it proves to be extremely difficult to tie the radio and optical frames together. This situation is further complicated by the fact that J1148+5251 has a very atypical spectrum (showing a complete Gunn Peterson effect in the optical and only covering parts of the Sloan z band). Thus differential chromatic aberration would preclude tying the SDSS z-band image of J1148+5251 to the radio frame to better than a few tenths of an arcsecond even if common sources existed in both frames. This uncertainty is indicated by the size of the cross in all figures. As the southern CO emission is situated more towards the centre of the entire molecular gas distribution (cf. Fig. 1) we consider it likely, for symmetry reasons, that the optical QSO is associated with the southern source. In this picture the northern source may possibly be the nucleus of an object in the process of merging with the quasar host. This situation may be reminiscent of the molecular gas distribution around the z=4.7 QSO BRI 1202-0725 in which two molecular gas peaks have been detected as well (albeit on a factor 10 larger scale, Omont et al. 1996, Carilli et al. 2002). Alternatively, the northern source could be a region of high surface brightness within J1148+5251.
4 Summary and Discussion
We present the first resolved maps of a system located at the end of cosmic reionization at z=6.4. Our high-resolution VLA data enable us to resolve the molecular gas emission in the host galaxy both spatially and in velocity space.
The molecular gas distribution in J1148+5251 is extended out to radii of 2.5 kpc. The central region is resolved and shows 2 peaks, separated by 1.7 kpc; they account for about half of the total emission, with the other half present in the more extended molecular gas distribution. Each of these peaks harbors a molecular gas mass of M⊙ within a radius of 0.5 kpc, respectively; this mass is similar to the total mass found in nearby ULIRGS such as Mrk 273 or Arp 220 (Downes & Solomon 1998). The peaks have intrinsic brightnesses of K (averaged over the 1 kpc-sized beam), similar to what is found in the centres of nearby active galaxies (Downes & Solomon 1998, assuming constant surface brightness down to the CO(1–0) transition), albeit measured over a larger physical area.
We have assumed that the gas is gravitationally bound and is situated in a disk, although the data do not rule out the presence of an unbound system, such as an ongoing merger. Based on the extent of the molecular gas distribution and the line-width measured from the higher CO transitions we derive a dynamical mass of M⊙ ( M⊙ if we correct for an inclination of ). This dynamical mass estimate can account for the detected molecular gas mass within this radius but leaves little room for other matter. In particular, given a black hole mass of mass 1-5 M⊙ (Willot et al. 2003), this dynamical mass could not accomodate an order few M⊙ stellar bulge which is predicted by the present–day M relation (Ferrarese & Merritt 2000, Gebhardt 2000), if this relation were to hold at these high redshifts. Even if we assume a scenario in which this bulge was 10 times the scale length of the molecular gas emission, we would still expect a bulge contribution of few M⊙ within the central 2.5 kpc (assuming a central density–profile of , e.g., Jaffe 1983, Tremaine 1994) which can not be reconciled with our results. Our finding therefore suggests that black holes may assemble before the stellar bulges. This would be in conflict with the popular picture of co-eval evolution of the central black hole and the stellar bulge. The derived dynamical mass and the hypothetical stellar bulge mass (based on M) can be only brought in agreement if (i) our derived inclination is significantly off (i.e., ), (ii) the estimated black hole mass is over-estimated by orders of magnitudes (which would imply highly super-Eddington accretion), or (iii) if the assumption that the gas is gravitationally bound is seriously wrong. We note, however, that depending on the space density of similar sources at these high redshifts, the smaller dynamical masses suggested in this study may be in better agreement with the masses predicted by CDM simulations in the very early universe as a 1012 M⊙ bulge would imply a rather massive dark matter halo of M⊙.
This study shows the potential for future studies of the molecular gas content and dynamical masses in the highest redshift galaxies using ALMA, where resolutions of will be achieved routinely.
References
-
(1)
Becker, R. H., et al. 2001, AJ, 122, 2850
-
(2)
Bertoldi, F., et al. 2003, A&A, 409, L47
-
(3)
Bertoldi, F., Carilli, C. L., Cox, P., Fan, X., Strauss, M. A.,
Beelen, A., Omont, A., & Zylka, R. 2003, A&A, 406, L55
-
(4)
Carilli, C. L., et al. 2002, AJ, 123, 1838
-
(5)
Carilli, C. L., Lewis, G. F., Djorgovski, S. G., Mahabal, A., Cox, P.,
Bertoldi, F., & Omont, A. 2003, Science, 300, 773
-
(6)
Carilli, C. L., Walter, F., Bertoldi, F., Menten, K., et al. 2004,
AJ, in press
-
(7)
Downes, D. & Solomon, P. M. 1998, ApJ, 507, 615
-
(8)
Fan, X., Narayanan, V. K., Strauss, M. A., White, R. L., Becker,
R. H., Pentericci, L., & Rix, H. 2002, AJ, 123, 1247
-
(9)
Fan, X., et al. 2003, AJ, 125, 1649
-
(10)
Fan, X., et al. 2004, AJ, in press
-
(11)
Ferrarese, L. & Merritt, D. 2000, ApJ, 539, L9
-
(12)
Gebhardt, K., et al. 2000, ApJ, 539, L13
-
(13)
Gunn, J. E., & Peterson, B. A. 1965, ApJ, 142, 1633
-
(14)
Hu, E. M., Cowie, L. L., McMahon, R. G., Capak, P., Iwamuro, F.,
Kneib, J.-P., Maihara, T., & Motohara, K. 2002, ApJ, 568, L75
-
(15)
Jaffe, W. 1983, MNRAS, 202, 995
-
(16)
Omont, A., Petitjean, P., Guilloteau, S., McMahon, R. G., Solomon,
P. M., & Pecontal, E. 1996, Nature, 382, 428
-
(17)
Stanway, E. R., et al. 2004, ApJ, 604, L13
-
(18)
Tremaine, S.,
Richstone, D. O., Byun, Y., Dressler, A., Faber, S. M., Grillmair, C.,
Kormendy, J., & Lauer, T. R. 1994, AJ, 107, 634
-
(19)
Walter, F., et al. 2003, Nature, 424, 406
-
(20)
White, R. L., Becker, R. H., Fan, X., & Strauss, M. A. 2003, AJ,
126, 1
-
(21)
White, R. L, Becker, R. H, Fan, X., and Strauss, M. A., 2004, in
prep.
-
(22)
Willott, C. J., McLure, R. J., & Jarvis, M. J. 2003, ApJ, 587,
L15