Inferring coronal structure using X-ray spectra: a Chandra study of AB Dor
Abstract
The Chandra X-ray observatory monitored the single cool star, AB Doradus, continuously for a period lasting 88 ksec (1.98 ) in 2002 December with the LETG/HRC-S. The X-ray lightcurve shows significant rotational modulation. It can be represented as having a flat level of emission superimposed with bright flaring regions that appear at the same phases in both rotation cycles. Phase-binned O viii line profiles show centroid shifts that also repeat in consecutive rotation cycles. These Doppler shifts trace a roughly sinusoidal pattern with a a semi-amplitude of . By taking both the lightcurve and spectral diagnostics into account along with constraints on the rotational broadening of line profiles (provided by archival Chandra HETG Fe xvii line profiles) we can construct a simple model of the X-ray corona. The corona can be described as having two components, one component is homogeneously distributed, extending less than 1.75 ; and the other consists of at least two compact emitting regions near the stellar surface. These compact regions account for 16% of the X-ray emission and are likely to be located less than 0.4 above the stellar surface.
keywords:
Stars: structure – Stars: coronae – Stars: X-rays – Stars: spectroscopy1 Introduction
While the thermal properties of active stellar coronae are increasingly well-determined, we have yet to establish where the emitting plasma is located. As active stars cannot be spatially resolved at X-ray wavelengths we have to rely on indirect techniques to infer the distribution of coronal material. Grating spectra from the Chandra/LETG configuration are sufficiently resolved to measure radial velocities in stellar coronae (Brickhouse et al. 2001; Hoogerwerf et al. 2004).
Previous studies of AB Dor data taken using ROSAT show evidence of rotational modulation at the 5–13% level (Kürster et al. 1997). We set out to study coronal structure in the active single K0 dwarf, AB Dor ( d, km s-1) by analysing Chandra/LETG data covering almost two rotation cycles. We find strong evidence for rotational modulation in both the spectra and lightcurves and use the results to develop a simple model for the star’s X-ray emitting corona. Section 2 summarises the properties of the LETG X-ray lightcurve, Section 3 details measurements of rotational modulation in the LETG spectra and Section 4 shows the upper limits to which the bulk of the X-ray emitting corona extends, as determined using archive Chandra/HETG spectra. The main conclusions and a simple coronal model are presented in Section 5.
2 Lightcurves: detecting rotational modulation
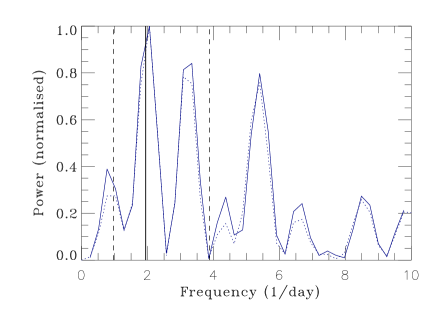
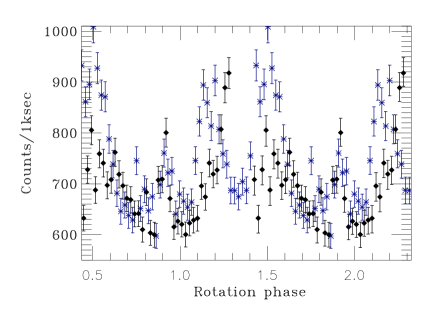
The lightcurve is extracted over the short wavelength region ( Å) of the dataset, using 1 ksec bins, summing up both the and orders in order to ensure effective subtraction of the X-ray background. Periodogram analyses show that there is strong evidence for rotational modulation, with the strongest peak occurring close to AB Dor’s rotation period (Figure 1). Given the width of the peak, we find that this is consistent with AB Dor’s period. By folding the lightcurve on AB Dor’s rotation period (Figure 2) it is evident that there is a high level of agreement between the two consecutive rotation cycles. By fitting sine-curves to the lightcurves, we measure rotational modulation at the 12% level.
3 Spectra: measuring centroid shifts
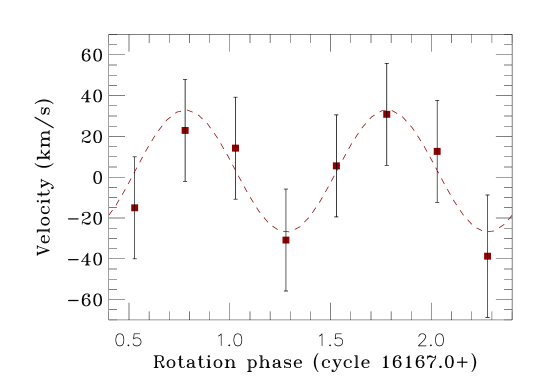
The absolute wavelength scale is not important as we are looking for relative shifts in the positions of the line centroids as a function of rotation phase. To ensure accurate calibration of the wavelength positions of the strongest lines, Gaussians are fitted to to the line profiles (integrated over the entire 88.1 ksec exposure). Offsets between the centroid positions of the line profiles and the laboratory wavelengths are computed and used to recalibrate their “zero-velocity” positions. The total exposure is divided into eight quarter rotation-phase bins and spectra are extracted for each of these bins. Line centroids in these eight sets of spectra are re-fitted using Gaussians in order to evaluate any Doppler shifts. Note that all the bins are of 11.12 ksec length except for the last phase bin which is slightly shorter, 10.26 ksec (as the total observation does not cover two full rotation cycles). Because the dither time-scale of the spacecraft is 1087 sec, each phase bin consists of approximately ten dither cycles. Thus the centroid measurements should not be susceptible to wavelength deviations associated with dithering. We find that the Oviii 18.97Å line profile can be fitted with greatest precision due to its relative strength and lack of blends. Any offsets are then measured relative to the zero-velocity positions (measured using the full 88.1 ksec exposure), and mean Doppler shifts are obtained by combining the and orders. We find velocity shifts that repeat from in two consecutive cycles (Figure 3).
4 Spectra: Evaluating rotational broadening
AB Dor’s photospheric lines are substantially rotationally broadened ( ). If the X-ray emitting corona is a diffuse shell extended out to several , LETG line profiles at long wavelengths should be significantly broader than profiles subject to instrumental and thermal broadening effects alone. Unfortunately, the LETG line profiles in the long wavelength, high resolution region of the dataset cannot be used to accurately measure rotational broadening, as the line profiles from the and orders are inconsistent (also see Chung et al. 2004). We therefore use HETG spectra of AB Dor to evaluate rotational broadening in X-ray line profiles (and thus the extent of the emitting corona). The Fe xvii line is analysed as it is subject to less thermal broadening than the O viii line. Broadening with a of 180 km s-1 (i.e. corresponding to a corona that extends to 2 R∗) produces a profile that is broader than the observed line (Figure 4). Further analysis indicates that the bulk of the emitting corona does not extend beyond 1.75 R∗ (see Hussain et al. 2004 for more detail).
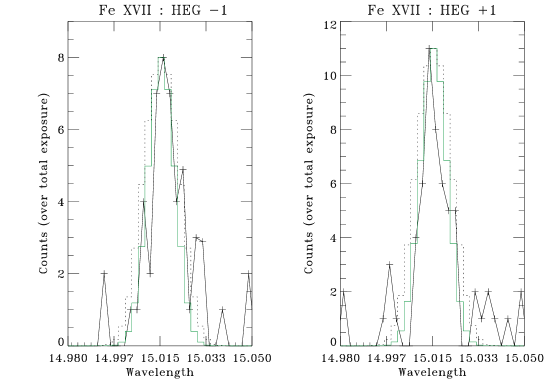
The solid black lines represent the observed HETG spectra in the and orders respectively. The solid and dotted histogram line profiles show the effects of instrumental, thermal and rotational broadening with values of 90 and 180 km s-1 respectively.
5 Conclusions
Our main conclusions can be itemised as follows.
-
•
The X-ray lightcurve has a flat level of emission superimposed with two (or three) bright/flaring regions; one region lies between phases, and one or two regions lie between . These bright flaring regions appear to repeat in both (consecutive) rotation cycles observed.
-
•
Phase-binned O viii line profiles show centroid shifts that also repeat from cycle to cycle and are likely to be caused by one or more compact emitting regions. If only one region is reponsible for this modulation, it must be caused by a compact mid-to-high latitude region.
-
•
We measure a strong upper limit for rotational broadening using archive Chandra/HETG spectra. Taking instrumental and thermal broadening into account, this corresponds to a coronal km s-1 (i.e. ).
A simple model of AB Dor’s X-ray emitting corona consistent with the above diagnostics would have a homogeneously distributed component extending less than and/or an active region at the pole. The rotational modulation in the lightcurve and spectra indicates the presence of at least two compact emitting regions. Peaks in the lightcurve indicate that the regions are unlikely to be located higher than 0.4 above the stellar surface.
We have shown that while we still do not have the spectral resolution at X-ray wavelengths to comprehensively “map” the coronae of cool stars, we can trace velocity variations and use these to constrain the positions of emitting regions in the coronae of cool stars. Spectro-polarimetric ground-based observations of AB Dor have been carried out simultaneously with these Chandra observations. We will use Zeeman Doppler imaging techniques to map the surface magnetic field of AB Dor at this epoch, we will extrapolate these surface maps to produce detailed 3D coronal magnetic field and X-ray emission models. The X-ray emission model will be tested against the results presented here and will be the subject of a future paper.
Acknowledgements.
The authors acknowledge the data analysis facilities provided by the Starlink P roject which is run by CCLRC on behalf of PPARC. This work has been carried out thanks to the support of a Harvard Smithsonian CfA fellowship and an ESA Internal fellowship. GAJH would also like to thank R. Hoogerwerf for useful discussions.References
- [\astronciteBrickhouse et al.2001] Brickhouse, N.S., Dupree, A.K. & Young, P.R. 2001, ApJ, 562, 75
- [\astronciteChung et al.2004] Chung, S.M., Drake, J.J., Kashyap, V.L., Ratzlaff, P.W.& Wargelin, B.J. 2004, Proc. SPIE 5165: X-ray and Gamma Instrumentation for Astronomy XIII, eds. K.A. Flanagan, O.H. Siegmund, 518
- [\astronciteHoogerwerf et al.2004] Hoogerwerf, R., Brickhouse, N.S. & Mauche, C.W. 2004, ApJ, 610, 411
- [\astronciteHussain et al.2004] Hussain, G.A.J., Brickhouse, N.S., Dupree, A.K., Jardine, M., van Ballegooijen, A., Collier Cameron, A., Donati, J.-F., Favata, F., 2004, ApJ, submitted
- [\astronciteInnis et al.1988] Innis, J.L., Thompson, K., Coates, D.W., Evans, T.L. 1988 MNRAS, 235, 1411
- [\astronciteKürster et al.1997] Kürster, M., Schmitt, J.H.M.M., Cutispoto, G. & Dennerl, K. 1997, A&A, 320, 831