A search for clusters at high redshift
Radio galaxy PKS~1138$-$262 is a massive galaxy at , located in a dense environment. We have found an overdensity of Ly emitting galaxies in this field, consistent with a proto-cluster structure associated with the radio galaxy. Recently, we have discovered forty candidate H emitters by their excess near infrared narrow band flux. Here, we present infrared spectroscopy of nine of the brightest candidate H emitters. All these candidates show an emission line at the expected wavelength. The identification of three of these lines with H is confirmed by accompanying [N ii] emission. The spectra of the other candidates are consistent with H emission at , one being a QSO as indicated by the broadness of its emission line. The velocity dispersion of the emitters (360 km s-1) is significantly smaller than that of the narrow band filter used for their selection (1600 km s-1). We therefore conclude that the emitters are associated with the radio galaxy. The star formation rates (SFRs) deduced from the H flux are in the range 6 – 44 M⊙ yr-1 and the SFR density observed is 5–10 higher than in the HDF-N at . The properties of the narrow emission lines indicate that the emitters are powered by star formation and contain very young ( Myr) stellar populations with moderately high metallicities.
Key Words.:
Galaxies: active – Galaxies: clusters: general – Galaxies: evolution – Galaxies: lum function – Cosmology: observations – Cosmology: early Universe1 Introduction
High redshift clusters are prime subjects for the study of galaxy formation and cosmology. The powerful radio galaxy PKS 1138262 at appears to be the brightest galaxy in a high redshift cluster. We have discovered an overdensity of Ly emitters within 1.5 Mpc of 1138262 (Kurk et al., 2000, Paper I). The redshifts of 14 emitters were spectroscopically confirmed to be in the range (Pentericci et al., 2000, Paper II). In addition, we have carried out near infrared imaging (Kurk et al., 2004, Paper III). The number of band galaxies and extremely red objects in this field is higher than in blank fields. We found 40 objects with excess narrow band flux, consistent with H emission at . The surface density of H emitters increases towards the radio galaxy and their average magnitude is lower and therefore their inferred stellar mass higher than for the Ly emitters. Here, we present infrared spectroscopy of nine candidate H emitters to confirm their redshift and determine the velocity dispersion of the sample. We assume a flat Universe with and .
2 Selection, observations and data reduction
With the aim of detecting H emitting galaxies in the proto-cluster associated with PKS 1138262, imaging in and in a narrow band filter (, FWHM = 0.026) was carried out, employing two pointings covering a total field of 12.5 arcmin2. There are 40 objects with rest frame equivalent width (EW0) Å (see Paper III). From the list of 29 candidate H emitters within 13 from the radio galaxy, we selected those with H flux erg cm-2 s-1. Furthermore, we selected those that were conveniently located for placement in the slit for spectroscopic follow-up, which was carried out with ISAAC at VLT Antu (UT1)111Based on observations carried out at the European Southern Observatory, Paranal, Chile, project P68.A-0184(A).. The short wavelength camera of ISAAC is equipped with a Rockwell Hawaii 10242 pixel Hg:Cd:Te array which has a projected pixel scale of 0.147″. We used the medium resolution grating in second order resulting in a dispersion of 1.23 Å. The observations were carried out in the nights of March 23 and 25, 2002 under variable seeing, which was just below 1″ for most of the time. The 1″120″ slit employed resulted in a resolution of . During acquisition, the slit was first positioned on a bright point source (a star or the radio galaxy) and subsequently positioned at the midpoint between two candidates, which was always within 32″. We have employed four slit positions, each targeted at two or three candidate emitters for 3.5 hours (3.75 in one case). In total, nine candidates were observed, one of which was included in two slits. Per slit, we obtained 14 (15) frames of 15 minutes with offsets of 15, 18 or 20″ in ABBA sequence with additional random jitter offsets up to 5, 2, or 1″, respectively, to avoid recurrent registration of spectra on bad pixels. Standard stars were observed with the same slit at a range of airmasses during the nights to correct for telluric absorption and to calibrate the data in flux. All observations were carried out at airmass below 1.8.
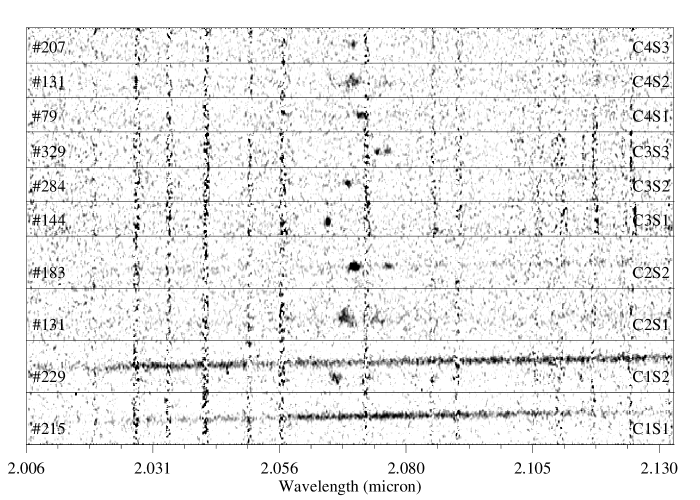
Standard data reduction was carried out using pairwise frame subtraction, resulting in a final frame with positive spectra accompanied by negative spectra on both sides. Care was taken during setup to ensure that these negative spectra did not overlap with positive ones. One dimensional spectra of the candidate emitters were extracted from the positive two-dimensional spectra using the spatial profile of a standard star spectrum observed during that night and averaged per 3 pixels yielding bins of 3.7 Å. The spectral resolution is 7 Å, as measured from the FWHM of the skylines. The wavelength calibration is based on the OH skylines observed. The telluric standards observed at a range of airmasses show only small variations (less than a percent on average). An average absorption spectrum per night was used to correct for telluric absorption. There are no spectrophotometric flux standards in the infrared. We have therefore used one of the telluric standards (Hip043868) with spectral type B1. Such stars have a featureless spectrum in this wavelength region given by a black body curve at T = 25,500 K. The curve was normalized to the magnitude of the star and subsequently used to divide the extracted and absorption corrected spectrum to obtain the flux calibration. The two dimensional spectra of all objects are shown in Fig. 1.
3 Results
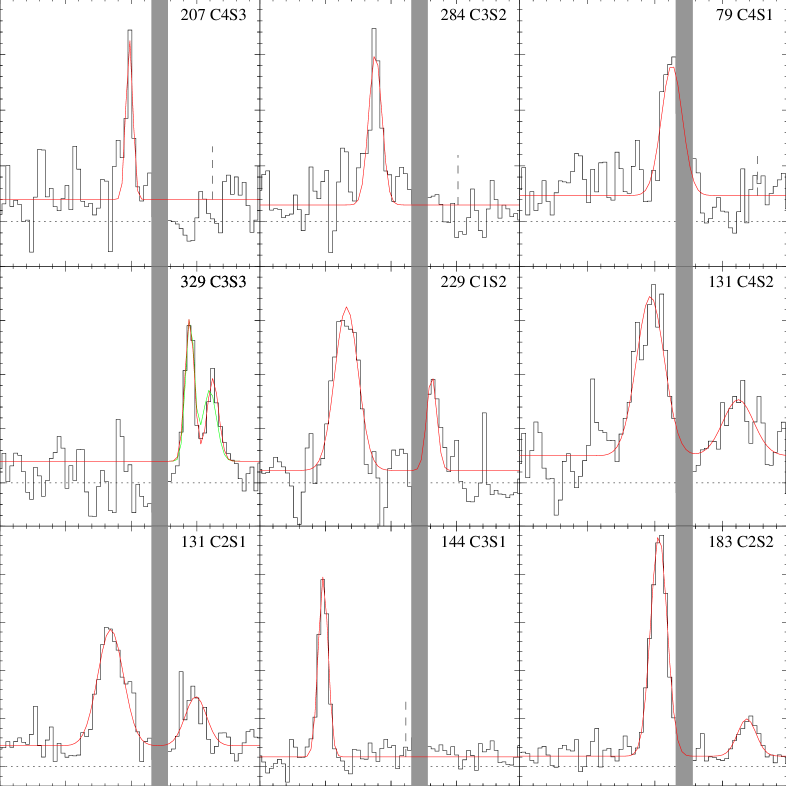
All candidates observed show an emission line, which means that our selection was 100% efficient. We have fit Gaussian curves to the emission lines applying a least squares method (see Fig. 2) in order to determine their central wavelength, deconvolved FWHM (if resolved), flux and EW0 (Table 1). Also presented in this table is the SFR derived from the H and UV luminosities (see discussion in Paper III), which is in the range 6 – 44 M⊙ yr-1. We do not detect continuum emission in most of the spectra, except in the co-added spectrum of candidate 131, 215 and the serendipitous object in slit one (0.60.6, 0.70.6 and 1.70.7 erg cm-2 s-1 Å-1, respectively), which compare favourably with the line subtracted broad band fluxes measured by imaging in paper III (0.6, 1.0 and 2.1 erg cm-2 s-1 Å-1, respectively). The EW0 is therefore based on the line flux measured in the spectra and the broad band magnitude measured on the images.
The spectra of objects 131, 183 and 229 were fit by two Gaussians for which the relative centers were fixed as for H and [N ii]Å. Candidate 329 shows two emission peaks only 17.82.7 Å apart. Both lines could be H emission from one galaxy with two components, seperated by km s-1 in velocity. We have considered the possibility that the lines are due to [O ii] emission at which would have a separation of 15.0 Å. The emission line ratio of the supposed [O ii] would be 0.7 which implies an electron density cm-3, normally only observed in the central parts of nebulae (Osterbrock, 1989). In addition, a faint () counterpart in the band, sampling a wavelength range below 912 Å for , makes the identification with [O ii] improbable. Candidate 131 was included in two slits, with a position angle difference of 40∘. The two fits to the spectra of emitter 131 indicate a velocity difference of 180 km s-1 which can be explained by the fact that different regions of the galaxy have been sampled.
For how many of the emission lines can we be sure that the identification with H at is correct? For the three objects with confirming [N ii] lines, we can be certain. For the QSO object 215, [N ii] is blended with the very broad H line and impossible to discern. Given a [N ii]/H line ratio of 1/3, we do not expect to detect the [N ii] line for objects 79, 207, 284, 329 above the noise and the identification with H is therefore consistent but not 100% certain. An identification with H for object 144 can only be true if the [N ii]/H ratio is (object 183 has an observed ratio of 1/5.5). An alternative identification with [O iii]5007Å is improbable, as we do not detect its counterpart [O iii]4958Å at 2.045. We consider this therefore a probable H identification.
At least three of the emission lines are spatially extended. In two cases, we detect unordered velocity structure, but the morphology of the two dimensional spectrum of candidate 229 resembles a rotation curve. A fit to this structure results in a rotation velocity of 50 km s-1 at 6 kpc radius, implying a dynamical mass of M⊙.
| ID | S | R.A. & Dec. (J2000) | Line | Fit | FWHM | Flux | EW0 | Hα SFR UV | O/H | |||||||
|---|---|---|---|---|---|---|---|---|---|---|---|---|---|---|---|---|
| (1) | (2) | (3) | (4) | (5,6) | (7) | (8) | (9) | (10) | (11) | (12) | (13) | |||||
| 79 | 4 | 11:40:52.62 26:30:01.0 | H | 1,2 | 2.1558 | 160 | 80 | 3.6 | 1.9 | 90 | 50 | 11 | 6 | 33 | 1 | |
| 131 | 2 | 11:40:51.28 26:29:38.7 | H | 3,1 | 2.1518 | 320 | 50 | 12.3 | 2.2 | 65 | 15 | 39 | 7 | 19 | 1 | 8.8 |
| [N ii] | 270 | 100 | 4.4 | 2.0 | 25 | 10 | 0.2 | |||||||||
| 131 | 4 | 11:40:51.28 26:29:38.7 | H | 3,1 | 2.1537 | 360 | 80 | 8.2 | 2.4 | 45 | 15 | 26 | 8 | 19 | 1 | 8.8 |
| [N ii] | 420 | 250 | 3.4 | 2.5 | 20 | 15 | 0.2 | |||||||||
| 144 | 3 | 11:40:43.45 26:29:37.5 | H | 1,3 | 2.1463 | 40 | 20 | 6.7 | 1.3 | 330 | 70 | 21 | 4 | 15 | 1 | |
| 183 | 2 | 11:40:46.15 26:29:24.9 | H | 3,1 | 2.1546 | 170 | 20 | 13.8 | 1.7 | 230 | 35 | 44 | 5 | 40 | 1 | 8.6 |
| [N ii] | 200 | 120 | 2.5 | 1.7 | 40 | 30 | 0.4 | |||||||||
| 207 | 4 | 11:40:50.20 26:29:21.0 | H | 1,2 | 2.1540 | 100 | 1.9 | 0.9 | 50 | 25 | 6 | 3 | 12 | 1 | ||
| 215 | 1 | 11:40:46.01 26:29:16.9 | H | 3,1 | 2.1568 | 5300 | 800 | 46.2 | 8.8 | 150 | 30 | † | ||||
| 229 | 1 | 11:40:46.10 26:29:11.5 | H | 3,1 | 2.1489 | 290 | 60 | 7.1 | 1.9 | 30 | 10 | 23 | 6 | 26 | 1 | 8.8 |
| [N ii] | 130 | 90 | 2.4 | 1.7 | 11 | 8 | 0.3 | |||||||||
| 284 | 3 | 11:40:45.58 26:29:02.4 | H | 1,2 | 2.1523 | 90 | 50 | 3.0 | 1.4 | 300 | 140 | 10 | 4 | 6 | 1 | |
| 329 | 3 | 11:40:46.88 26:28:41.4 | H | 2,3 | 2.1609 | 60 | 40 | 2.7 | 1.3 | 1350 | 700 | 9 | 4 | 7 | 1 | |
| H | 2,3 | 2.1636 | 110 | 30 | 2.0 | 1.1 | 1000 | 550 | 6 | 4 | ||||||
Notes: (1) Candidate number (2) Slit number (3) Coordinates (4) Line identification (5) Type of fit: 1) one Gaussian curve, 2) two Gaussian curves, 3) two Gaussians for H and [N ii] (6) Identification is 1) certain, detection of [N ii], 2) consistent, expected non detection of [N ii], 3) possible (7) Redshift with random error 0.0002, except for candidate 215, for which it is 0.002 (8) FWHM in km s-1 (9) Flux in 10-17 erg cm-2 s-1 (10) EW0 in Å (11) SFRHα in M⊙ yr-1 (12) SFRUV in M⊙ yr-1 (13) Metallicity in 12 + log[O/H] (†) H unrelated to SFR.
4 Discussion
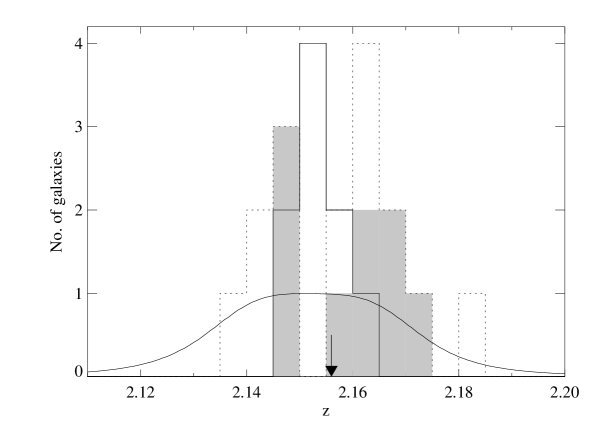
In Fig. 3 we show the redshift distribution of the 9 emitters, assuming that all emission lines can be identified as H. For this plot, we used the average redshift of the two lines of object 329. Also plotted is the sensitivity curve of the narrow band filter used to select the candidates. A random distribution of emitter redshifts would follow this curve. We have run a Monte Carlo simulation with 10,000 realizations of a randomly sampled distribution of emitters given this filter as selection criterium. Although the mean of the measured distribution is only 0.18 away from the mean of a random sample, its dispersion is much smaller, deviating by 1.75 from a random sample. The probability that the redshifts we measure are drawn from a random distribution is therefore 8%. Note that the redshift of the radio galaxy is 2.156 (Röttgering et al., 1997), very close to the mean of the selection filter (2.152), and to the mean of the measured redshift distribution (2.154). The distribution is consistent with a group of H emitters associated with the radio galaxy. The velocity dispersion of this group is 360 km s-1 (using the gapper sigma method, Beers et al., 1990), while the virial radius of the nine emitters is 0.45 Mpc, implying a virial mass of M⊙ (assuming that all lines can be identified with H and taking the mean of the two redshifts for object 131). This mass is merely illustrative as at this redshift it is improbable that the structure is virialized. The velocity dispersion of the H emitters is smaller than the velocity dispersion of the confirmed Ly emitters, both for the complete sample (1050 km s-1) and the nine within the solid angle of the two ISAAC fields (760 km s-1, shaded part of histogram in Fig. 3). There is no evidence for a bimodal redshift distribution as observed for the Ly emitters.
We can construct a complete sample out of the spectroscopic sample by excluding the two objects with the lowest H flux and including the radio galaxy. This collection represents all candidate H emitters with F erg cm-2 s-1 within 13 from the radio galaxy. The FWHM of the narrow band filter () and the solid angle given above define a comoving volume of 815 Mpc3, resulting in a volume density of 0.010 Mpc-3, which is a factor four higher than the density of confirmed Ly emitters in this field. All star forming objects detected have line fluxes lower than the high redshift H surveys discussed in Paper III, but we can compare the SFR density to the density at derived from H emission in the HDF-N as measured by Iwamuro et al. (2000). Following their cosmology (, ) and procedure to correct for the part of the H luminosity function below the detection limit, we obtain a SFR density of 0.48 M⊙ yr-1 Mpc-3. This is 10 (5) times higher than the (reddening corrected) value obtained for the HDF-N. Using the redshift range defined by the H emitters () results in values that are larger by a factor of two. Likewise, smaller SFR densities would result if some of the H lines have been misidentified.
The properties of the detected emission lines provide information about the physical conditions in the galaxies. The FWHM of the narrow nebular emission lines detected are in the range 40 – 360 km s-1 with an average of 190 km s-1. These values are comparable to those found for LBGs at by Pettini et al. (2001). The [N ii]/H ratio can be used to distinguish narrow-line active galaxies from H ii region-like galaxies (Veilleux & Osterbrock, 1987). The three emitters with detected [N ii] have log([N ii]/H) , which puts them among the star forming galaxies. In the absence of shock excitation, the [N ii]/H ratio can also be used as metallicity indicator. Using the empirical relation calibrated by Denicoló et al. (2002), the average ratio of the three emitters implies 12 + log(O/H) 8.7. This value is comparable to the broad range of values obtained for present-day spiral galaxies (van Zee et al., 1998). The EW0 of some detected narrow lines are surprisingly high, up to 1350 Å. This can be explained by very young stellar populations where the continuum radiation around 6000 Å is still very weak. EW0 values between 200 and 330 Å imply an age Myr (Leitherer et al., 1999). The moderately high metallicities found for the objects with detected [N ii] emission, however, require that the galaxies are near the end of the star formation event. This requirement seems to indicate that these emitters have undergone a very similar evolution.
5 Conclusion
Infrared spectroscopy has established the presence of nine line emitters within 0.6 Mpc of the HzRG PKS 1138262. Three emitters show an additional line which confirms the identification with H at , while four more have spectra consistent with H at this redshift, one being a QSO as indicated by the broadness of its emission line. One emitter shows only a single strong line, which is possibly H and one emitter exhibits two lines which probably originate from two emission line regions within one galaxy at . Additional evidence for identification of all observed lines with H is the small velocity dispersion (360 km s-1) as compared with the width of the selection filter. This dispersion is also smaller than the dispersion of the Ly emitters. The star formation rate density of the observed emitters is a factor ten higher than found at in the HDF-N. These results support the formerly advocated ideas that PKS 1138262 is located in a proto-cluster at . The properties of the narrow emission lines indicate that the emitters are powered by star formation and contain very young ( Myr) stellar populations with moderately high metallicities. It seems that we observe these galaxies near the end of their first and major burst of star formation.
Acknowledgements.
We are grateful to the ESO VLT staff for excellent support during the observing run. We acknowledge fruitful discussions with B. Venemans and S. di Serego Alighieri. Comments of the anonymous referee have also helped to improve the manuscript. This research has made use of the NASA/IPAC Extragalactic Database (NED) which is operated by the Jet Propulsion Laboratory, California Institute of Technology, under contract with the National Aeronautics and Space Administration. We have also made use of NASA’s Astrophysics Data System Bibliographic Services.References
- Beers et al. (1990) Beers, T. C., Flynn, K., & Gebhardt, K. 1990, AJ, 100, 32
- Denicoló et al. (2002) Denicoló, G., Terlevich, R., & Terlevich, E. 2002, MNRAS, 330, 69
- Iwamuro et al. (2000) Iwamuro, F., Motohara, K., Maihara, T., et al. 2000, PASJ, 52, 73
- Kurk et al. (2004) Kurk, J., Pentericci, L., Röttgering, H., & Miley, G. 2004, A&A, in press
- Kurk et al. (2000) Kurk, J., Röttgering, H., Pentericci, L., et al. 2000, A&A, 358, L1
- Leitherer et al. (1999) Leitherer, C., Schaerer, D., Goldader, J. D., et al. 1999, ApJS, 123, 3
- Osterbrock (1989) Osterbrock, D. E. 1989, Astrophysics of Gaseous Nebulae and Active Galactic Nuclei (University Science Books, Mill Valley CA, USA)
- Pentericci et al. (2000) Pentericci, L., Kurk, J., Röttgering, H., et al. 2000, A&A, 361, L25
- Pettini et al. (2001) Pettini, M., Shapley, A. E., Steidel, C. C., et al. 2001, ApJ, 554, 981
- Röttgering et al. (1997) Röttgering, H. J. A., van Ojik, R., Miley, G. K., et al. 1997, A&A, 326, 505
- van Zee et al. (1998) van Zee, L., Salzer, J. J., Haynes, M. P., O’Donoghue, A. A., & Balonek, T. J. 1998, AJ, 116, 2805
- Veilleux & Osterbrock (1987) Veilleux, S. & Osterbrock, D. E. 1987, ApJS, 63, 295