Surface Magnetic Field Distributions of the White Dwarfs PG 1015+014 and HE 10450908
Abstract
We have applied the method of Zeeman tomography to analyze the surface magnetic field structures of the white dwarfs PG 1015+014 and HE 10450908 from spin-phase resolved flux and circular polarization spectra obtained with FORS1 at the ESO VLT. We find for both objects field topologies that deviate significantly from centred dipoles. For HE 10450908, the frequency distribution of magnetic field strengths is sharply peaked at 16 MG for all rotational phases covered by our data but extends to field strengths at least five times this value. In the case of PG 1015+014 there are significant contributions to the frequency distribution in the range from 50 to 90 MG with the maximum near 70 MG. The detailed shape of the frequency distribution is strongly variable with respect to the rotational phase.
1 Institut für Astrophysik,
Friedrich-Hund-Platz 1, D-37077 Göttingen
2 Astronom. Rechen-Institut, Mönchhofstr. 12–14,
D-69120 Heidelberg
3 Department of Physics, Univ. of Warwick, Coventry CV4 7AL, UK
1. Zeeman Tomography
The optical spectra of magnetic DA white dwarfs are dominated by broad Balmer absorption patterns which are characteristic for the magnetic field structure in the visible part of the photosphere. Our evolution-strategy based Zeeman tomography code allows the determination of the surface magnetic field geometry from a set of rotation-phase resolved flux and circular polarization spectra by fitting theoretical model spectra from a precomputed database on a grid of temperature , field strength , and the angle between the field direction and the line of sight. The method’s ability to reconstruct field geometries from synthetic data has been demonstrated by Euchner et al. (2002). For the present study, the magnetic field geometry has been parametrized using a truncated multipole expansion up to order .
2. Observations
Our VLT/FORS1 observations were carried out in May (PG 1015+014), Jun and Dec 1999 (HE 10450908) in spectropolarimetric (PMOS) mode. In order to eliminate Stokes parameter crosstalk, circular polarization (/) spectra were computed from two subsequent flux spectra taken with the retarder plate rotated by 45∘. We compensated for wavelength-dependent seeing-induced flux losses by normalizing the flux spectra to a mean continuum level (Fig. 1).
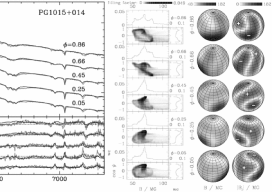
3. PG 1015+014
We collected the spectra into 5 phase bins covering the whole rotation cycle according to the ephemeris of Schmidt & Norsworthy (1991). The spectra are characterized by sharp, distinct Zeeman features without pronounced H triplet structure, thus indicating that the dominating field strengths exceed 50 MG. The best-fit magnetic field structure (Fig. 2) differs clearly from a simple centred or offset dipole. The frequency distribution of field strengths peaks at 70 MG with an additional peak at 80 MG for and 0.86. Since there are still substantial deviations between observed and best-fit spectra, we conclude that the real field structure is too complex to be modelled adequately by a truncated multipole expansion up to . This conclusion seems to be justified because for other objects studied by us (e.g. HE 10450908, see below) the multipole expansion yields satisfactory results.
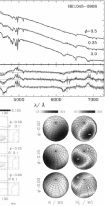
4. HE 10450908
By comparing our observations to those of Schmidt et al. (2001) it seems plausible that our sequence corresponds to 0.5 of the rotation cycle. Thus, we tentatively collect our data into 3 phase bins (0, 0.25, 0.5). The spectrum shows a typical low-field H triplet structure generated by a rather uniform field distribution of 16 MG that is shallowed out in the subsequent phases by increasing high-field contributions (Fig. 3). Although the model fits the overall shape of the observed spectra fairly well, some small deviations are still obvious. An insufficient resolution of our database in the low field regime and our simplified linear limb-darkening law are two possible causes.
References
Euchner, F., Jordan, S., Beuermann, K., et al. 2002, A&A, 390, 633
Schmidt, G. D., & Norsworthy, J. E. 1991, ApJ, 366, 270
Schmidt, G. D., Vennes, S., Wickramasinghe, D. T., & Ferrario, L. 2001, MNRAS, 328, 203