A new method for the UHECR mass composition studies
Abstract
The determination of the primary cosmic ray mass composition from the longitudinal development of atmospheric cascades is still an open problem. In this work we propose a new method of the multiparametric topological analysis and show that if both - the depth of shower maximum and - the number of charged particles in the shower maximum are used, reliable results can be obtained.
1 Introduction
The study of the longitudinal profile of individual atmospheric cascades started in the early eighties with the development of the fluorescent light detection technique implemented for the first time within the framework of the Fly’s Eye experiment [1]. After these pioneering efforts, there has been only one experimental array continuing this type of studies: HiRes [2] and only recently a new and much more powerful detector has started to collect data: the Fluorescent Detector (FD) of the Pierre Auger Observatory [3]. This instrument will produce a large data flow over the next decades and is therefore calling for new and accurate data analysis procedures capable to fully exploit the large amount of information contained in the FD data.
It is rather surprising, that while there are many methods, both parametric and non-parametric (KNN, Bayesian methods, pattern recognition, neural nets etc.), used to discriminate individual cascades on the basis of ground–based information, very little has been done to fully exploit the amount of information contained in FD data. To our knowledge, the only method available so far makes use of - the depth of the maximum cascade development [4] and derives the observed mean mass composition as a function of the primary energy. Since there is a minimum bias in the detection of cascades of different origin, the observed mass composition coincides practically with the primary composition. It has to be stressed also that this approach relies on statistical grounds and therefore does not allow the identification of the primary particle for each individual cascade. Furthermore, even though in the longitudinal profile the parameter is the most sensitive to the mass of the primary particle, its sensitivity is still weak. For instance, at a primary energy of 1 EeV (1018eV) the mean iron induced cascade has only (11-12)% lower than for a proton induced one, i.e. a difference which is of the same order of magnitude as the intrinsic fluctuations of .
As we shall discuss below, such unsatisfactory situation improves drastically if other, seemingly less significant parameters, are taken into account. Among them, we might have: - the number of particles (mostly electrons) in the maximum of the cascade, the speed of rise in the particle number etc. For instance, at fixed primary energy, is about the same for all cascades, and even though iron induced cascades produce more muons and less energy is carried out by the electrons, the effects on are very small. However, due to the lower energy per constituent nucleon in the primary iron nucleus, the cascade development and the rise of the cascade curve are on average faster than for cascades originating from protons. This useful information is neglected when only is taken into account. This type of arguments triggered our efforts to find methods capable to fully exploit the information contained in the cascade curves and to allow the identification (at least in terms of probabilities) of the cascade origin also for individual showers.
Although tailored for possible applications in the context of the Pierre Auger experiment, methods described below are quite general and may find application in other similar experiments. However, in what follows we shall focus on data similar to those expected from the Fluorescent Detector (FD) of the Pierre Auger Observatory: namely on the longitudinal profile of each atmospheric cascade, i.e. on the number of charged particle as a function of the atmospheric depth . As it will be shown below, this profile carries more information than or alone.
We would like to stress that even though the fraction of the hybrid events, in which the information on the shower from the Pierre Auger Surface Array is supplemented by the Fluorescent Detector data, will hardly exceed 10% of the total statistics accumulated by the Surface Array, these events need to be properly handled since they contain the maximum information. In this paper we restrict ourselves to the analysis of the longitudinal development of cascades. The treatment of hybrid data will be addressed in subsequent papers.
2 The simulated data
In what follows, we assume that the primary energy estimates for hybrid events will be accurate at a few percent level [5]. The data set used to implement and test the methods described in the following sections consists of 7600 vertical cascades produced by particles with the fixed energy of 1 EeV, simulated using the CORSIKA program (version 6.015, [6]) with the QGSJET interaction model. Simulations were performed at the Lyon Computer Centre. The primary nuclei were , , and , each of them initiating 1900 cascades. The CORSIKA output provides the number of charged particles at atmospheric depths sampled with 5 gcm-2 intervals.
We clipped the data at a depth of 200 g cm-2, since the FD detection threshold does not allow to detect the weak signals at the beginning of the cascade development. The maximum atmospheric depth was set at 870 g cm-2, roughly corresponding to the level of the Pierre Auger Observatory. In Figure 1 we show a subsample of 50 cascades for each primary.

3 Multiparametric Topological Analysis (MTA)
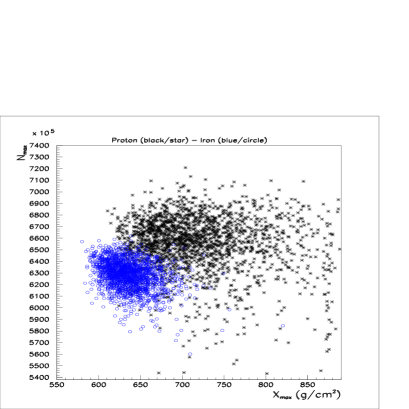
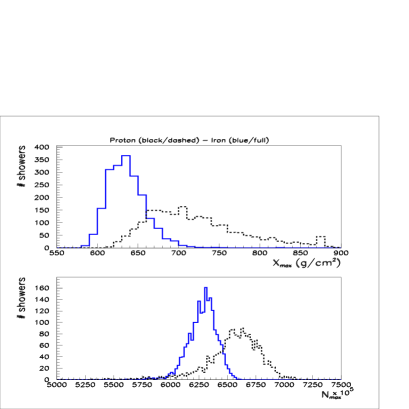
The MTA method, when applied to FD data, relies on a topological analysis of correlations between the most significant parameters of the shower development in the atmosphere. In principle this method could be used also with a greater number of parameters, however, in this paper we restrict ourself to the simple case of two parameters only: Xmax (the atmospheric depth of the shower maximum) and Nmax (the number of charged particles at the depth of Xmax). A scatter plot of these two parameters has been built using the showers already described. Figure 2 shows the scatter plot for only proton and iron induced showers while their projected distributions are shown in Figure 3.
The basic idea of the MTA method is to divide the entire area of the scatter plot into cells whose dimensions are defined by an accuracy with which the parameters can be measured. In our simulations the value of 20 g/cm2 was used as the width of Xmax bin, while 50 was assumed for the width of Nmax bin. In each cell we can find the total number of showers N, as the sum of N, N, N and N showers induced by P, He, O and Fe respectively, and then derive the associated frequencies: p=N/N, p=N/N, p=N/N and p=N/N which can be interpreted as the probability for a real shower falling into the cell to be initiated by proton, helium, oxygen or iron primary nuclei. In other words, in the case of an experimental data set of showers, it may be seen as composed of a mixture of Nexp x pP proton showers, Nexp x pHe helium showers, Nexp x pO oxygen showers and Nexp x pFe iron induced showers, where pp.
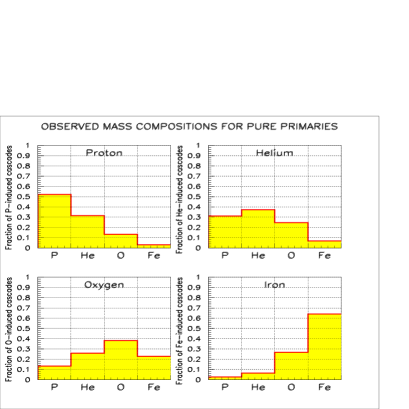
In order to generate the scatter plot and produce the relevant matrix of cells we used a set of 41000 simulated showers. Then we used another subset of 4300 showers to determine the probabilities . For each individual shower in a given subset the partial probabilities p , p, p and p have been read from the relevant cell i. The sum of such probabilities over the entire subset of 300 showers permits to estimate the probability pA for a shower of a given nature to be identified as a shower generated by the , , or primary particle. This probability is shown in Figure 4. One can see that the method works quite well being able to attribute the highest probability to the correct nuclei.
4 Determination of the primary mass composition
The obtained mean probabilities for cascades induced by type nuclei to be identified as those induced by nuclei for the pure primary mass composition can be used for the reconstruction of the mixed primary mass composition as the coefficients in the system of linear equations:
| (1) | |||||
where (, , and ) are the true numbers, which determine the primary mass composition in the sample of cascades, which are observed as , , and , due to a misclassification.
In order to invert the problem and to reconstruct the abundances in the primary mass composition from the observed abundances and the known probabilities , we can apply any method capable to solve the inverse problem taking into account possible errors of the observed distribution and the constraint:
| (2) |
The observed abundances were simulated using a set of 4600 cascades different from those used for the determination of . At the moment the result of the solution for the uniform primary mass composition with all abundances = 0.25 reconstructed by MTA method is , , and .
As an example of the non-uniform mass composition we have taken the case with = 0.1, = 0.4, which resembles the mass composition of cosmic rays at the knee energy of 3 PeV [7]. The total number of cascades used for the simulation of non-uniform mass composition is 1500 (150 + 600 + 600 + 150). The result of the solution for this case is , , and .
It is seen that absolute values of the abundance are reconstructed satisfactorily. For the time being the values of the probabilities are assumed to be known precisely. A more accurate solution of the system, taking propely into account the errors of the probability, is under study.
5 Application for experimental cascades
It has to be stressed that all the results outlined above are biased by the fact that we are dealing with simulated ’noiseless’ data and more realistic testing has to be performed using data which take into account the varying primary energy, the inclination angle, the instrumental signature (noise) and the various sources of errors (uneven and incomplete sampling, etc.). Application of MTA is straightforward - the relevant simulations should be made with a maximum possible statistics.
6 Conclusions
We proposed and tested the Multiparametric Topological Analysis method for the determination of the mean primary cosmic ray mass composition on the basis of measurements of the longitudinal development of atmospheric cascades. The method employs more information about the longitudinal development of atmospheric cascades than just the depth of the cascade maximum. Definitely the method needs further developments before being used for processing real experimental cascades, but the first results are very encouraging. The next efforts should include the increase of simulation statistics, the study of the effect of the shower energy spectrum and angular distribution, the accurate estimate of the reconstruction errors. The great advantage of the proposed MTA method is that it is extremely easy to use and generalize for a larger number of observables.
Acknowledgements
Authors thank M.Risse for simulations of cascades used in this work and K.-H.Kampert and L.Perrone for useful discussions.
References
- [1] Baltrusaitis R.M. et al. 1985, Nucl.Instr.and Meth. A 240, 410
- [2] Matthews J.N. et al., HiRes Coll., 2001, 27th Int. Cosm. Ray Conf., Hamburg, 2, 350
- [3] AUGER Collaboration, 2004, Nucl.Instr.and Meth. A 523, 50
- [4] Gaisser T.K. et al. 1993, Phys. Rev. D47, 1919
- [5] Pierre Auger Project Design Report, October 2001
- [6] Heck D. et al. 1998, FZKA Report Forschungszentrum Karlsruhe 6019
- [7] Kampert K.-H. et al., 2004, astro-ph/0405608