Submillimetre continuum emission from Class 0 sources: Theory, Observations, and Modelling
Abstract
We report on a study of the thermal dust emission of the circumstellar envelopes of a sample of Class 0 sources. The physical structure (geometry, radial intensity profile, spatial temperature and spectral energy distribution) and properties (mass, size, bolometric luminosity () and temperature (), and age) of Class 0 sources are derived here in an evolutionary context. This is done by combining SCUBA imaging at 450 and 850 m of the thermal dust emission of envelopes of Class 0 sources in the Perseus and Orion molecular cloud complexes with a model of the envelope, with the implementation of techniques like the blackbody fitting and radiative transfer calculations of dusty envelopes, and with the Smith evolutionary model for protostars. The modelling results obtained here confirm the validity of a simple spherical symmetric model envelope, and the assumptions about density and dust distributions following the standard envelope model. The spherically model reproduces reasonably well the observed SEDs and the radial profiles of the sources. The implications of the derived properties for protostellar evolution are illustrated by analysis of the , the , and the power-law index of the density distribution for a sample of Class 0 sources.
keywords:
Stars: formation, circumstellar matter, low-mass – radiative transfer – dust –submillimeter1 Introduction
The earliest evolutionary phase of star formation, in which a deeply embedded protostar is known to exist, is the so-called Class 0 stage (André et al. 1993). Since protostars in this phase (Class 0 sources) are highly obscured by extended dusty envelopes, they can be observed mainly in the far-infrared to millimetre wavelength range. Specifically, a Class 0 source consists of a central protostellar object surrounded by an infalling dusty envelope and a flattened accretion disk. Many (presumably all) Class 0 sources are associated with strong molecular flows, usually more energetic than those from Class 1 sources (Davis & Eislöffel 1995).
Since Class 0 sources will determine most of the early evolutionary history of the protostars as they evolve toward main-sequence stars, it is crucial to determine the physical conditions within the envelope of Class 0 objects. However, because of detection difficulty, constraining physical properties of Class 0 sources is a challenging task. Nevertheless, continuum submillimetre observations of these sources let us to detect dust emission of the massive circumstellar envelopes, and provide a powerful tool for constraining the distribution of matter (Adams 1991).
Independent methods of detection of Class 0 sources, and techniques and useful ways to help to the interpretation of properties of protostars have been developed and used during the last years (e.g. comparation of submillimetre with near infrared surveys of a star forming region (Stanke et al. 2000), interpretation from the dust emission (Shirley et al. 2000), blackbody fitting (Chini et al. 2001), radiative transfer codes (Wolf et al. 1999), evolutionary models for protostars (Smith 2002)). In this work, we combine them and develop an approach in order to constrain the structure (geometry, radial intensity profile, spatial temperature, and spectral energy distributions (SEDs)), and physical properties (mass, size, bolometric luminosity () and temperature (), and age) of Class 0 sources. Specifically, we combine the information from the dust emission with a physical model of the extended envelope, the implementation of techniques like the blackbody fitting and the 1D continuum self-consistent MC3D radiative transfer code (by Wolf et al. 1999), and the Smith evolutionary model for protostars (by Smith 2002).
To describe and study stellar evolution, the Hertzsprung -Russell Diagram (HRD) has become the main way. However, to study protostellar evolution, the – diagram (BLTD, bolometric luminosity-temperature diagram) was proposed as direct analogue to the HRD (Myers & Ladd 1993; Myers et al. 1998). There, Class 0 sources are characterised by the lowest values of all protostars. Although the BLTD provides a useful way to study the evolution of protostars for all evolutionary phases of relevance for star formation (Myers et al. 1998), nevertheless, the Smith scheme predicts the evolution of and as an envelope of initial mass and temperature dissipates on a timescale and forms a star.
2 Theory
How can we describe the protostellar emission from the envelope? In order to facilitate the interpretation of submillimetre observations, we adopt the standard envelope model (Adams 1991) to keep the problem as simple as possible. The circular symmetry of the observed emission (see Rengel 2004), and the lack of significant internal structure justifies the simplicity of a spherical model case. If the emission is optically thin, the observed intensity for a spherically symmetric protostellar envelope at an impact parameter is given by Eq. 1 assuming a single power-law index of the opacity .
| (1) |
is the outer radius, the density, the dust temperature, the opacity of the dust grains, and the Planck function at dust temperature .
The current theory suggests that the density and temperature distributions are power-law indices ( and , respectively, see e.g. Adams 1991). If the emission is in the Rayleigh-Jeans limit and if , Eq. 1 can be approximated to (where is the power-law index of the observed intensity profile, and is the normalization factor to the peak emission).
3 Observations
To investigate the physical structure, processes, and properties of Class 0 sources, six star forming regions were observed in the Perseus and Orion molecular cloud complexes at 450 and 850 m with the Submillimetre Common-User Bolometer Array (SCUBA) camera at the James Clerk Maxwell Telescope (JCMT) on Mauna Kea, Hawaii. The target regions were \objectL1448, \objectL1455, \objectNGC 1333, \objectHH211, \objectL1634, and \objectL1641 N. A distance of 300 pc for L1448 is assumed according to Bachiller & Cernicharo [1986], 350 pc for L1455, NGC 1333 and HH211 (Chandler & Richer 2000, and Herbig & Jones 1983), 460 pc for L1634 (Bohigas et al. 1993), and 390 pc for L1641 (Anthony-Twarog 1982).
As an example, the resulting combined SCUBA maps at 450 and 850 m of L1455 overlaid with isophotal contour plots are shown in Fig. 1.
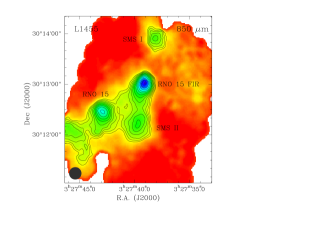
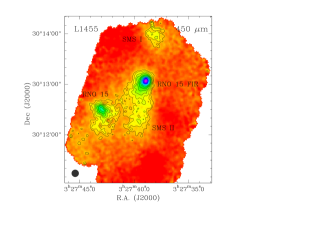
From these continuum SCUBA maps, 36 submillimetre sources ( 3) are detected (26 in Perseus and 10 in Orion). Some of them are extended, and many contain multiple condensations, as well as extended diffuse features. Twelve objects are reported for the first time (six in Perseus and six in Orion), and fifteen sources are analyzed here. Additionally, the first detailed submillimetre observations of the two regions NGC 1333 South and L1641 N have been obtained and are discussed in Rengel (2004), unveiling objects previously unknown. The survey also reveals a large number of small groups (Rengel et al. 2003).
3.1 Derivation of parameters from the emission
Physical parameters like the dust submillimetre spectral index (this value is related directly to the dust emissivity exponent by = - 2), gas and dust masses, and sizes of the envelopes are derived. The dust submillimetre spectral index is defined by
| (2) |
The mean value of for these objects is 2.8 0.4, implying that the regions investigated here are quite cold (10 K). Such low dust temperatures have for example also been found for isolated globules in the Perseus region (see e.g. Myers & Benson 1983), suggesting an exponent for the dust grain opacity, . The failure of the Rayleigh-Jeans approximation could increase the value of .
An aspect ratio was defined for each of the sources by dividing the semi-major and minor axis lengths as measured typically at the 97% contour. We find that the observed aspect ratios of the protostellar emission maps lie in the range 1.0-2.0 with an average value of 1.3 0.1, suggesting that the envelopes of Class 0 sources can be described approximately as spherically symmetric. Nevertheless, a departure of this symmetry, i.e., from an aspect ratio of 1, in some cases is found. This mismatch could be produced by several factors like magnetic fields of energy densities sufficiently large to influence the object structure and cause flattening along field lines, the bipolar outflow, rapidly rotating structures, or high levels of angular momentum (Rengel 2004).
The average value of the gas and dust mass of the sample, based on the thermal emission from the dust according to Hildebrand (1983), is 2.5 0.6 M⊙ (typical aperture 45′′). In order to derive physical properties of the sources from the observed azimuthally averaged radial intensity profiles of the thermal emission from the dust, like the power-law index of the temperature distribution as a function of the radius () , , , and the envelope sizes, the standard envelope model (Adams 1991) was adopted. Assuming that the observed sources can be fitted by a power-law intensity distribution as Class 0/1 sources, the average value of is at 850 m and at 450 m. Following the analytic estimate for the intensity (Adams 1991), these values of correspond to the expected ones for very young objects: theoretical models as well as numerical simulations of the collapse of an isothermal sphere (e.g., Shu 1977; Larson 1969; Penston 1969) also predict power-law indices of the density distribution, () , with 2.0. Considering = + -1, the first two order terms of the equivalent power-law index of the observed intensity (Adams 1991), the values = as well as = and 2.30.1 (at 450 and 850 m, respectively) are found. In Fig. 2, the normalized radial profiles [()/(0)] (being (0) the observed peak flux) of RNO 15 FIR as an example are plotted versus .
To estimate the source size, an outer diameter corresponding to the measured Half Power Beam Width (HPBW) size is adopted. The observed sources are surrounded by extended envelopes, having typical sizes of 1500-6000 AU (at 450 m) and 4000-9000 AU (at 850 m).

4 Modelling
4.1 Blackbody fitting
Accurate SEDs are computed for nine sources combining existing multi-wavelength surveys with the submillimetre data obtained in Sect. 3 (Rengel 2004), and fitting a modified blackbody curve to the fluxes (Froebrich et al. 2003). This method computes a grid of different blackbody curves of the form (3) in which the temperature, the optical depth at 100 m and are varied ( K K; ; ). Specifically, curves of the form (3) are convolved with the filter curves of the used filter bands (Eq. 5), and compared to the data-points. The model that best fits the observational data is determined. We derived the bolometric temperature and luminosity, size of the envelope, and sub-millimetre slope for each source.
In local thermodynamic equilibrium, the solution of the equation of transfer for an isothermal object that subtends an effective solid angle is given by the emergent flux density :
| (3) |
) denotes the Planck function for a dust temperature , and the dust optical depth. The optical depth can be expressed by
| (4) |
is in m, the optical depth at 100 m () is a free parameter, and is the submillimetre slope of the SED (=0 corresponds to a blackbody).
But we do not observe the emergent flux density directly, we observe , the emergent flux detected across a filter , which has a filter transmission curve . is calculated by
| (5) |
for each filter separately using the filter transmission curves . For details about how the calculations of the maximum likelihood were performed, see Froebrich et al. (2003).
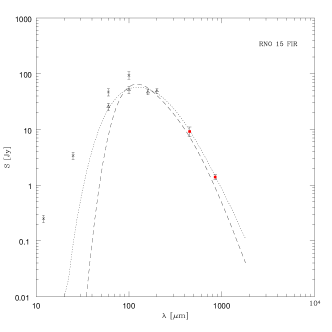
The SEDs revealed that the sample consists of cool objects ( ranges of 27-50 K) which have of 4-85 L⊙. Thus, by means of the sub-millimetre to bolometric luminosity ratio, \objectL1448 NW, \objectL1448 C, \objectRNO 15 FIR, \objectNGC 1333 IRAS 1, \objectNGC 1333 IRAS 2, \objectHH211-MM, \objectL 1634, \objectL 16 41 N, and \objectL1641 SMS III are Class 0 sources. For detailed computations of the associated errors to each determined parameters, see Rengel (2004). In Fig. 4 (bottom, short dashed lines), best obtained fit to the data-points using our approach and overplotted the combined data of \objectRNO 15 FIR are shown as an example.
Because of the IRAS 12 and 25 m points are usually far above the fit to the SED (e.g. Chini et al. 2001; Barsony et al. 1998), and of the unclear quantification of a higher bolometric temperature value caused by filter leaks, outflow/dust interactions or envelope emission if these IRAS points are included on SED computations (4 K Froebrich et al. 2003), these points are excluded on the target list and on the blackbody fits performed here. In Fig. 4, the blackbody curve and the data-points show significant deviations at the Infrared Astronomy Satellite (IRAS) 12 and 25 m points for the Class 0 sample. If these data-points had correct flux measurements, the sources would exhibit an excess of mid-infrared emission which could be caused by ongoing outflow/dust interactions. Because it is likely that these IRAS points are incorrect in some cases, further mid-infrared observations of these objects are necessary in order to investigate the nature of this possible excess.
4.2 MC3D radiative transfer code
Results from the standard theory provide the first direct insights into observable estimations (e.g. and , Sect. 3.1). Nevertheless, the temperature profile will diverge from a single power-law as the envelope becomes optically thick at the primary wavelengths of energy transport (inner portion of the envelope) (e.g. Shirley et al. 2000). Here it becomes necessary to calculate the temperature distribution self-consistently by implementation of a radiative transfer code.
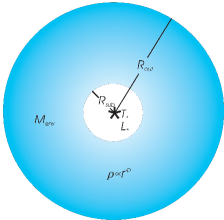
Detailed physical interpretation of the internal structure of nine objects is realized by intensive computer radiative transfer modelling. In particular, dust temperature distributions, SEDs, and intensity maps are derived self-consistently by the MC3D code (Wolf et al. 1999). The basic model assumed is: a central heating source that is embedded within a spherical symmetric dust envelope of mass . The central source is characterized by a stellar luminosity (), and an effective temperature (). The dust envelope is specified by an outer radius (), a density power-law index , an inner radius of the envelope , which is set by the dust destruction radius (also called sublimation radius) adopted to a temperature of 1500 K, the dust destruction temperature of graphite (e.g. Adams & Shu 1985, which occurs at a temperature of 1500 K; Myers et al. 1998). The central source luminosity is the sole source of luminosity for the envelope, so =. Fig. 3 shows a scheme of the adopted model. The validity of this model, and physical parameters of the sources (e.g. envelope masses, density distributions, sizes, and sublimation radius) are derived by finding the consistency between observed and modelled SEDs, and radial profiles (Sect 4.3; Rengel et al. 2004).
The dominant opacity source in the radiative transfer models is dust grains. The characteristics of grains in Class 0 sources are unknown. However, graphite and silicate grains have been proposed as likely consistent of Galactic dust. The grain distribution adopted here consists of small interstellar grain size 0.005-0.25 m, with mixing of astronomical silicate and graphite (relative abundances: 62.5 % & 37.5 % (respectively)), and the Draine & Lee (1984) optical constants to describe grain properties. The adopted model assumes that the dust properties are not a function of radius in the envelope. The gas-to-dust mass ratio is adopted to be 100:1, whereby we use a dust grain density of 3.6 g cm-3. The wavelength grid (60 wavelengths) are chosen to cover the relevant range.
In order to derive the physical structure of the envelope, three steps are carried out: the first step constrains the spatial temperature structure of the circumstellar envelope, the second step determines the simulated SED, and the third step, derives the emission, which provides the intensity structure. These last observables lead to test the model. At this point it is necessary to keep in mind that the values of the inferred parameters are valid only within the framework of the model assumptions considered here. In Fig. 4, the temperature profile, and best simulated and observed SEDs for RNO 15 FIR are shown as an example.

The central source should radiate from a specific radius , where the layer changes between the optically thick and the thin regime. This radius is called “photospheric radius” or “effective photosphere”, which depends on the wavelength and the molecule species. Crudely, the observed emission arises from a “characteristic” layer at =1 (Myers et al. 1998) or 2/3 (Kenyon et al. 1993; Hartmann 1998). The temperature distribution changes its character inside the photospheric radius, where the envelope is optically thick; trapping of radiation causes the temperature gradient to become steeper than in the optically-thin case. To calculate the photospheric radius, =1 and the spherically symmetric optically thick envelope of Myers et al. (1998), with an inner radius , a density and an outer radius , are adopted here for simplicity. Following this model, the photospheric radius is given by
| (6) |
being the optical depth from to .
Following the Myers et al. (1998) model, a sublimation radius of 3-5 AU at 450 m, =1 and =2 (10 AU for =1.5) is estimated, which is roughly the same as the radius of the photosphere.
As result of the modelling, it is found that the physical structure of a Class 0 envelope is characterized by the gas and dust temperature distribution () , and the density distribution () , with =0.4 and in the range of 1.5-2. In the inner part of the envelope (10 AU), () departs from the single-power law index of 0.4, resulting in a steeper inner temperature profile. This phenomenon can be produced probably by thermal convection in the inner envelope and causing zones of dust destruction by evaporation when the envelope becomes optically thick (e.g. Lin & Papaloizou 1980). accounts for the effects of this heating.
4.3 Comparison of models with observations
We estimate the parameters for the Class 0 sources by comparing the observed SEDs obtained by blackbody fitting (Sect. 4.1) and the simulated SEDs from the envelope fitting procedure (Sect. 4.2). Following the same technique as Kenyon et al. 1993, the best model for a given observational SED is determined by minimizing the normalized sum of the weighted squared residuals,
| (7) |
where is the observed flux at wavelength , the scaled flux of the model, and a weighting factor111a weighting factor is empirically given to the consistency between the modeled and observed SED, with dependence on the wavelength. Reasonable weights are given from the uncertainties in each region of the SED.. Given the uncertainties in estimating observational errors and the limitations of the models, a more complicated fitting treatment is unjustified. Because of the uncertainties in opacity, the difficulties in matching observational beam size with model results, and the possible contribution of disks to the submillimetre region (c.f. Beckwith et al. 1990; Butnet et al. 1991; Keene & Masson 1990), we used weights =1 for wavelengths 60 m 300 m, and chose =0.5 for 300 m 1000 m. Data-points taken at wavelengths shorter than 40 m are excluded in the comparation calculations because they are expected to be optically thick and therefore very sensitive to asymmetric geometries (e.g. outflow cavities and flattened envelopes), which are currently unable to be modelled. Because of the spectral range considered here does not extend much over long wavelengths, data-points taken at wavelengths longer than 1000 m are rejected.
As it is claimed previously, a comparison between best simulated and observed SEDs, and between simulated and observed radial profiles led us to check the reliability of the model. In order to create the simulated radial profile, the envelope emission at 850 m is calculated as an image from the MC3D code for each source, and convolved by the SCUBA beam. Fig. 5 shows the observed and simulated radial profile of \objectRNO 15 FIR as an example.
We conclude from our comparison that the assumption of spherical symmetry in the envelope is a reasonable approximation to study the envelope of Class 0 sources. Nevertheless, deviations from this geometry between observed and modeled SEDs at short wavelengths, and between observed and simulated radial profiles of relatively spherical Class 0 sources become extremely prominent (e.g. for RNO 15 FIR and NGC 1333 IRAS 1) (see Rengel 2004). In addition, small differences between observed and simulated radial profiles are observed for HH 211-MM and RNO 15 FIR (aspect ratios of 1.2 and 1.3 at 850 m, respectively). This discrepancy could be due to the exclusion of a non-spherical geometry, of cavities produced by molecular outflows, or of a flattened disk in the model; it could also be due to specific assumptions considered here, e.g. a single point-like nature of the sources (e.g. it is uncertain that HH211-MM and RNO 15 FIR are point-like sources (Eislöffel et al. 2003; Davis et al. 1997, respectively)), and a constant dust opacity with radius in the model.

4.4 Bolometric luminosity-temperature diagram
The observed properties of Class 0 sources can be understood more thoroughly if it is assumed that the objects evolve in time. Using the Smith protostellar evolutionary scheme (Smith 2002), and constructing the – diagram for the sample, the age, the infall rate, and the envelope mass as a function of time are estimated for the detected Class 0 sources (Rengel 2004). In particular, comparing the positions of the objects with an evolutionary model age and mass of the envelope of each source are derived (Fig. 6, filled triangles).

The tracks in Fig. 6 are derived by combining the Unification Scheme, as reviewed by Smith (2000, 2002), with the framework for protostellar envelopes presented by Myers et al. (1998).
For the sample, the resulting model-dependent ages of Class 0 sources are in a range from 1 to 3 yr. The evolution of these sources is traced by , which typically increases systematically between 25-50 K. The resulting bolometric luminosities span a range between 5-85 L⊙.
Following the Smith scheme (with an accretion rate not constant in time, Smith 2002), the accretion rate at the earliest Class 0 stage increases exponentially for a short interval of time (with an accretion peak in 1.5104 yr), and then declines later on (Rengel 2004).
Is there a correlation of the power-law index with time? We plot the estimated values of as a function of . Fig. 7 suggests a density structure of () at younger ages, evolving to () at later times. In order to investigate this with a larger spread, a Class 1 sample is mandatory.

5 Results
Table 1 lists the characteristics of the best-fitting model parameters for the sample of sources analyzed in detail here.
The main results of this study are: 1) From the continuum SCUBA maps, 36 submillimetre sources ( 3) are detected. Some of them are extended, and many contain multiple condensations, as well as extended diffuse features. Twelve of these objects are reported here for the first time, 15 sources are analyzed, and nine Class 0 sources are studied in detail. 2) An average value of the aspect ratio of the sample of 1.3 0.1 is found, suggesting that the envelopes of Class 0 sources can be described approximately as spherically symmetric. Nevertheless, a departure of this symmetry in some cases is found. This mismatch could be produced by several factors like magnetic fields of energy densities sufficiently large to influence the object structure, the bipolar outflow, rapidly rotating structures, or high levels of angular momentum. 3) The sample consists of cool objects ( ranges of 27-50 K) which have of 4-85 L⊙. 4) The physical structure of a Class 0 envelope is characterized by the gas and dust temperature distribution () , and the density distribution () , with =0.4 and in the range of 1.5-2 (=2 at younger ages and =1.5 at later times). In the inner part of the envelope (10 AU), () departs from the single-power law index of 0.4, a phenomenon caused probably by thermal convection in the inner envelope. 5) From the thermal emission of the dust and following an emissivity model (Hildebrand 1983), the average value of the gas and dust mass of a sample based on 15 submillimetre selected objects is 2.5 0.6 M⊙. Examination of the radial profiles of the sample shows that the objects are surrounded by extended envelopes. Typically, the sizes are 1500-6000 AU (at 450 m) and 4000-9000 AU (at 850 m). 6) A sublimation radius of 3-5 AU at 450 m, =1 and =2 (10 AU for =1.5) is estimated, which is roughly the same as the radius of the photosphere (because the gas that is accreted close to the central object is optically thick, the central source should radiate from this specific radius, where the layer changes between the optically thick and the thin regime). 7) The blackbody curve and the data-points show significant deviations at the Infrared Astronomy Satellite (IRAS) 12 m and 25 m points for the Class 0 sample. If these data-points had correct flux measurements, the sources would exhibit an excess of mid-infrared emission which could be caused by ongoing outflow/dust interactions. Because it is likely that these IRAS points are incorrect in some cases, further mid-infrared observations of these objects are necessary to investigate the nature of this possible excess. 8) The assumption of spherical symmetry in the envelope model is reasonable. Nevertheless, deviations from this geometry determined by comparations between observed and modeled SEDs at short wavelengths, and between observed and simulated radial profiles of relatively spherical Class 0 sources become extremely prominent. This discrepancy could be due to the exclusion of a non-spherical geometry, of cavities produced by molecular outflows, or of a flattened disk in the model; it could also be due to specific assumptions considered here, e.g. a single point-like nature of the sources, and a constant dust opacity with radius in the model. 9) For the sample of Class 0 sources, the model-dependent ages are in a range of 1-3104 yr.
6 Conclusions
Detailed physical interpretation of the internal structure of nine observed Class 0 sources was carried out by intensive computer modelling. A simple spherically symmetric model envelope, and assumptions about density and dust distributions following the standard envelope model reproduced reasonably well the observed SEDs and the radial profiles of the sources. () is a good approximation for the sample. The radial temperature distribution as function of distance, however, departed significantly from the optically-thin assumption, an observational derivation of a single-power law of 0.4 for radii 10 AU. Modelling results indicated a density profile well described by a power-law between =1.5 and 2, which is expected by
| Object | [K] | [L⊙] | [AU] | [AU] | age [ 103 yr] | [M⊙] | ||
|---|---|---|---|---|---|---|---|---|
| \objectL 1448 NW | 27 | 6 | 5 | 2.0 | 4000 | 13.8 | 2.8 | 6.4 |
| \objectL 1448 C | 40 | 11 | 5 | 1.6 | 3000 | 19.5 | 1.7 | 2.6 |
| \objectRNO 15 FIR | 45 | 8 | 3 | 1.6 | 3500 | 20.7 | 1.0 | 1.8 |
| \objectNGC 1333 IRAS 1 | 52 | 13 | 3 | 1.5 | 4500 | 21.9 | 1.5 | 8.6 |
| \objectNGC 1333 IRAS 2 | 48 | 68 | 3 | 1.5 | 7000 | 26.1 | 3.0 | 0.1 |
| \objectHH 211-MM | 30 | 5 | 3 | 1.9 | 6000 | 13.8 | 4.1 | 4.5 |
| \objectL 1634 | 42 | 19 | 3 | 1.6 | 6000 | 21.9 | 2.8 | 1.1 |
| \objectL 1641 N | 45 | 85 | 3 | 1.5 | 8500 | 25.2 | 7.0 | 1.0 |
| L 1641 SMS III | 50 | 80 | 3 | 1.5 | 10000 | 27.6 | 6.3 | 0.6 |
all of the collapse models and numerical studies. A density structure of () at younger ages, evolving to () at later times was found.
SED and radial profile fits constrained physical parameters of the sources such as envelope masses, density distributions, sizes and sublimation radii. Nevertheless, mid-infrared observations, and the inclusion of outflow and disk, and other geometries in the model are desirable to investigate in order to decrease the differences between the model and the data, or prove that data and model are different under several configurations.
Acknowledgements.
MR thanks financial support from the Deutsche Forschungsgemeinschaft (DFG) grant number Ei 409/6-2 and the Graduierternförderung of the Friedrich-Schiller-Universität.References
- [1985] Adams, F. C.; Shu, F. H., 1985, ApJ 296, 655
- [\astronciteAdams1991] Adams, F., 1991, ApJ, 382, 544
- [1993] André, P.; Ward-Thompson, D.; Barsony, M., 1993, ApJ 406, 122
- [2000] André, P.; Ward-Thompson, D.; Barsony, M., 2000, in: Protostars and Planets IV (Book - Tucson: University of Arizona Press; eds. Mannings, V., Boss, A.P., Russell, S. S.), p. 59
- [1982] Anthony-Twarog, B., 1982, AJ 87, 1213
- [1986] Bachiller, R.; Cernicharo, J., 1986, A&A 166, 283
- [1998] Barsony, M.; Ward-Thompson, D.; André, P.; O’Linger, J.. 1998, ApJ 509, 733
- [1990] Beckwith, S. V. W.; Sargent, A. I.; Chini, R. S.; Guesten, R., 1990, AJ 99, 924
- [1993] Bohigas, J.; Persi, P.; Tapia, M., 1993, A&A 267, 168
- [1991] Butner, H. M.; Evans, N. J., II; Lester, D. F.; Levreault, R. M.; Strom, S. E., 1991, ApJ 376, 636
- [2000] Chandler, C., & Richer, J., 2000, ApJ 530, 851
- [2001] Chini, R.; Ward-Thompson, D.; Kirk, J. M.; Nielbock, M.; Reipurth, B.; Sievers, A. 2001, A&A 369, 155
- [1995] Davis, C. J.; Eislöffel, J., 1995, A&A 300, 851
- [1997] Davis, C. J.; Eislöffel, J.; Ray, T. P.; Jenness, T., 1997, A&AS 324, 1013
- [1984] Draine, B. T.; Lee, H. M., 1984, ApJ 285, 89
- [2003] Eislöffel, J.; Froebrich, D.; Stanke, T.; McCaughrean, M. J., 2003, ApJ 595, 259
- [1979] Emerson, D. T.; Klein, U.; Haslam, C. G. T., 1979, A&A 76, 92
- [2003] Froebrich, D.; Smith, M.D.; Hodapp K-D.; Eislöffel. J., 2003, MNRAS, 346, 163
- [1998] Hartmann, L., 1998, in: Accretion processes in star formation (Cambridge, UK ; New York : Cambridge University Press)
- [1983] Herbig, G., & Jones, B., 1983, AJ 88, 1040
- [1983] Hildebrand, R. H., 1983, QJRAS 24, 267
- [1990] Keene, J.; Masson, C. R., 1990, ApJ 355, 635
- [1993] Kenyon, S. J.; Calvet, N.; Hartmann, L., 1993, ApJ 414, 676
- [1969] Larson, R. B., 1969, MNRAS 145, 271
- [1980] Lin, D. N. C.; Papaloizou, J., 1980, MNRAS 191, 37
- [1983] Myers, P. C.; Benson, P. J., 1983, ApJ 266, 309
- [1993] Myers, P. C.; Ladd, E. F., 1993, ApJ 413L, 47
- [1998] Myers, P. C.; Adams, F. C.; Chen, H.; Schaff, E., 1998, ApJ 492, 703M
- [1969] Penston, M. V., 1969, MNRAS 144, 159
- [2004] Rengel, M., Froebrich, D., Wolf, S., Eislöffel, J, 2004, BaltA, 13, 449
- [2003b] Rengel, M., Hodapp, K., Eislöffel, J., Froebrich, D., Wolf, S., 2003, AN 324, Supp. Issue 3, 39
- [\astronciteRengel2004] Rengel, M., 2004, Ph.D. Thesis, Friedrich-Schiller-Universität Jena
- [\astronciteShirley et al.2002] Shirley, Y., Evans, N.J., Rawlings, J., 2002, ApJ, 575, 337
- [1977] Shu, F. H., 1977, ApJ 214, 488
- [\astronciteSmith2000] Smith, M.D., 2000, IAJ, 27, 1
- [2002] Smith, M.D., 2002, in The Origins of Stars and Planets: The VLT View, ed. João Alves und Mark McCaughrean
- [2000] Stanke, Th., 2000, Ph.D. Thesis, University of Postdam
- [2000] Stanke, Th.; McCaughrean, M. J.; Zinnecker, H., 2000, A&A 355, 639
- [\astronciteWolf et al.1999] Wolf, S., Henning, T., Stecklum, B., 1999, A&A, 349, 839
- [2003] Wolf, S., 2003, CoPhC 150, 99