Structural properties of discs and bulges of early-type galaxies
Abstract
We have used the EFAR sample of galaxies to investigate the light distributions of early-type galaxies. We decompose the 2D light distribution of the galaxies in a flattened spheroidal component with a Sérsic (1968) radial light profile and an inclined disc component with an exponential light profile. We show that if we assume that all galaxies can have a spheroid and disc component, that then the brightest, bulge dominated elliptical galaxies have a fairly broad distribution in the Sérsic profile shape parameter , with a median of about 3.7 and a sigma of 0.9. Other galaxies have smaller values. This means that spheroids are in general less concentrated than the de Vaucouleurs -law profile, which has =4.
While the result of our light decomposition is robust, we cannot prove without kinematic information that these components are spheroids and discs, in the usual sense of pressure- and rotation-supported stellar systems. However, we show that the distribution of disc inclination angles is consistent with random orientation if we take our selection effects into account. If we assume that the detected spheroids and discs are indeed separate components, we can draw the following conclusions: 1) the spheroid and disc scale sizes are correlated; 2) bulge-to-total luminosity ratios, bulge effective radii, and bulge values are all positively correlated; 3) the bivariate space density distribution of elliptical galaxies in the (luminosity, scale size)-plane is well described by a Schechter luminosity function in the luminosity dimension and a log-normal scale-size distribution at a given luminosity; 4) at the brightest luminosities, the scale size distribution of elliptical galaxies is similar to those of bright spiral galaxies, but extending to brighter magnitudes; at fainter luminosities the scale size distribution of elliptical galaxies peaks at distinctly smaller sizes than the size distribution of spiral galaxies; and 5) bulge components of early-type galaxies are typically a factor 1.5 to 2.5 smaller than the disks of spiral galaxies with a slight luminosity dependence, while disc components of early-type galaxies are typically twice as large as the discs of spiral galaxies at all luminosities.
keywords:
galaxies: elliptical and lenticular, cD – galaxies: fundamental parameters – galaxies: statistics – galaxies: structure1 Introduction
Studying the light distribution of galaxies in order to determine and compare their structural properties has a long tradition (e.g., de Vaucouleurs 1948; Fish 1964; Freeman 1970). Traditionally, the light distributions of elliptical galaxies have been fitted by the -law profile of de Vaucouleurs (1948), while spiral galaxies have been fitted with exponential light profiles for their discs and often, due to their similarities to early-type galaxies, -law bulges (e.g., de Vaucouleurs 1959; Kormendy 1977). In the recent decade we have seen some shift from this paradigm. A generalization of the and exponential light profile laws described first by (Sérsic, 1968), resulting in an law, has more often been fitted to early-type galaxies to account for observed deviations from the profiles (e.g., Caon, Capaccioli, & D’Onofrio 1993; Graham & Colless 1997). Based on this development and based on theoretical predictions for some forms of bulge formation (e.g., Combes et al. 1990; Pfenniger & Norman 1990), more general forms of light profiles have been fitted to the bulge light of spiral galaxies as well (Andredakis, Peletier, & Balcells, 1995; de Jong, 1996a; MacArthur, Courteau, & Holtzman, 2003). With the realization that many early-type galaxies have disc-like components (e.g., Bender et al. 1989; Rix & White 1990; Jørgensen & Franx 1994), bulge/disc decompositions of elliptical galaxies have been performed, but in general with bulges and exponential discs (e.g., Saglia et al. 1997b) except for a few notable exceptions on small samples of galaxies (D’Onofrio, 2001; Balcells, Graham & Peletier, 2004; Gutiérrez et al., 2004). Here we perform 2D bulge/disc decompositions on the large EFAR sample of early-type galaxies (Wegner et al. 1996, hereafter Paper I) using an spheroid and exponential disc light profiles, determine relations between their structural parameters and their frequency of occurrence, and compare those to the properties of disc dominated galaxies.
In an earlier paper in this series (Saglia et al. 1997a, Paper III hereafter) we presented the luminosity profiles for the 776 galaxies observed in the EFAR project to which we fitted seeing convolved -law bulge plus exponential disc models. In Paper III, 31% of the sample proved to be spiral or barred spiral galaxies and 69% of the sample were classified as early-type galaxies. Of those early-types 18% were well fit by an alone, the great majority (70%) were very much better fit by the combination of an exponential disc plus bulge than by a bulge alone. The remaining 12% of the early-type galaxies were classified as cD, without reference to their profile type, as they were the brightest in their cluster and had half-total-light radii larger than 10 kpc.
In Saglia et al. (1997b, hereafter Paper IV) we showed that the combination of an -law spheroid plus an exponential disc is degenerate to an -law spheroid, unless one has data for a very large range in surface brightness and radius. Given that only 12% of the EFAR galaxies were best fitted with an law alone, and that the remainder of the galaxies were better fitted with an bulge and an exponential disc, one might wonder about the validity of the law in general. To address this issue, we have refitted all EFAR galaxies again with an -law spheroid and an exponential disc. If early-type galaxies are dominated by spheroids, most fits should converge to largely spheroid dominated systems with small discs. If the -law spheroids plus disc picture is correct, most fits should converge towards spheroids with Sérsic parameter close to 4. Obviously, the truth could be somewhere in between with spheroids with Sérsic parameter covering a large range and with a large range in bulge-to-disc ratios.
We have to realize that even when we find that most early-type systems have light components that are well described by exponential light profiles, this in itself will never prove the existence of exponential discs. First of all, there is no reason why the exponential discs observed in most spiral galaxies should be present in a similar way in bulge dominated systems, especially realizing that exponential discs in spiral galaxies are still poorly understood. Secondly, even if light is present in exponential distribution, it might not be in a disc configuration flattened by rotation as discs of spiral galaxies are normally understood. One can probably make many stable configurations in bulge-like potentials that have small exponential like stellar distributions on top of them, without the need of any net rotation. The best confirmation of exponential light distributions in early type galaxies being rotationally flattened discs as in spiral galaxies has to come from measurements of their kinematics.
Even when kinematics is available, it still might be difficult to reach an unambiguous result. Scorza & Bender (1995) made dynamical models for a small sample of early-type galaxies based on their photometric bulge/disc decompositions and showed that the observed asymmetries in the long-slit stellar absorption line profiles were consistent with the dynamical model predictions. However, with their data and modelling technique they could not prove this was an unique kinematic interpretation. Better kinematic constraints on discy components can be obtained with full 2D velocity profile measurements, such as obtained with the SAURON project (Falcón-Barroso et al., 2004; Emsellem et al., 2004). However, so far these studies have been limited to the high surface brightness central regions of galaxies.
In recent years a number of studies were performed where the galaxy samples were large enough and the selection bias understood well enough that bivariate space density distributions of structural parameters could be calculated. Cross et al. (2001) presented the bivariate (luminosity, surface brightness distribution) for the 2dFGRS (Colless et al., 2001b). Blanton et al. (2003) showed many different bivariate space density distributions derived from the Sloan Digital Sky Survey (SDSS; York et al. 2000), and presented some distributions in bins of colour and concentration index to split their sample in different galaxy types. Kauffmann et al. (2003) derived mass-to-light ratios for the SDSS galaxies and presented stellar mass bivariate distributions. Shen et al. (2003) also investigated the bivariate distribution of structural parameters of different subsets of SDSS galaxies. However, even though calculated, they did not include the absolute space densities in their analysis. While based on large sample to provide good statistics, in none of these studies bulge/disc decompositions were performed to derive space density distributions for the individual components. Such an analysis was performed on the discs of a sample of about 1000 Sb-Sdm galaxies by de Jong & Lacey (2000). However, no such analysis on early-type galaxies has appeared so far.
A fundamental question for galaxy formation is the origin of the Hubble sequence. Why do some galaxies have discs and others not? If in fact almost all galaxies have a disc component but of varying mass, luminosity, and size, the question of the origin of the Hubble sequence takes on a different perspective; in semi-analytic models of galaxy formation early-type galaxies go through phases where they have substantial discs which are disrupted and re-built during the cycle of hierarchical merging. Determining galaxy disc and bulge parameters and their bivariate distributions will help us to test and constrain such hierarchical semi-analytic models of galaxy formation.
In this paper we will use a 2D fitting algorithm to measure the bulge and disc properties in the EFAR sample of early-type galaxies. We estimate the frequency, luminosity and size of discs and bulges and explore the properties of the discs in the context of S0 and spiral galaxy discs.
In the next section we describe our method of 2D model fitting and parameter error estimation and compare our new results with the results of Paper III. In section 3 we characterize the properties of the discs and their relation to the host bulge component. Our conclusions and the implications of this work for models of galaxy evolution are summarized in section 4. We use a cosmology of =0.3, =0.7, and =70 km s-1 Mpc-1 throughout.
2 GIM2D: 2D Galaxy Modelling
We decided to use full 2D modelling of the galaxy images, as this provides extra bulge/disc separation constraints due to the different flattening of bulges and discs, sometimes combined with the constraints resulting from the different position angles of the two components. Performing the modelling in 2D also allows proper weighting of data points reflecting uncertainties due to photon statistics, flat fielding uncertainties, sky level uncertainties and model imperfections (i.e. real galaxies are not as smooth as our models).
To extract the best possible bulge and disc parameters and to estimate their errors we performed the following steps:
Many of the EFAR galaxies have several repeat observations, so for the 775 objects more than 2500 images are available. We only used the -band images, because the -band imaging of the EFAR sample is incomplete. We determined the seeing on all EFAR images by finding isolated star-like objects in each of them, then measure the FWHM of each object by fitting a Gaussian profile, and taking the error weighted average of the eight objects in each image with the smallest errors after removing the objects with smallest and largest FWHM. At this stage we selected for each galaxy the image with the best seeing. All galaxies with too few good foreground stars () to make a reliable seeing measurement were removed from the sample (23 galaxies).
SExtractor (Bertin & Arnouts, 1996) was used to create a mask of all objects on the images, splitting the images of overlapping objects in separate components. This mask is used by the fitting routine to exclude all pixels with objects detected except for the pixels with the galaxy of interest and the sky pixels. A very low level SExtractor mask was also used to determine the sky level of the image, using a kappa-sigma clipped median of the pixels deemed free of objects, and this sky level was kept fixed during the fitting of the galaxy.
The 2D modelling of the galaxy images was performed by the publicly available GIM2D fitting package (Version 2.2.1), described in detail in Simard et al. (2002). The spheroidal component of each galaxy was fitted with a Sérsic law:
| (1) |
where the effective radius () encloses half the total luminosity and is the surface brightness at this radius. The parameter is set to 1.9992-0.3271 so that remains the half total light radius of the bulge. Better approximations of were published after we did our calculations (e.g., MacArthur, Courteau, & Holtzman 2003), but these improvements are only relevant for values much less than 1, which are rare in our sample. The bulge component was allowed a flattening with ellipticity , with , semi-major and minor axis. The provided by GIM2D is the bulge half-total-light radius of the major axis, which we multiplied by to be consistent with our previous work, which uses the effective radius on a circular aperture.
The disc was modelled with an exponential disc:
| (2) |
which was assumed to be infinitely thin, transparent and have an inclination . The two galaxy components had a common center which was fitted as well, and an independent flux, here expressed in a bulge-to-total light ratio (). Each component has also an independent position angle. The summed galaxy components were convolved with a Gaussian with a FWHM equal to the determined seeing, using an FFT algorithm. GIM2D fits this large 11-dimensional parameter space of the two components with the Metropolis algorithm (Metropolis et al., 1953). The Metropolis algorithm is very CPU intensive, but it tends to be more robust than methods based on gradient searches. The Metropolis algorithm is ideal for cases as the current where many fits have to be performed unsupervised. The CPU intensiveness was solved by using 16 fast Linux Dual Processor PCs in a cluster.
The fitted scale size parameters in pixels and intensities in counts were converted to arc-seconds and magnitudes using calibrations described in Paper III. To set the nomenclature, the galaxies are parametrized in the remainder of the paper as follows: for the total galaxy we have luminosity , effective (half-total-light) radius and effective surface brightness within this radius ; for the bulge luminosity , effective radius and effective surface brightness ; for the disc luminosity , scale length and central surface brightness .
After all galaxies had been fitted, galaxies with high residuals and/or suspicious model subtracted residual images were identified. In many of these cases SExtractor had not detected objects near the nucleus of the target galaxy or done an insufficient splitting of nearby objects, resulting in incorrect masks and causing poor fits. For most of these objects we were able to modify the masks by hand to give satisfactory result, but a number of objects with bright foreground stars, many bright companions or the occasional galaxies with double nuclei were removed from the sample at this stage (20 galaxies).
We used the model subtracted residual images to identify galaxies with spiral structure. Even though not necessarily spiral galaxies based on their ratio, these galaxies are marked with special symbols in the diagrams. We will use the term “non-spiral galaxies” in the remainder of this paper for those galaxies that had no clear spiral structure in the residual images (454 of the 558 galaxies used in the final selection). The brightest galaxy of each of the clusters with at least 3 members as identified in Paper VII of this series (Colless et al., 2001a) is also marked with a special symbol in the diagrams.
The GIM2D fit package provides 68% confidence limits on the fitted parameters, based on the topology of the parameter space that is build up during the fit process. These errors take only the uncertainties in the fitted parameters into account, not uncertainties in fixed parameters like sky level and seeing. As errors in these parameters are often the main error in the determined bulge and disc parameters (de Jong, 1996a), we repeated all fits with the maximum error expected in our determination of sky and seeing values.
We estimated the typical error in our sky estimates by dividing the image in 4 and measuring the sky in each of the quadrants separately using the same procedure as for the total image (using object masking and kappa-sigma clipping). The RMS in the 4 sky averages provides an estimate in the sky level uncertainty on a galaxy size scale. This is probably a slight overestimate, as most galaxies are near the center of the frame, so near the average sky of the total frame, while the sky RMS of the quadrants will be more affected by sky level gradients across the frame. Most images used have small sky level uncertainties: 80% of the galaxies have quadrants errors less than 0.5%, only 8% of the galaxies have quadrant RMS values larger than 1% of the sky, mainly due to sky gradients. We repeated all GIM2D fits with 1% sky added and subtracted, and the resulting fit parameters should be seen as the maximum errors in the parameters that can be expected to be caused by sky uncertainty.
For each galaxy we repeated the fit with seeing increased and decreased by 2% to determine the errors in the fitted parameters due to seeing measurement uncertainties. Judging from the RMS in the seeing measurements of different stars in the different frames, less than 20% of the galaxies have uncertainties in their seeing larger than 2%. Again, these errors should be seen as the maximum error in the fitted parameters due to seeing measurement uncertainties.
Where appropriate, we show typical errorbars on our graphs, which are the median errors for all galaxies in the determined parameters, where the parameter error for an individual galaxy is the maximum error due to fit parameter space, sky uncertainty, or seeing uncertainty. We chose the maximum error here, because it is hard to assign relative weights to the different error sources. To assign proper weights would require a full set of Monte Carlo simulations, which is prohibited given the large computation times involved.
We excluded all galaxies with no measured redshift from our analysis, mainly spiral galaxies which were excluded from the spectroscopy phase of the EFAR project as being not interesting for the main aim of the project. The final sample of galaxies used contains 558 galaxies.
2.1 Testing the 2D fit routine
We tested the GIM2D fitting program by performing fits on 500 artificial galaxy images with characteristics similar to our real data. The images were 500x500 pixels and the pixel size was 0.65 arcsec. Skylevel was set at 20.5 mag arcsec-2. Galaxy images were created in a Monte Carlo fashion with total magnitudes sampled linearly between 12 and 16 mag, with ratios sampled linearly between 0.05 and 1, and having bulges with and , and discs with . CCD readnoise and gain were set comparable to most of our observations and Poison noise was added appropriate for the detected flux level. The galaxies were convolved with a Gaussian seeing with FWHM of 1.8 arcsec, which is at the high end of the typical seeing of the used images (90% with seeing less than 1.8 arcsec).

A comparison of the fitted GIM2D parameters with the input parameters is presented in the first five columns of Fig. 1. All parameters are reasonably well reproduced, but some systematic trends can be seen. As could be expected, the largest errors in the bulge parameters (, ) occur at small values, while the largest disc errors can be found at large values and small values.
Obviously, for real galaxies we do not know the “input” parameter values, but examining the errors in the fitted parameters as function of the fitted output parameters, shows parameter ranges we should not trust. We therefore exclude here from the artificial data and later from the real data all fitted values for galaxies with 0.2 or 1.0 FWHM seeing. Likewise, we exclude all fitted values for fits where 0.95 or 1.5 FWHM seeing. Applying these cuts results in RMS errors between input and fitted parameters of order 5% in , 10% in , 30% in , 20% in , and 15% in .
It should be noted that some of the errors are strongly correlated, as shown in the last two columns of Fig. 1. Especially the bulge parameters and are strongly correlated, with some weaker correlations between these bulge parameters and and .
The values show a systematic trend with the input in Fig. 1. This is for a considerable fraction the result of the limits imposed on the fitted values, which were constrained to . This means that artificial galaxies with values close to 1 will have fitted values preferentially scattered to larger fit values, and likewise for galaxies with input values close to 6.5. A similar effect can be seen in the versus plot. To minimize this effect on real galaxies we increased the limits to .
At small values a relatively large number of galaxies show “catastrophic” errors. These are cases of mistaken identity; the bulge and disc shapes are so similar that they are swapped. Without prior assumptions about relative scale sizes or surface brightnesses this is unavoidable.
2.2 Comparing profile fitting and 2D fitting
In Paper III we derived bulge and disc parameters of the EFAR galaxies using 1D luminosity profiles. Circularly averaged luminosity profiles were fitted by the combination of an and an exponential luminosity light distribution, convolved with seeing, which was also fitted. Multiple exposures of the same object were optimally combined and an optional sky-fitting procedure was used when necessary to correct for sky subtraction errors.
We will now compare the Paper III 1D parameters with the current GIM2D parameters to study the differences between 1D and 2D fitting and and -law bulges. We removed the fit quality =3 fits from the Paper III results, as those were considered of poor quality.
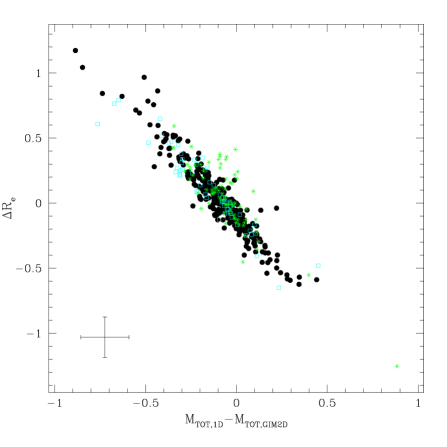
Figure 2 shows the difference in integrated magnitude versus the effective radius difference (defined as ) when comparing the 1D and the GIM2D results. The GIM2D magnitudes are 0.06 mag fainter in the median and agree to within 0.17 mag RMS. The effective radii agree to within 28% RMS, without taking the strong correlation into account. The correlated differences are for a considerable fraction due to the change in bulge parameter shape allowed by the law. Even though the flux in the inner region of the galaxies is well determined, the total flux (and hence half light effective radius) is determined by extrapolating the model to infinity. This is demonstrated more clearly in the next figure.
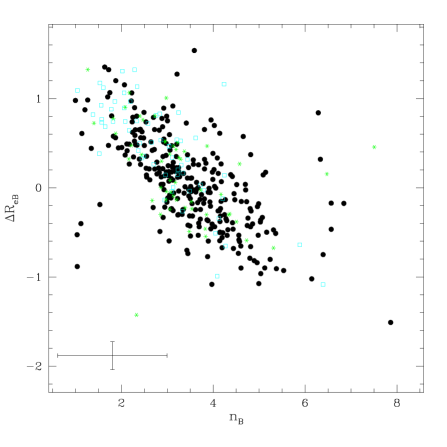
Figure 3 shows the old versus new bulge effective radius difference as function of Sérsic bulge shape parameter . When the 2D fitted is getting smaller than the value, light is extending less far and is getting smaller in the law case than in the law case. The opposite happens when . Taking this effect into account, the bulge parameters of the galaxies agree to within 50% RMS of each other, a larger error than for the total galaxy parameters as might be expected.
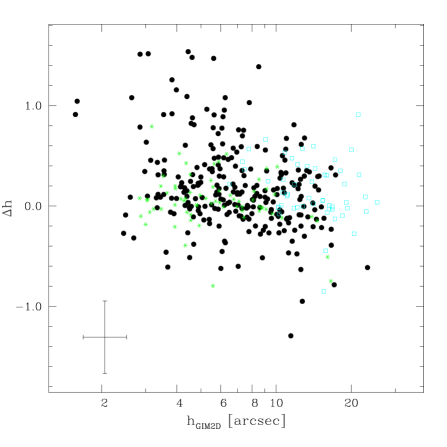
Figure 4 compares the old and new disc scale lengths. Some of the extreme outliers are due to the swapping of interpretation of which component is disc and which is bulge. What used to be a small disc in a large -law bulge has become a small -law bulge with in general low and sometimes vice versa. The disc scale lengths agree with each other to almost 35% RMS, which suggests that many early-type galaxies seem to have a light component that is robustly fitted by an exponential light profile, to some extent independent of the shape of the spheroid component. This does not prove that these are real discs: other radial disc light profiles may be more appropriate (see e.g. Scorza & Bender 1995) and kinematics is required to confirm a disc configuration for an individual galaxy.
In this section we showed that while the 1D and the 2D fit result in systematically different structural parameters, these deviations are correlated with the Sérsic shape parameter. In determining uncertainties in the parameters we have to take these systematic chances into account. Therefore, under the assumption that the combination of an law spheroid and exponential disc is a reasonable good description of the intrinsic light distribution of a galaxy and by giving some more weight to the artificial images test of Section 2.1, we conclude that bulge and disc parameters can be determined with a typical 1 sigma accuracy of about 30%. However, one should keep in mind that some extreme outliers with much larger errors will be common in large samples. In the remainder of the paper we will use the GIM2D determined parameters to investigate correlations between bulge and disc parameters and the space density of early-type galaxies as function of these parameters. The fitted GIM2D parameters are available in electronic format from the Centre de Donnés astronomiques de Strasbourg (CDS) web site.
3 Properties of Discs and Bulges
3.1 Sample selection and selection effects
The selection of the EFAR galaxy sample has been described in detail in Wegner et al. (1996), and we will repeat here the most important aspects relevant for the current study. All galaxies were selected with the intention to be cluster members, with the clusters lying in two selected regions in the sky which are rich in galaxy clusters. The target clusters had redshifts in the range from 6000 to 15000 km s-1. Photographic enlargements of POSS and SERC Sky Survey plates of the target clusters were inspected for galaxies with elliptical/S0 galaxy like morphology and a minimum diameter of about 16 arcsec. Morphological selection was done to err on the safe side, including many spiral galaxies which were identified as such later with subsequent CCD imaging. The sample is therefore intended to be complete in large, early-type galaxies (elliptical/S0), but is not complete in any other galaxy type. In most of the analysis presented here, we will only use the galaxies from the EFAR target clusters, excluding the galaxies from the comparison sample in Coma, Virgo and the field, as they suffer from completely different selection effects.
To maximize the number of early-type galaxies, galaxies were selected with rather round isophotes and the sample is therefore rather face-on. The sample has only eight galaxies with ellipticity at the outer isophotes. The distribution of intrinsic shapes of early-type galaxies is poorly known, and we have therefore not attempted to correct the bulge parameters to face-on values using the bulge isophote shapes. However, the disc parameters shown in the diagrams are face-on values, assuming fully transparent discs.
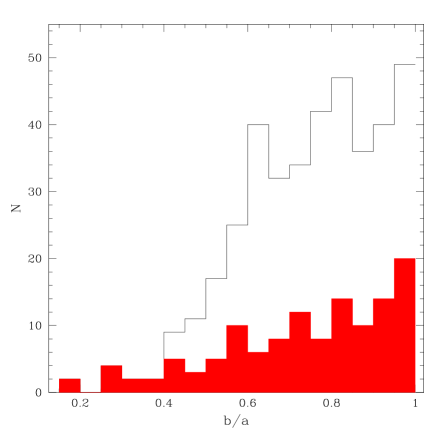
While we can not prove that our fitted disc light distributions are really discs, we can use the minor over major axis ratio (/) distribution to make a statistical test. For a sample of infinitely thin discs at random viewing angle the distribution of / is expected to flat. We show this distribution for all non-spiral galaxies in Fig. 5 (line). The distribution is rather flat for , but steeply declines for smaller values of /. This is the result of our selection bias, with very few galaxies having 0.4 (i.e. 0.6). Assuming that discs are in general aligned with the spheroid they are sitting in, we expect the / distribution to be peaked toward face-on. This effect will be less for small discs in large bulges and indeed the distribution becomes relatively more spread out when looking at all non-spiral galaxies with 0.7 in Fig. 5 (solid histogram). While not conclusive, this test shows that our fitted disc components have orientation angles consistent with the random distribution expected.
To fully quantify the selection limits of the sample as function of the structural parameters of the galaxies, we need not only to know the angular diameter limits, but also the surface brightness at selection diameter. The average surface brightness at the selection diameter was 22.05 -mag arcsec-2, with a RMS of 0.5 -mag arcsec-2, as derived from the 1D profiles of Paper III. This value is used, in combination with the typical log()1.2 diameter limit (Paper I, see also Eq. 3) and the minimum 6000 km s-1 distance limit, to calculate the selection limits indicated in our diagrams where possible.
3.2 Galactic extinction and cosmological corrections
The observed parameters were corrected for Galactic extinction according to the precepts of Burstein (2003), which averages the estimates of Schlegel, Finkbeiner, & Davis (1998) and Burstein & Heiles (1982) with appropriate offsets. No attempt was made to correct the parameters for internal extinction. We used the cluster redshifts as listed in Paper VII to calculate distances to individual galaxies. Cosmological corrections were made using =0.3, =0.7, and =70 km s-1 Mpc-1, and K-corrections were made as described in Paper III. All these corrections are typically small for these galaxies and making different reasonable assumptions will not affect our results at all.
3.3 Structural parameter correlations
We will now investigate correlations in structural parameters of bulge and disc. Obviously, many combinations of bulge and disc parameters can be made, and we will show here only those deemed most interesting.
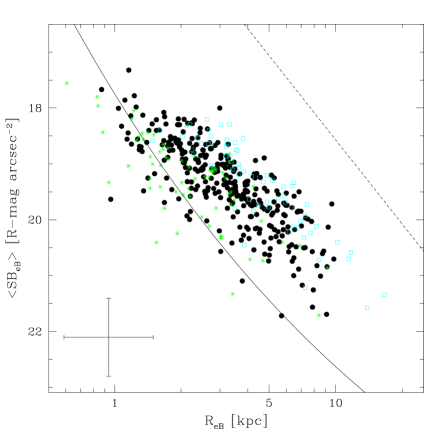
In Fig. 6 we show bulge effective radius versus bulge effective surface brightness for our sample. There seems to be a reasonable tight correlation between these two parameters for the non-spiral galaxies, but we have to be wary of selection effects. The solid line in this diagram shows the selection cutoff for galaxies with an profile dominating at the selection radius, calculated using the average surface brightness at the selection radius. The rather sharp cutoff in the high surface brightness, long scale size region of the diagram is therefore real; there are no selection effects acting in this part of the diagram. This upper limit is related to the zone of exclusion in -space discussed in detail by Burstein et al. (1997).
At the low surface brightness end of the diagram we have to be more careful: most of the galaxy distribution seems to lie clearly separated to the right of the selection limit line, but the selection line is for a 6000 km s-1 cluster, and moving to the right for the higher redshift clusters. The “visibility volume” (Disney & Phillipps, 1983) for these lower surface brightness galaxies is definitely much smaller than for high surface brightness galaxies, certainly taking further into account the measurement uncertainty in the selection diameter (Paper I). We will make full “visibility volume” corrections in Section 3.4, to calculate the volume density of early-type galaxies as function of structural parameters.
There are quite a number of galaxies, whose bulges do not follow the main trend seen for the most non-spiral galaxies in Fig. 6. These bulges lie often to the left of the selection line, and these galaxies are included in the sample because their discs make a significant contribution at the selection diameter or because their profile does not follow an law. Many of these bulges, especially in some of the spiral galaxies, may have the more exponential-like bulges typical of late-type spiral galaxies (Andredakis, Peletier, & Balcells, 1995; Courteau, de Jong, & Broeils, 1996; Graham, 2001) instead of the more like bulges found in early-type galaxies.
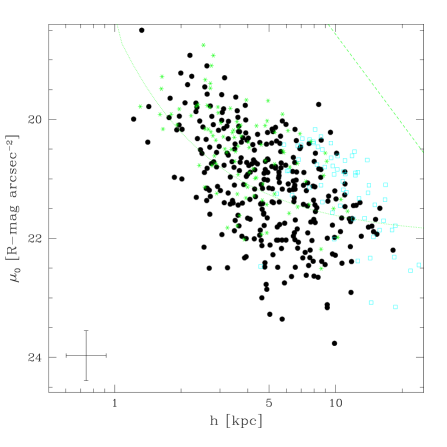
In Fig. 7 we show the disc scale length versus disc central surface brightness for all fitted galaxies. The dotted line shows the km s-1 selection limit for galaxies which have an exponential light distribution dominating at the selection radius (i.e. spiral galaxies). Elliptical galaxies will not adhere to this selection limit, as they were selected on basis of their light distribution. Some interesting trends can be seen in this diagram, but we have to be wary of more hidden selection effects. At the very short scale lengths we are close to our scale length cutoff, as 1 kpc is of order 2.5 arcsec for km s-1 and even less for higher redshifts. The observed limit at the low surface brightness, small scale length end is more subtle and probably arises from the minimum contrast needed to see a low surface brightness disc on top of a bright bulge distribution. Using the relation between and shown in Fig. 8 discussed in the next paragraph and the relation between and shown in Fig. 6, we find that we probe discs with central surface brightnesses at most about 2 magnitudes fainter than the of the bulge. It is not unreasonable to suspect that the low surface brightness cutoff is caused by lack of disc/bulge contrast. The only cutoff observed in this diagram that is definitely real is at large scale length, high surface brightness, as no selection effects operate in this part of the diagram. This cutoff is similar to the one observed for spiral galaxies (de Jong, 1996b).
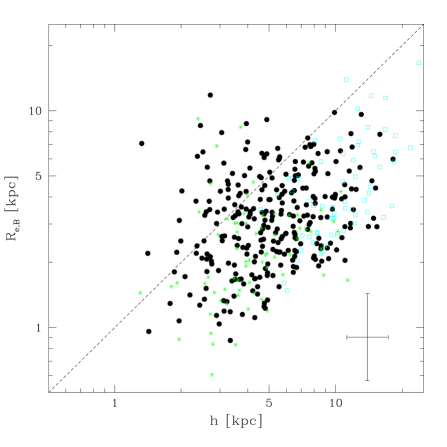
In Fig. 8 we show the correlation between bulge and disc scale sizes. No obvious selection effects operate in this diagram, except for a spiral galaxy having a large disc scale length and a small bulge would probably not have entered the sample. This is not the case for elliptical galaxies and therefore we have to make sure that other effects are not causing this correlation, before we can accept it as real. Our Monte-Carlo simulations showed that our GIM2D fitting routine is capable to recover models of the full parameter space presented here, so it is unlikely that it is the result of a fitting routine artifact. Indeed, we do see a small number of galaxies with in Fig. 8, and so the routine is capable of covering this parameter space in real data. Still, given the limits on the parameter space for a given galaxy (not larger than image size, not smaller than seeing), it is not completely surprising that the bulge and disc scale parameters are similar in size.
The galaxies can be divided in three groups. A number of these galaxies are clearly disturbed by dust-lanes or are poorly fitted due to nearby bright galaxies or stars. We may have a number of cases of mistaken identity, where bulge and disc are swapped. This is especially the case when is low and the bulge has an almost exponential light profile. Swapping the bulge and disc parameters on these galaxies would bring them in line with the general trend. Finally there are a very few galaxies which seem to have a genuine small inner light component for their given bulge size, but these should not be mistaken for the nuclear discs found in HST images of early-type galaxies, as these are a factor 5–20 smaller yet again (Scorza & van den Bosch, 1998). In a number of cases they might be identified with the inner break radius observed in HST images of early-type galaxies (Faber et al., 1997; Trujillo et al., 2004), as shown by D’Onofrio (2001).
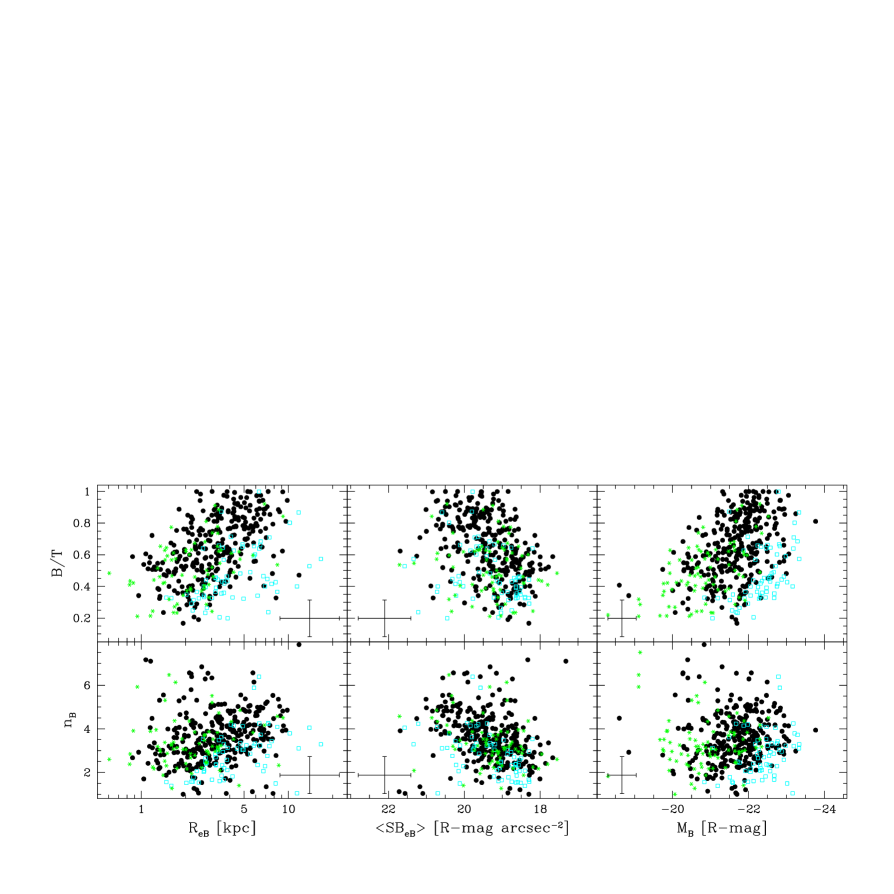
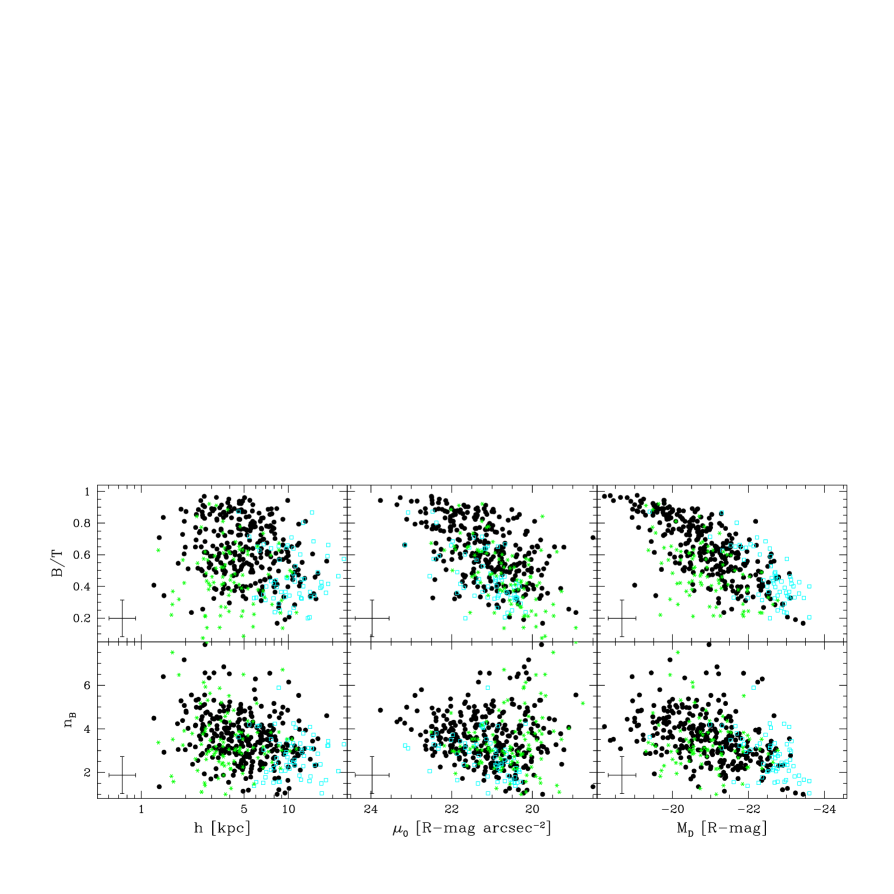
In Fig. 9 we show in three sets of diagrams the bulge, disc, and combined bulge and disc parameters as function of ratio and Sérsic values. Before we can draw any conclusions on any apparent correlation, we have to be aware of the many selection effects playing in these diagrams. Some are explicit, like the limits we placed on some parameters based on ratio to reduce fit errors. Others are more hidden, like the exclusion of bright discs, as their more visible spiral structure would have precluded them from entering the sample in the first place.
Concentrating first on the ratios, we see that more bulge dominated systems have larger bulge scale sizes, but lower effective surface intensities, which combines in a rather weak ratio trend with total bulge luminosity. On the other hand, looking at the disc parameters in the middle set of diagrams, we see a weak trend of disc scale sizes with ratio, but at each ratio there is a wide range in disc scale sizes. More bulge dominated systems have discs of lower surface intensities. The combined trends of disc scale size and surface brightness result in a strong correlation between disc luminosity and ratio for our sample dominated by bright, early-type galaxies.
Combining these results for this sample, the change in ratio seems to be mainly driven by changes in disc luminosity, not bulge luminosity. This is opposite to what has been observed for disc dominated systems as found by e.g. Trujillo et al. (2002) and Balcells, Graham & Peletier (2004), who showed that most of the change in ratio in these systems is due to bulge luminosity variation. We have to be cautious though. Our selection criteria resulted in a very limited range in total galaxy luminosities. We are only sampling the upper decade in the luminosity function, the 5–10 brightest galaxies in a cluster. It could be that lower luminosity elliptical galaxies reveal often equal sized discs, changing the observed trends.
Finally, we see that the weak opposite trends in the bulge and disc scale sizes with ratio combine in a strong correlation between / and . We should be cautious not to see too much in this relationship. The expected relation between and under the assumption that there is a fixed bulge to disc surface brightness difference and no significant bulge profile shape change is indicated by the dashed line. The bulk of the galaxies have indeed a limited range in disc to bulge surface brightness difference as shown in Fig. 9. It is just hard to see a faint component on top of a bright component, unless their light distributions are completely different. The variation from to amounts to only a factor 2 in bulge luminosity change at fixed bulge to disc surface brightness ratio (see Graham 2001, his fig. 4) and this change is systematic with / as shown in Fig. 9. All in all, the relation between and / with the observed scatter is expected, given the observed scatter in disc to bulge surface brightness contrast and the limited and systematic effect in .
We note that D’Onofrio (2001) finds a different slope in the versus / relation. Many of his discs were fitted to the small inner components (either discs or cores) of the galaxies in his nearby sample. We are not able to resolve these components and, as D’Onofrio rightly indicates, it is unlikely that these inner components represent similar structures as the more extended components fitted in discy galaxies. We do fit the more extended components and indeed find a they have different relation to the main galaxy.
If we now turn our attention to the relationships between and the bulge and disc parameters, we note that has a behavior very similar to the ratio with respect to these bulge and disc parameters. There are some more outliers in the relations, most of which are for values larger than 5.5.
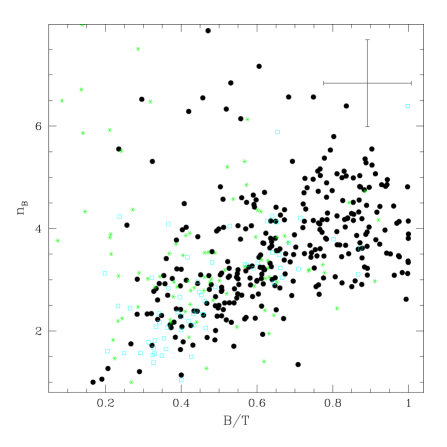
The very similar behavior of and ratio in Fig. 9 suggests that these two parameters must be correlated, which is indeed the case as shown in Fig. 10. As mentioned before, all other things being equal a change in from 1 to 5 only results only in a factor 2 change in bulge to disc luminosity, so the change in does not drive the variation in ratio on its own. For this set of early-type galaxies, a large fraction of the change seems to come from the change in bulge effective radius, and it is the correlation between and that seems to drive the trend between and ratio. Still, cause and effect are hard to disentangle based on this photometric data set alone. We note that these trends cannot solely be the result of the correlated errors noted in Fig. 1, as the slope of the errors is incorrect and the size of the effect is too small.
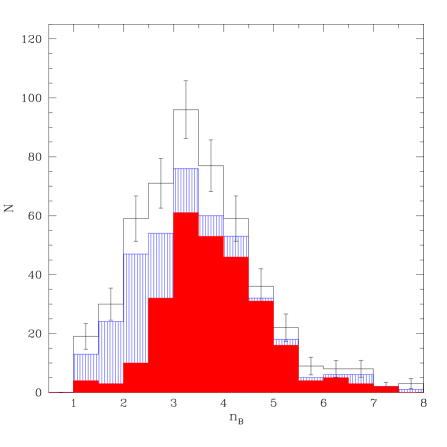
In Fig. 11 we show the observed distributions of the parameter for different subsets of our sample. Galaxies that were fitted with values larger than 6 were outliers in previous diagrams and are considered of dubious quality. They are excluded from further analysis here. The distributions are quite narrowly peaked, with 1 sigma dispersions ranging from about 1.05 for the total sample to 0.88 for bulge dominated non-spiral galaxies. This width is about twice the mean of the individual maximal error estimates of the values, and is therefore significant. The median value shifts from 3.24 for the total sample, to 3.31 for the non-spiral sample, and to 3.66 for the non-spiral, bulge dominated sample. For galaxies with the median is 3.99. The real values might be even somewhat lower. Balcells et al. (2003) showed that for a sample of early type disc galaxies the values decreased compared to ground based data when a nuclear component revealed in their HST data was included as a seperate component in their fits.
This result complicates bulge-disc decompositions of higher redshift galaxies with typically lower signal-to-noise and resolution. On such lower quality data a Sérsic-law bulge with exponential disc does not reliably converge and one is force to use a fixed value. Given that in this morphologically preselected and bright galaxy sample there is a broad distribution of independent of luminosity (see Fig. 9) peaking at values below =4, and given that spiral galaxies tend to have bulges with values in the 0.5–3 range (e.g., MacArthur, Courteau, & Holtzman 2003; Balcells et al. 2003), it may be more appropriate to use a in the 1.5–3 range rather than the more customary =4 in fixed fits. A similar conclusion was reached for early-type disc galaxies by Balcells et al. (2003), but is now extended to bright, early-type cluster galaxies here.
3.4 Space density distribution functions
Probably more important than correlations between structural parameters is the true space density of galaxies as function of structural parameters, i.e. the distribution of structural parameters corrected for selection effects.
When calculating space densities of galaxies from the EFAR sample there are several points to note. The sample is not complete for spiral galaxies, so we can not say anything about space densities of those galaxies. The regions selected by EFAR where particularly rich in clusters, and therefore are not representative for the average space density of galaxies in the local universe. Assuming that galaxies have similar properties in different clusters, we can still use the relative space density of structural parameters, but for absolute space densities we will have to re-normalize the EFAR regions to the universal cluster density.
Calculating the space density of galaxies requires good understanding of the selection function. The selection of the EFAR sample is described in detail in Paper I. The selection of EFAR galaxies was a two step process, where first clusters were selected, believed to be in the right redshift range and to be rich enough to obtain accurate distances. In the next step galaxies were selected in each cluster according to a minimum angular diameter criterion.
We will use here a simple correction method (Schmidt, 1968) to calculate the relative space density of E/S0 galaxies as function of their structural parameters. The correction method assumes that the average space density of an object with certain parameters is inversely proportional to the maximum “visibility” volume of that object, given the selection criteria of the sample (for more detailed descriptions see Felten 1976; Disney & Phillipps 1983; de Jong & Lacey 2000). The selection of galaxies was a two step process and therefore calculating the maximum visibility volume of a galaxy must reproduce this two step process.
First, the of each individual galaxy was calculated, by integrating the total volume occupied between the minimum and maximum selection redshifts of =6000/ and =15000/, with the speed of light. While doing the volume integral, we have to take into account the diameter selection function determined in Paper I for each cluster as applied to each galaxy individually. The selection function describes the selection diameter () dependent probability of sample inclusion, parametrized by:
| (3) |
where is the midpoint and the width of the cutoff in the selection function. We furthermore took into account that the contribution to the volume has to drop to zero when becomes less than 1.5 arcsec had the galaxy been at that redshift, because we excluded such galaxies from our analysis. The integral to calculate the total visibility volume is then:
| (4) |
with
| (5) |
the cluster redshift of the galaxy, , the fraction of the sky covered by our survey, and comoving distance and Hubble constant at redshift as defined in Hogg (1999).
In the second step, we have to take into account that only objects were selected if they belonged to a cluster, with at least three early-type galaxies obeying the diameter selection criterion. Therefore, the of a cluster is identical to the of the galaxy ranked third in diameter belonging to the cluster. The final of each galaxy is the minimum of its individual and cluster . This last step only modifies the of the top 3 diameter galaxies in each cluster, and only if the diameter limit of the cluster is reached before the third ranked galaxy is redshifted to 15000 km/s.
As mentioned before, the EFAR regions were chosen to be particular rich in clusters at the target redshift range. We used NED to estimate the size of the over density. NED lists 140 original, non supplement Abell clusters (Abell, 1958; Abell, Corwin, & Olowin, 1989) for () with km/s versus 87 in the EFAR regions (). This translates in an over density of about 1.75. However, we observed only 32 of the 87 clusters identified by NED, and while not every NED cluster should be in our sample (some cluster redshifts are based on only one galaxy redshift), it is clear that the over density is probably offset by incompleteness. Our sample contains another 41 clusters selected by other means, which are not included in the Abell catalog. We have no means to access the completeness of these in general smaller clusters. Given these uncertainties, we have decided not to correct for over density and incompleteness, and assume that the uncertainty in the absolute space density zero-point is a factor of two. We do however correct for our ellipticity incompleteness, assuming that elliptical galaxies with 0.4 constitute 65% of the total E+S0 population (Jørgensen & Franx, 1994).
We will show the factor 2 uncertainty in absolute zero-point of the space density distributions in the diagrams presented in the remainder of this section. This uncertainty will not affect the conclusions drawn from these diagrams. We will also show that our space density distribution and normalization is remarkably consistent with that of the SDSS, giving confidence that our normalization is indeed correct within a factor of 2.
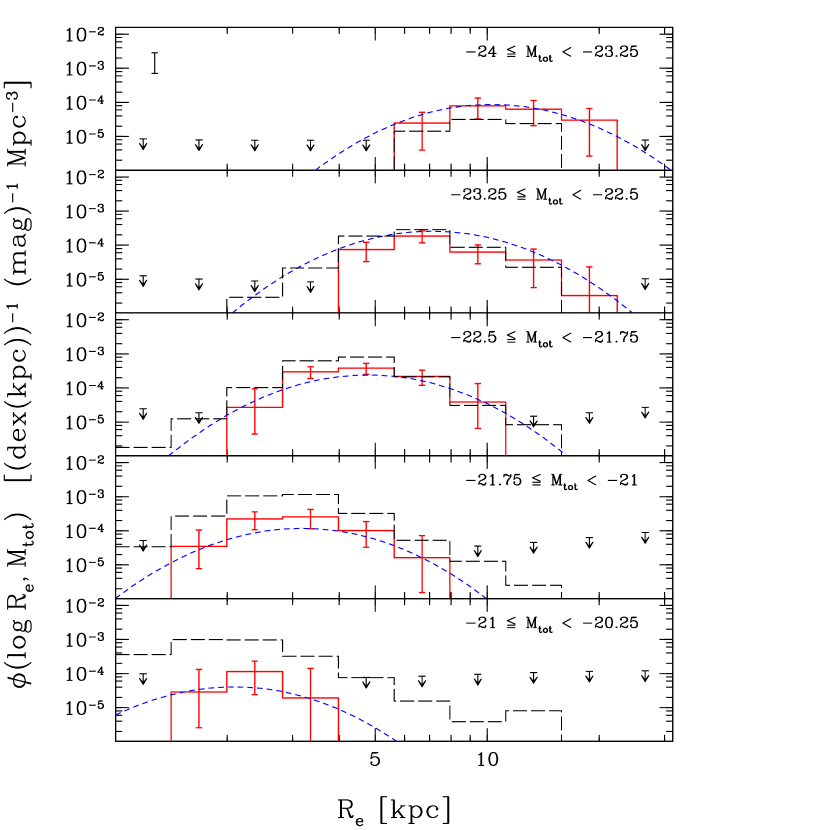
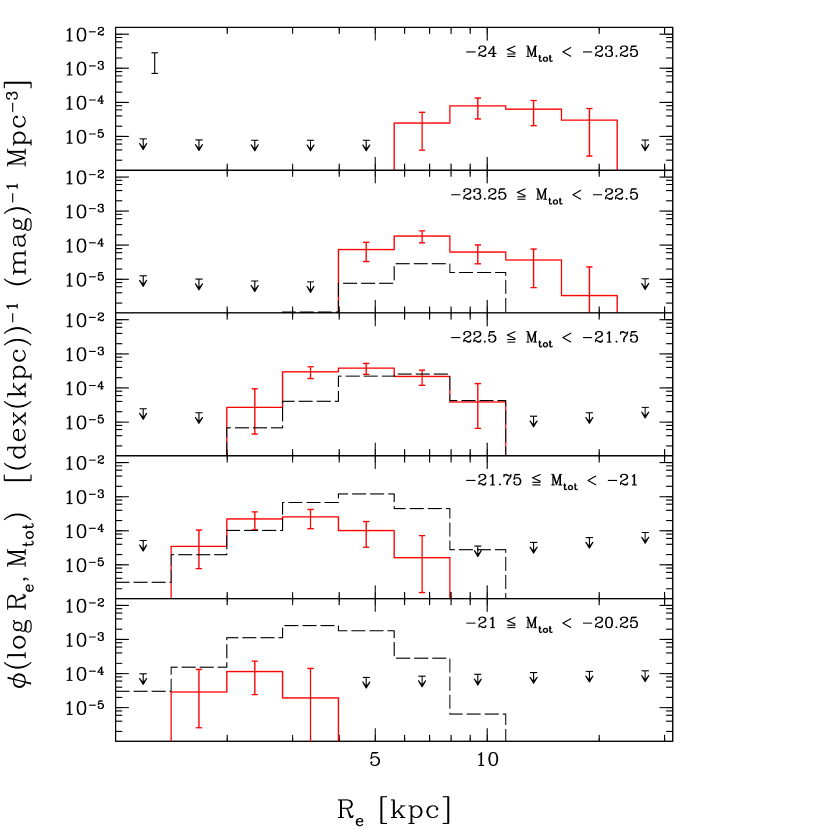
In Fig. 12 we show the combined bivariate space density of all non-spiral galaxies as function of absolute magnitude and effective radius. The 95% confidence limit error estimates on the number density distribution and the 95% confidence upper limits in the regions with no galaxies in the sample were derived in a similar fashion as described in de Jong & Lacey (2000), assuming a perfect law luminosity profile for all galaxies. These error estimates and upper limits include the effects of distance and diameter uncertainties and Poisson statistics.
Figure 12 also shows the fitted bivariate distribution function of the form described by de Jong & Lacey (2000). This function takes the shape of a Schechter (1976) luminosity function in the luminosity dimension (with the usual parameters , , and ), and of a log-normal distribution in the scale size dimension, with a width , a median scale size for galaxy with of , and a shift in median scale size with luminosity parametrized by :
The second line in this equation represents the Schechter luminosity function in magnitudes, while the third line represents the log-normal scale size distribution.
The function was fitted using a maximum likelihood technique and the resulting parameters are listed in Table 1, with the errors indicating the 95% confidence limits. These confidence limits were determined by means of Monte Carlo bootstrap resampling of the galaxies (Press et al., 1993), where we also varied the size of the bins in both directions. The fitted function is a good description of the observed distribution: the goodness-of-fit parameter (Press et al., 1993) was larger than 0.1 in more than 28% of the bootstrap resampled realizations and in more than 87% of the realizations. A function similar in shape was fitted by Chołoniewski (1985) to a sample of 233 elliptical galaxies and our parameters do agree to within the quoted uncertainties.
| Fit | ∗ | |||||
|---|---|---|---|---|---|---|
| ( Mpc-3) | (-mag) | (kpc) | ||||
| Total Galaxy | 0.99 0.19 | 1.06 0.26 | -21.81 0.18 | 3.9 0.5 | 0.34 0.04 | -0.62 0.08 |
| Bulge | 0.83 0.31 | 1.30 0.50 | -21.15 0.30 | 2.3 0.4 | 0.39 0.04 | -0.55 0.10 |
| Disc | 0.91 0.26 | -0.17 0.24 | -21.98 0.35 | 12.6 2.2 | 0.42 0.04 | -0.40 0.07 |
In Fig. 12 we compare our bivariate distribution with the findings of Blanton et al. (2003), based on the SDSS data (see their Fig. 13). They fitted Sérsic profiles to the total galaxy luminosity profiles, without an added exponential disc component and hence without doing a full bulge/disc decomposition. We show their distribution for all galaxies with an Sérsic . We scaled their distribution to our Hubble constant and using a to conversion of 0.2 mag (from Blanton et al. 2003 0.4, = , and from Bell & Vandenberg 1987).
Surprisingly, the distributions agree well at the bright end, even though our absolute space density zero-point calibration is somewhat uncertain (see errorbar in top panel) due to the cluster over density in the EFAR region and our limited knownledge of cluster incompleteness. The cutoff at 20 kpc in the Blanton et al. (2003) distribution is not real, but due to the cutoff in their figure. At fainter luminosities our distribution is lower than that of Blanton et al. (2003). One explanation for this might be that we were stricter in excluding spiral galaxies from our distribution, while the Blanton et al. distribution includes all galaxies with , which may include spiral galaxies whose combined bulge and disc luminosity profile mimics that of an elliptical galaxy. On the other hand, incompleteness may affect our distribution at the faint end. Our sample was drawn from rich clusters, while the Blanton et al. (2003) SDSS distributions were calculated for all sky. This will have little effect on the bright end of the distribution, because the brightest elliptical galaxies are only found in cluster, but will affect the faint end. Notwithstanding, the size distributions at a given luminosity are very similar.
In recent years it has become clear there are two types of elliptical galaxies (Kormendy & Bender, 1996; Faber et al., 1997). On the one hand we have the bright elliptical galaxies with boxy isophotes, with a clear central core, dynamically mainly pressure supported, while on the other hand we have the lower luminosity elliptical galaxies, often with more discy isophotes, cuspy cores and for a larger fraction supported and flattened by rotation. The boxy galaxies tend to be central dominant galaxies of clusters (cD galaxies) or at the center of one of the subclumps of a cluster (resulting from cluster merging?). The transition from one type into the other occurs at about -21.2 -mag (Faber et al., 1997), i.e. about -20.5 -mag, with an overlap of both types occurring for about 1.5 mag.
The bright, boxy type elliptical galaxies are probably the result of the merging of many subclumb units in the hierarchical galaxy formation scenario. The origin of the lower luminosity elliptical galaxies is less clear. They could be the result of the merging of two similar sized gaseous galaxies (Barnes, 1992) or the result of “failed” spiral galaxies due to the lack of angular momentum in the proto-galaxy (e.g., Dalcanton, Spergel, & Summers 1997; de Jong & Lacey 2000). These two options might actually be somewhat related, as merging of two sub units is of course the result of lack of orbital angular momentum. For S0 galaxies even more formation scenarios have been proposed: ram-pressure stripping of gas (Gunn & Gott, 1972; Kent, 1981; Quilis, Moore, & Bower, 2000), galaxy harassment via high speed impulsive encounters (Moore et al., 1996), cluster tidal forces (Byrd & Valtonen, 1990) which distort galaxies as they come close to the centre, interaction/merging of galaxies (Icke, 1985; Bekki, 1998), and removal & consumption of the gas due to the cluster environment (Larson, Tinsley, & Caldwell, 1980; Bekki, Couch, & Shioya, 2002). In all these scenarios the origin of non-boxy elliptical galaxies and S0 galaxies lies in spiral galaxies or proto-spiral clumps. Therefore, it seems natural to compare the size-luminosity distribution of our ellipical sample to that of spiral galaxies.
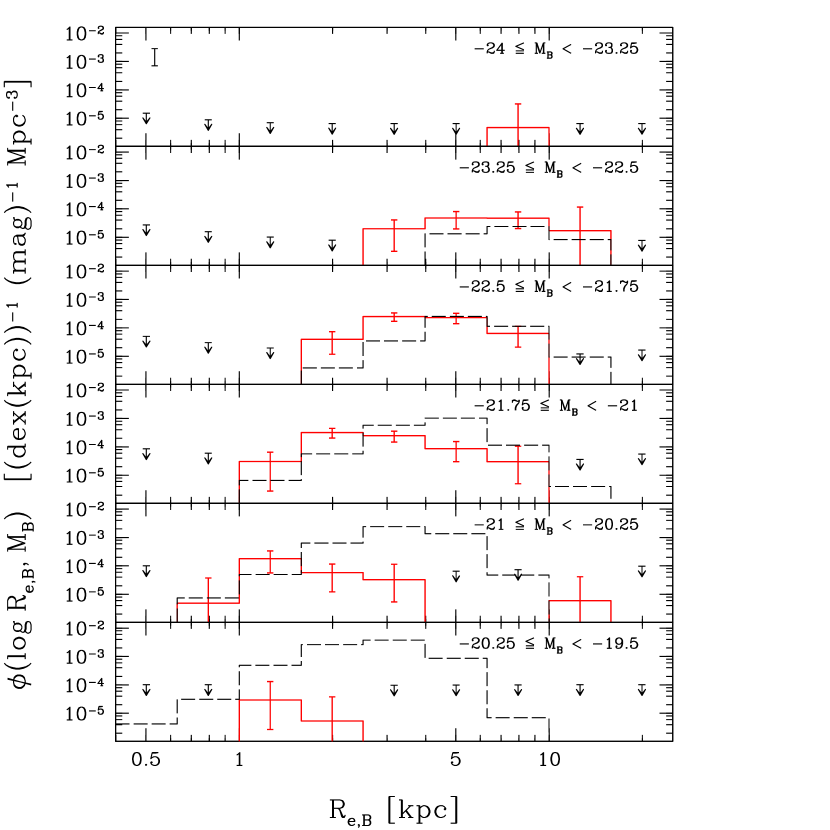
In Fig. 13 we show again the space density distribution of EFAR galaxies as function of size and luminosity, but this time we compare the distribution with that of Blanton et al. (2003) SDSS galaxies with Sérsic profile fits with , i.e. galaxies with exponential-like profiles, predominanlty spiral galaxies. The Blanton et al. distributions were scaled for Hubble constant and passband in the same way as in the previous diagram for galaxies. The disc effective radii were multiplied by 0.75 to take into account that for an -law galaxy the projected surface brightness effective radius is about 0.75 the spherical effective radius. In this way, we make a rough comparison between the stellar mass distributions, ignoring the effect of other baryonic components (most notably the H I in the disc galaxies, which could be converted to stars during merging) and the systematic change in with luminosity, especially for disc galaxies. When scaled for Hubble constant and passband, the Sc-Sd spiral galaxy distribution of de Jong & Lacey (2000) is very similar to the one of Blanton et al. (2003), particularly at the bright end.
Figure 13 immediately shows that to form the brightest elliptical galaxies one will need to merge several current day bright spiral galaxies, because there is a substantial space density of bright elliptical galaxies that are at least 0.75 magnitude brighter than the brightest spiral galaxies. In the process the effective radius of the resulting galaxy is increased by a factor of few compared to the originating galaxy, presumably because the kinematic energy of the galaxies orbiting each other is converted to heat the random kinematic energy of the stars in the merger product. Barnes (1992) finds for dissipationless equal mass mergers a typical increase of effective radius of about 1.4, similar to what one expects assuming conservation of energy and the virial theorum (Cole et al., 2000; Shen et al., 2003). We have stepped our luminosity bins in Fig. 13 by 0.75 mag, i.e. about a factor 2 in luminosity (and roughly stellar mass), so each equal mass dissipationless merger of two disc galaxies would result in a merger remnant one bin up with about 1.4 larger size. Merging of at least a few and probably many more of present day spiral galaxies would be needed to form the brightest elliptical galaxies. Because merging of spiral galaxies will involve dissipation and therefore the scale size may be less, it may be more reasonable to think that the brightest elliptical galaxies formed from the merging of several smaller E/S0 galaxies.
A similar conclusion was reached by Shen et al. (2003). They showed that by having a series of mergers of small elliptical galaxies they could create the observed size-luminosity relation and its dispersion, when making reasonable assumptions about the transfer of orbital angular energy. However, they did not compare space densities, and furthermore, this process leaves the question of the origin of small elliptical galaxies unanswered.
The distribution of the lower luminosity elliptical galaxies (-22.5 -mag) in Fig. 13 is more surprising. Even though in number density not completely unlike the spiral galaxies (remember the absolute zero-point for the elliptical distribution is somewhat uncertain), the effective radius distribution of the elliptical galaxies peaks at smaller radii than the distribution of disc galaxies. As argued before, dissipationless merging results in larger scale sizes, typically by a factor of about 1.4, and therefore the dissipationless merging of typical current day spiral galaxies cannot result in these current day lower luminosity elliptical galaxies.
What other creation scenarios can we invoke to explain the lower luminosity elliptical galaxies? First of all, the merging of two spiral galaxies is not going to be dissipationless. Simulations that include gas show that during the merger process gas will quickly stream to the center of the merging galaxies, presumably creating a starburst and dragging along some of the existing stellar population, creating a more concentrated stellar remnant. Whether this process is enough to offset the effect of the added orbital kinematic energy is questionable, given that current bright spiral galaxies have gas mass fractions of 5–20%. At higher redshifts the gas fractions will have been higher and therefore this process may have been more efficient then. In the hierarchical galaxy formation picture, galaxies at higher redshifts have smaller scale sizes, so the small scale sizes of low luminosity elliptical galaxies in clusters may be the result of high redshift mergers which have subsequetially not been able to grow any more in the cluster environment.
Another option to explain the small scale sizes of lower luminosity elliptical galaxies might come from the failed disc scenario proposed by several authors for different reasons (e.g., Dalcanton, Spergel, & Summers 1997; Mo, Mao, & White 1998; de Jong & Lacey 2000; McGaugh & de Blok 1998). de Jong & Lacey (2000) found that the scale size distribution of spiral galaxies used here was narrower than what one would expect in hierarchical galaxy formation scenario where disc galaxy sizes are determined by their spin acquired from tidal torques with neighbors. They proposed (similar to Mo, Mao, & White 1998) that the lowest angular momentum proto galaxies never were able to form a proper disc and immediately collapsed to spheroids. The problem here is that we cannot compare the elliptical galaxy distribution drawn from a cluster sample to the distribution of spiral galaxies drawn mainly from the field.
Can spiral galaxies falling into a cluster result in a elliptical scale size distribution as observed here? Simple stripping of gas by ram-pressure or tidal interactions and subsequent fading of the stellar population is clearly not enough, elliptical galaxies are just too small compared to spiral galaxies. Subsequent stripping of the stars in the outer parts of the infalling disc galaxy by galaxy harassment (Moore et al., 1996) could result in smaller effective radii of the remnants. Still a lot of stripping would have to occur, as stripping half the stellar mass exclusively from the outer part of the galaxy would shift the disc distribution one bin down while dividing the size by two. A considerable fraction of this process would have to occur at quite high redshifts () as only then bright disc galaxies were substantially smaller than current day disc galaxies (de Jong & Lacey, 1999; Ravindranath et al., 2004; Ferguson et al., 2004).
As so often, several of the options listed above combined may be the final answer. However, these relative elliptical and spiral galaxy scale size distributions suggest that a substantial fraction of the lower luminosity elliptical galaxies were created at quite high redshift, not only in stars but also in structural parameters, when disc galaxies were still smaller and more gas rich.
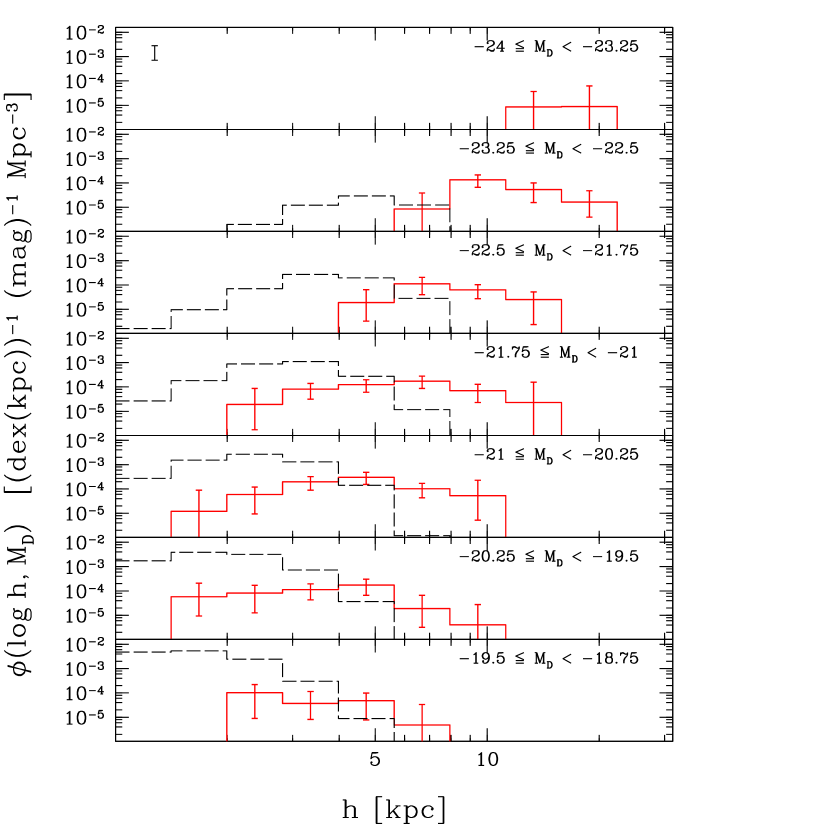
Until so far, we have only looked at the luminosities and sizes for the total systems, but in Figs.14 and 15 we show the luminosity-size distributions for the bulges and the discs, respectively. The luminosity and size parameters are much better determined for the total system than for its components, but nontheless it will be instructive to compare the distributions of the components to that of spiral galaxies.
Comparison of the elliptical bulge parameters with the SDSS disc parameters in Fig. 14 shows that the distributions are somewhat similar, but that the bulges are about a factor 1.5 to 2.5 smaller than the spiral discs from the brightest to the faintest luminosities. The scaling of the SDSS disc parameters is here the same as in Fig. 13, including the factor 0.75 decrease in disc scale sizes to account for the difference of a spherical bulge projected to a 2D effective radius versus a 2D disc effective radius.
On the other hand, when we compare in Fig. 15 the SDSS disc parameter distribution with the distribution for the component identified as discs in our EFAR sample, we see again somewhat similar, parallel distributions, but this time the EFAR disc-like component is about a factor two larger than the SDSS discs. We have to be careful, because as argued before in section 3.3 when discussing Fig. 7, discs with low surface brightness and/or small scale length might be hard to detect when superposed on a high surface brightness bulge and therefore this distribution may be incomplete. Still, it is clear that there are larger disc components in the EFAR non-spiral galaxies than seen in the SDDS spiral discs. Upper limits are somewhat hard to draw on this diagram, as the selection was dominated by the bulge light distribution, not by the disc light.
Without kinematic information proving that the B/D decompositions we made of our sample has an underlying physical meaning it is somewhat premature to interpret these distributions in detail, but we can make some speculations. Could the spheroidal components be the result of early, disipationless mergers of roughly equally sized galaxies from the time when galaxies were still much smaller (1–2)? The disc-like component can clearly not be formed from normal disc galaxies, there scale sizes are just too large for their luminosity. The disc-like component tends to dominate a bit in the most luminous galaxies (see Fig. 9). Are these the stars from smaller, infalling galaxies which maintain a larger component from their initial orbital energy? Do they form disc-like components because they predominantly fall into the cluster on the central galaxies along the filamentary structures of the cosmic web?
While attractive from the galaxy structure point of view, this picture leaves some other properties of elliptical galaxies unexplained. Elliptical galaxies in clusters obey a colour-magnitude relation up to redshifts of 0.9 (e.g., Stanford, Eisenhardt, & Dickinson 1998), which means that this relation is driven by a mass-metallicity relation, bigger galaxies being more metal rich. This therefore means that the proto-galaxies that formed the big spheroids in the above picture would have to have higher metallicity before they merged than the proto-galaxies of smaller galaxies. Big elliptical galaxies also have higher -element over Fe abundance ratios than smaller galaxies, meaning that their star formation time-scales must have been shorter (e.g., Mehlert et al. 2003). In the hierarchical galaxy formation picture this could be accomplished by having the proto-galaxies that will merge into big galaxies form early on top of an over-density of what will later become a cluster of galaxies at redshifts much larger than 3. In a CDM Universe there would be a lot of early merging causing vigorous and short time-scale star formation, leading to non-Solar rates of -element over abundances. Because these proto-galaxies would already live in the deeper potential well of what will later become a large galaxy in a cluster of galaxies, they would be better in holding on to their enriched gas and therefore be able to create the mass-metallicity relation. However, in the above picture galaxies falling in along the filaments would have lower (over-)abundances and would potentially be somewhat younger, and hence the disc components should have lower metallicity and age. While de Jong & Davies (1997) show that discy elliptical galaxies indeed have line indices indicating younger ages and/or lower metallicities, spatial resolved line indices mapping as performed by for instance the SAURON team (Falcón-Barroso et al., 2004) will be needed to fully access this model.
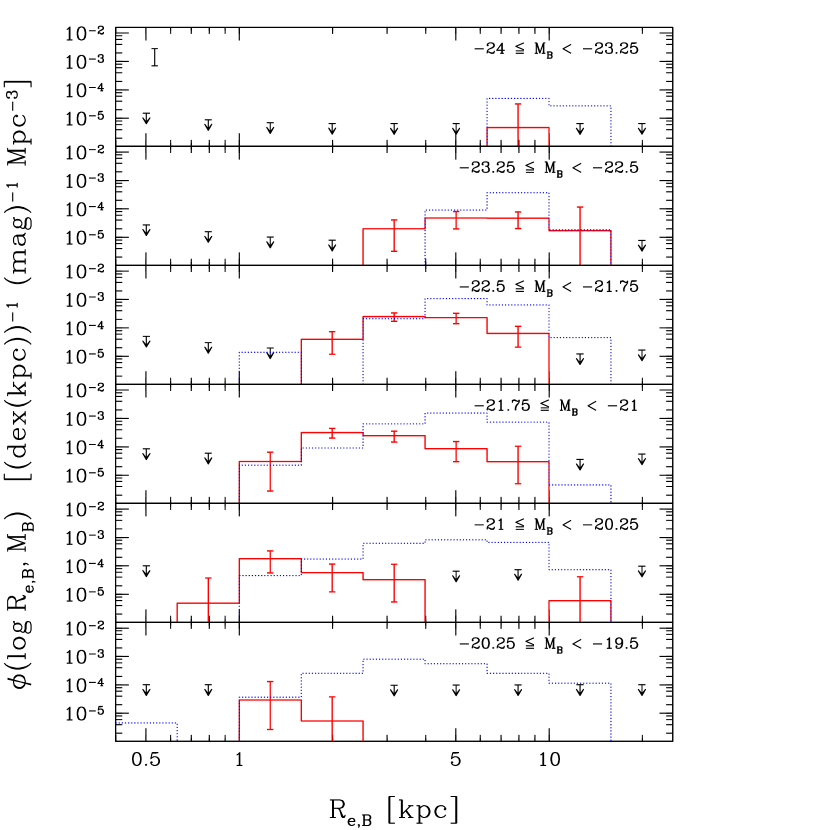
Figure 16 shows the comparison of the (bulge magnitude, bulge effective radius)-bivariate space density of the EFAR elliptical galaxies with the models of Cole et al. (2000). The models are over-predicting the effective radii of early-type bulges by about a factor of two, even more at fainter magnitudes. This is the same problem as identified in Fig. 13; the effective radii of low luminosity early-type galaxies are smaller than those of spiral galaxies of similar luminosity. Cole et al. assumed that all early-type galaxies were created by merging in their models, and as their models do a reasonable job in modelling the spiral galaxy scale size distribution (de Jong & Lacey, 2000), the models will over-predict the early-type galaxy scale size in the same way as was discussed for Fig. 13.
4 Summary and conclusions
We have performed 2D bulge/disc decompositions on a sample of 558 early-type galaxies from the EFAR sample using the GIM2D package. In contrast with most earlier work, we have used a Sérsic luminosity profile for the spheroidal component, while using the common exponential light profiles for the disc-like component. We showed with extensive testing on model galaxies that the total galaxy parameters and disc parameters can be recoverd at the 10-15% level, but that the bulge parameters are only recovered at the 30% level, mainly due to degeneracies resulting in correlated errors between and . Our galaxy selection criteria are well known and we have calculated bivariate space densities of elliptical galaxies as function of galaxy parameters.
Without kinematic or population information it is impossible to prove that our bulge and disc parameter are physically meaningful, but under the assumption that the spheroid and disc parameters represent real galaxy components we derive the following conclusions:
-
1.
The scale sizes of the bulge and disc components are correlated. This may be partly due to the exclusion of spiral galaxies from the sample, excluding objects with small bulges and large discs. However, it should be noted that spiral galaxies show a similar trend (de Jong, 1996b; Courteau, de Jong, & Broeils, 1996; MacArthur, Courteau, & Holtzman, 2003).
-
2.
The bulge-to-disc ratios, the Sérsic bulge shape parameters, and the bulge effective radii show positive correlations with each other. We have no model that tells us which is cause and what is effect.
-
3.
The median value is 3.24 for all galaxies in our sample, is 3.66 for all non-spiral, bulge dominated galaxies in our sample, and is 4 for non-spiral galaxies with 0.7. Given that most spiral galaxies have bulge values much lower than these values, this means that the standard de Vaucouleurs (i.e. =4) fitted to spheroids may not be the most appropriate choice when doing bulge/disc decompositions on a random set of galaxies. In cases where one does not have the signal-to-noise or the spatial resolution to perform full Sérsic bulge plus exponential disc fit, it will be more correct to use fixed value of 3.5 for the brightest galaxies. Lower values should be used for less luminous galaxies.
-
4.
The (luminosity, scale size) bivariate space density distribution of bright elliptical galaxies is well described by the analytic parametrization presented by de Jong & Lacey (2000).
-
5.
Comparing the total galaxy (luminosity, scale size) bivariate distributions of EFAR non-spiral galaxies with SDSS disc-like galaxies shows that the brightest early-type galaxies could in principle be formed by merging a few large, current day spiral galaxies. Low luminosity early-type galaxies have much smaller scale sizes than spiral galaxies of the same luminosity, and hence they can surely not be created from simple merging of two current day spiral galaxies.
-
6.
When comparing the EFAR bulge and disc (luminosity, scale size) bivariate distributions to those of the SDSS disc-like galaxies, we showed that the bulges of early-type galaxies are typically a factor 1.5 to 2.5 smaller and the discs a factor 2 larger than current day disc galaxies at a given luminosity.
We speculate that the spheroidal components are the result of merging of similar sized small proto-galaxies galaxies at high redshifts, while the disc-like component may be the result of smaller galaxies falling in later along the filaments of the cosmic web. While attractive from the galaxy structure point of view, this model requires careful tuning of the formation process of the proto-galaxies at high redshift in order to reproduce the mass-metallicity relation and the -element over-abundace observed at lower redshifts.
Acknowledgements
We thank Frank Summers for generously making his computing resources available for this project. We thank an anomynous referee whos comments have helped us to improve the paper. Support for RSdJ was partly provided by NASA through Hubble Fellowship grant #HF-01106.01-A from the Space Telescope Science Institute, which is operated by the Association of Universities for Research in Astronomy, Inc., under NASA contract NAS5-26555. This work was partially supported by NSF Grant AST90-16930 to DB, AST90-17048 and AST93-47714 to GW, AST90-20864 to RKM. The entire collaboration benefitted from NATO Collaborative Research Grant 900159 and from the hospitality and monetary support of Dartmouth College, Oxford University, the University of Durham and Arizona State University. Support was also received from PPARC visitors grants to Oxford and Durham Universities and a PPARC rolling grant: “Extragalactic Astronomy and Cosmology in Durham 1994-98”. This project made use of STARLINK facilities in Durham.
This research has made use of NASA’s Astrophysics Data System. This research has made use of the NASA/IPAC Extragalactic Database (NED) which is operated by the Jet Propulsion Laboratory, California Institute of Technology, under contract with the National Aeronautics and Space Administration.
Funding for the creation and distribution of the SDSS Archive has been provided by the Alfred P. Sloan Foundation, the Participating Institutions, the National Aeronautics and Space Administration, the National Science Foundation, the U.S. Department of Energy, the Japanese Monbukagakusho, and the Max Planck Society. The SDSS Web site is http://www.sdss.org/.
The SDSS is managed by the Astrophysical Research Consortium (ARC) for the Participating Institutions. The Participating Institutions are The University o f Chicago, Fermilab, the Institute for Advanced Study, the Japan Participation Group, The Johns Hopkins University, Los Alamos National Laboratory, the Max-Planck-Institute for Astronomy (MPIA), the Max-Planck-Institute for Astrophysics (MPA), New Mexico State University, Princeton University, the United States Naval Observatory, and the University of Washington.
References
- Abell (1958) Abell G. O., 1958, ApJS, 3, 211
- Abell, Corwin, & Olowin (1989) Abell G. O., Corwin H. G., Olowin R. P., 1989, ApJS, 70, 1
- Andredakis, Peletier, & Balcells (1995) Andredakis Y. C., Peletier R. F., Balcells M., 1995, MNRAS, 275, 874
- Balcells et al. (2003) Balcells M., Graham A. W., Domínguez-Palmero L., Peletier R. F., 2003, ApJ, 582, L79
- Balcells, Graham & Peletier (2004) Balcells M., Graham A. W., Peletier R. F., 2004, submitted to ApJ, astro-ph/0404381
- Barnes (1992) Barnes J. E., 1992, ApJ, 393, 484
- Bekki (1998) Bekki K., 1998, ApJ, 502, L133
- Bekki, Couch, & Shioya (2002) Bekki K., Couch W. J., Shioya Y., 2002, ApJ, 577, 651
- Bell & Vandenberg (1987) Bell R. A., Vandenberg D. A., 1987, ApJS, 63, 335
- Bender et al. (1989) Bender R., Surma P., Doebereiner S., Moellenhoff C., Madejsky R., 1989, A&A, 217, 35
- Bertin & Arnouts (1996) Bertin E., Arnouts S., 1996, A&AS, 117, 393
- Blanton et al. (2003) Blanton M. R., et al., 2003, ApJ, 594, 186
- Burstein (2003) Burstein D., 2003, AJ, 126, 1849
- Burstein & Heiles (1982) Burstein D., Heiles C., 1982, AJ, 87, 1165
- Burstein et al. (1997) Burstein D., Bender R., Faber S., Nolthenius R., 1997, AJ, 114, 1365
- Byrd & Valtonen (1990) Byrd G., Valtonen M., 1990, ApJ, 350, 89
- Caon, Capaccioli, & D’Onofrio (1993) Caon N., Capaccioli M., D’Onofrio M., 1993, MNRAS, 265, 1013
- Chołoniewski (1985) Chołoniewski J., 1985, MNRAS, 214, 197
- Cole et al. (2000) Cole S., Lacey C. G., Baugh C. M., Frenk C. S., 2000, MNRAS, 319, 168
- Colless et al. (2001a) Colless M., Saglia R. P., Burstein D., Davies R. L., McMahan R. K., Wegner G., 2001a, MNRAS, 321, 277 (Paper VII)
- Colless et al. (2001b) Colless M., et al., 2001b, MNRAS, 328, 1039
- Combes et al. (1990) Combes F., Debbasch F., Friedli D., Pfenniger D., 1990, A&A, 233, 82
- Cross et al. (2001) Cross N., et al., 2001, MNRAS, 324, 825
- Courteau, de Jong, & Broeils (1996) Courteau S., de Jong R. S., Broeils A. H., 1996, ApJ, 457, L73
- Dalcanton, Spergel, & Summers (1997) Dalcanton J. J., Spergel D. N., Summers F. J., 1997, ApJ, 482, 659
- de Jong (1996a) de Jong R. S., 1996a, A&AS, 118, 557
- de Jong (1996b) de Jong R. S., 1996b, A&A, 313, 45
- de Jong & Davies (1997) de Jong R. S., Davies R. L., 1997, MNRAS, 285, L1
- de Jong & Lacey (1999) de Jong R. S., Lacey C., 1999, Ap&SS, 269, 569
- de Jong & Lacey (2000) de Jong R. S., Lacey C., 2000, ApJ, 545, 781
- de Vaucouleurs (1948) de Vaucouleurs G., 1948, AnAp, 11, 247
- de Vaucouleurs (1959) de Vaucouleurs G., 1959, HDP, 53, 311
- Disney & Phillipps (1983) Disney M., Phillipps S., 1983, MNRAS, 205, 1253
- D’Onofrio (2001) D’Onofrio M., 2001, MNRAS, 326, 1517
- Emsellem et al. (2004) Emsellem E., Cappellari M., Peletier R. F., McDermid R. M., Bacon R., Bureau M., Copin Y., Davies R. L., Krajnovic D., Kuntschner H., Miller B. W., de Zeeuw P. T., 2004, MNRAS in press (astro-ph/0404034)
- Faber et al. (1997) Faber S. M., et al., 1997, AJ, 114, 1771
- Falcón-Barroso et al. (2004) Falcón-Barroso J., et al., 2004, MNRAS, 350, 35
- Felten (1976) Felten J. E., 1976, ApJ, 207, 700
- Ferguson et al. (2004) Ferguson H. C., et al., 2004, ApJ, 600, L107
- Fish (1964) Fish R. A., 1964, ApJ, 139, 284
- Freeman (1970) Freeman, K. C., 1970, ApJ, 160, 811
- Graham (2001) Graham A. W., 2001, AJ, 121, 820
- Graham & Colless (1997) Graham A., Colless M., 1997, MNRAS, 287, 221
- Gunn & Gott (1972) Gunn J. E., Gott J. R. I., 1972, ApJ, 176, 1
- Gutiérrez et al. (2004) Gutiérrez C. M., Trujillo I., Aguerri J. A. L., Graham A. W., Caon N., 2004, ApJ, 602, 664
- Hogg (1999) Hogg D. W., 1999, astro-ph/9905116
- Icke (1985) Icke V., 1985, A&A, 144, 115
- Jørgensen & Franx (1994) Jørgensen, I., Franx, M. 1994, ApJ 433, 553
- Kauffmann et al. (2003) Kauffmann G., et al., 2003, MNRAS, 341, 54
- Kent (1981) Kent S. M., 1981, ApJ, 245, 805
- Kormendy (1977) Kormendy J., 1977, ApJ, 217, 406
- Kormendy & Bender (1996) Kormendy J., Bender R., 1996, ApJ, 464, L119
- Larson, Tinsley, & Caldwell (1980) Larson R. B., Tinsley B. M., Caldwell C. N., 1980, ApJ, 237, 692
- MacArthur, Courteau, & Holtzman (2003) MacArthur L. A., Courteau S., Holtzman J. A., 2003, ApJ, 582, 689
- McGaugh & de Blok (1998) McGaugh S. S., de Blok W. J. G., 1998, ApJ, 499, 41
- Mehlert et al. (2003) Mehlert D., Thomas D., Saglia R. P., Bender R., Wegner G., 2003, A&A, 407, 423
- Metropolis et al. (1953) Metropolis N., Rosenbluth A., Rosenbluth M., Teller A., Teller E., 1953, J. Chem. Phys., 21, 1087
- Mo, Mao, & White (1998) Mo H. J., Mao S., White S. D. M., 1998, MNRAS, 295, 319
- Moore et al. (1996) Moore B., Katz N., Lake G., Dressler A., Oemler A., 1996, Nature, 379, 613
- Pfenniger & Norman (1990) Pfenniger D., Norman C., 1990, ApJ, 363, 391
- Press et al. (1993) Press W. H., Teukolsky S. A., Vetterling W. T., Flannery B. P., Lloyd C., Rees P., 1993, Numerical Recipes in C (Cambridge, Cambridge Univ. Press)
- Quilis, Moore, & Bower (2000) Quilis V., Moore B., Bower R., 2000, Sci, 288, 1617
- Ravindranath et al. (2004) Ravindranath S., et al., 2004, ApJ, 604, L9
- Rix & White (1990) Rix H., White S. D. M., 1990, ApJ, 362, 52
- Saglia et al. (1997a) Saglia R. P., Burstein D., Baggley G., Davies R. L., Bertschinger E., Colless M. M., McMahan R. K., Wegner G., 1997a, MNRAS, 292, 499 (Paper III)
- Saglia et al. (1997b) Saglia R. P., Bertschinger E., Baggley G., Burstein D., Colless M., Davies R. L., McMahan R. K., Wegner G., 1997b, ApJS, 109, 79 (Paper IV)
- Schechter (1976) Schechter P., 1976, ApJ, 203, 297
- Schlegel, Finkbeiner, & Davis (1998) Schlegel D. J., Finkbeiner D. P., Davis M., 1998, ApJ, 500, 525
- Schmidt (1968) Schmidt M., 1968, ApJ, 151, 393
- Scorza & Bender (1995) Scorza C., Bender R., 1995, A&A, 293, 20
- Scorza & van den Bosch (1998) Scorza C., van den Bosch F. C., 1998, MNRAS, 300, 469
- Sérsic (1968) Sérsic, J.-L. 1968, Atlas de Galaxes Australes (Observatorio Astronomica, Cordoba)
- Shen et al. (2003) Shen S., Mo H. J., White S. D. M., Blanton M. R., Kauffmann G., Voges W., Brinkmann J., Csabai I., 2003, MNRAS, 343, 978
- Simard et al. (2002) Simard L., et al., 2002, ApJS, 142, 1
- Stanford, Eisenhardt, & Dickinson (1998) Stanford S. A., Eisenhardt P. R., Dickinson M., 1998, ApJ, 492, 461
- Trujillo et al. (2004) Trujillo I., Erwin P., Ramos A. A., Graham A. W., 2004, AJ, 127, 1917
- Trujillo et al. (2002) Trujillo I., Asensio Ramos A., Rubiño-Martín J. A., Graham A. W., Aguerri J. A. L., Cepa J., Gutiérrez C. M., 2002, MNRAS, 333, 510
- Wegner et al. (1996) Wegner G., Colless M., Baggley G., Davies R. L., Bertschinger E., Burstein D., McMahan R. K., Saglia R. P., 1996, ApJS, 106, 1 (Paper I)
- York et al. (2000) York D. G., et al., 2000, AJ, 120, 1579