X-ray spectral and timing characteristics of the stars in the young open cluster IC 2391
We present X-ray spectral and timing analysis of members of the young open cluster IC 2391 observed with the XMM-Newton observatory. We detected 99 X-ray sources by analysing the summed data obtained from MOS1, MOS2 and pn detectors of the EPIC camera; 24 of them are members, or probable members, of the cluster. Stars of all spectral types have been detected, from the early-types to the late-M dwarfs.
Despite the capability of the instrument to recognize up to 3 thermal components, the X-ray spectra of the G, K and M members of the cluster are well described with two thermal components (at kT 0.3-0.5 keV and kT 1.0-1.2 keV respectively) while the X-ray spectra of F members require only a softer 1-T model.
The Kolmogorov-Smirnov test applied to the X-ray photon time series shows that approximately 46% of the members of IC 2391 are variable with a confidence level 99%. The comparison of our data with those obtained with ROSAT/PSPC, nine years earlier, and ROSAT/HRI, seven years earlier, shows that there is no evidence of significant variability on these time scales, suggesting that long-term variations due to activity cycles similar to that on the Sun are not common, if present at all, among these young stars.
Key Words.:
X-ray: stars – Stars: activity – Stars: early-type – Stars: late-type – Open clusters and associations: individual: IC 23911 Introduction
Most of our knowledge on the long-term evolution of coronal emission derives from observations of open clusters, which supply large, chemically homogeneous, and well dated samples. First X-ray studies of open clusters with the Einstein Observatory (Stern et al. 1981; Caillault & Helfand 1985; Micela et al. 1985, 1988, 1990) showed that the average level of X-ray luminosity decays with age. ROSAT observations have extended the Einstein results both by enlarging the number of known X-ray emitters in a given cluster and covering clusters over a much wider age range (e.g., Stern et al. 1995; Gagné et al. 1995; Micela et al. 1996, 1999; Stauffer et al. 1994; Randich et al. 1995, 1996; Prosser et al. 1996; Jeffries et al. 1997; Randich 1998; Micela et al. 2000; Franciosini et al. 2000; Sciortino et al. 2000; Barbera et al. 2002). The comparison of different open clusters shows that the X-ray emission decreases from younger clusters (like IC 2391, IC 2602 at 30 Myr) to intermediate age clusters (like Per, Pleiades and NGC2516 at 50 - 100 Myr), to older clusters (like Hyades, Coma, Praesepe at 500-700 Myr). There is ample consensus that X-ray luminosity evolves during the stellar lifetime mainly as a result of the spin down due to magnetic braking. The coronal emission is influenced by several stellar properties but the rotation, in particular, plays a fundamental role; since rotation evolves with age so does coronal activity.
Data on open cluster have shown that the most active stars, with rotation velocities
above 15-20 km/s, reach a maximum X-ray luminosity such that
Lx/Lbol saturates at 10-3,
where Lbol is the star’s bolometric luminosity (e.g. Vilhu 1984; Pizzolato et al. 2003).
Saturation lacks a clear interpretation: it could be the effect
of dynamo saturation, or it could correspond to the total filling of the star’s surface
by active regions, as originally suggested by Vilhu (1984) or it could be the result of
other, yet unknown, phenomena.
Furthermore ROSAT observations have shown that stars rotating even
faster (v sin i 100 km/s) exhibit a level of X-ray luminosity
3-5 times below the saturation level (Randich 1998).
The origin of this phenomenon, named supersaturation by Prosser et al. (1996),
is still unexplained and several hypotheses have been formulated. Supersaturation could
be the result of an overall decrease of dynamo efficiency at very high rotation rates
or the consequence of the redistribution of the radiative output due to the lower
stellar ”effective” gravity because of the enhanced rotation (Randich 1998).
Recently, Marino et al. (2003a) has found evidence of rotational modulation in a
supersaturated star of IC 2391 with a very short photometric period of 0.22 days.
The observed modulation implies that the star is not completely covered by active regions.
As an explanation, Jardine (2004) has suggested that the X-ray emitting corona
of rapid rotators suffers a centrifugal stripping of coronal
loops, producing open field regions that become dark in X-rays.
The IC 2391 open cluster is an ideal laboratory for testing activity-age
relations in fast rotators, because it is young enough
( 30 Myr) that for solar-type members to have just arrived on the zero-age
main-sequence (ZAMS).
At a relatively nearby distance (162 pc), this southern cluster
contains about 172 known members or probable members, ranging in spectral
type from B to M, enabling the simultaneous study of the different processes driving X-ray
emission from stars of different internal structure.
The first X-ray observation of the cluster was performed with the ROSAT/PSPC
(Patten & Simon 1993, 1996), followed by a 56 ksec ROSAT/HRI observation (Simon & Patten 1998).
These observations have shown that among the late-type members of the
cluster the spread of X-ray luminosities is as large as a factor 20.
A similar spread is observed in the rotational periods, implying that the stars
arrive on the ZAMS with a wide range both in angular momentum and activity level values.
However, the limited sensitivity of the ROSAT observations has allowed the
detection of only a small fraction of dM cluster members.
On the other hand some dM stars in IC 2391 have been observed and catalogued
only recently.
In this paper we report the results of the analysis of the XMM-Newton observation of IC2391, which covers a field of 30 in the central region of the cluster. The XMM-Newton/EPIC higher sensitivity and spectral resolution, combined with its larger spectral band and more continuous time coverage with respect to that of ROSAT, allow us to improve our knowledge of spectral and timing characteristics of the cluster coronae. Unfortunately the cluster size is 4 square degrees, therefore our observation covers only a small fraction of the known members.
The structure of the paper is the following: Sect. 2 describes the XMM-Newton/EPIC observation and the data analysis; Sect. 3 and 4 report the spectral and time analysis, respectively; Sect. 5 summarizes the main results.
2 X-ray observation and data analysis
2.1 XMM/EPIC Observation and data reduction
We present the analysis of the Guaranteed Time XMM-Newton/EPIC observation pointed on the young open cluster IC 2391. The observation (Obs. Nr. 0112420101), centered on = 8h 42m 00s, = -53o 00 36, was performed on Nov 20, 2001 during orbit 357 of XMM-Newton (Jansen et al. 2001). XMM-Newton carries three X-ray telescopes observing simultaneously the same region of the sky; the collected photons form images on three CCD-based detectors: the pn (Strüder et al. 2001) and the twin MOS1 and MOS2 (Turner et al. 2001) which constitute the EPIC camera. All three EPIC detectors were active at the time of the observation with the medium filter in the EPIC/pn and thick filters in the EPIC/MOS detectors. An exposure time of 50 ksec was scheduled, but due to an intense background level (see below), only 31.4 ksec were effectively obtained in the EPIC/pn and 43.3 ksec in each of the two MOS.
The data have been processed using the XMM-Newton Science Analysis System (SAS) version 5.4.1111released on January 2003 and available at the http://xmm.vilspa.esa.es.. We used the epchain and emchain tasks to process the EPIC Observation Data File data, obtaining three photon lists with time, position and energy of the events recorded in the pn and MOS detectors. In order to minimize the background due to non-X-ray events we have retained only events in the 0.3-7.8 keV band and single, double, triple, and quadruple pixel events. We have limited the energy band to 0.3-7.8 keV since data below 0.3 keV are mostly unrelated to bona-fide X-rays, while above 7.8 keV only background counts are present for the kind of sources we are interested to. Furthermore we have filtered the data to minimize the so-called proton flare phenomenon which produces an enhancement of noise due to protons ”focused” by XMM-Newton mirrors and essentially indistinguishable from bona-fide X-ray events. Since our aim was to maximize the signal to noise ratio, we have applied a technique developed at INAF - Osservatorio Astronomico of Palermo (Sciortino et al. 2002) that maximizes the statistical significance of weak sources by identifying and removing fractions of the exposure time strongly affected by high-background episodes. Fig. 1 shows the total count rate for the pn data set versus time, together with the threshold (horizontal line) above which the data are discarded. In the observation, a negligible number of narrow temporal segments were affected by a high count rate for a total of 30 s and 50 s for MOS1 and MOS2, respectively, while in the EPIC/pn (see Fig. 1) we have eliminated 5.4 ksec at the beginning of the observation.

2.2 Source detection
The source detection has been performed on the summed data set images
using the Wavelet Detection Algorithm developed at the INAF - Osservatorio Astronomico di
Palermo and based on the algorithm previously developed for the ROSAT/PSPC
(Damiani et al. 1997a, b) and adapted to the XMM-Newton case.
Large sets of simulations of pure background were performed in order to derive
the appropriate detection threshold that limits the number of spurious detections.
We adopted a threshold which statistically retains only one spurious source per field.
In order to perform this analysis, an exposure map was created with the SAS
task eexpmap for each EPIC detector.
Since the pn is more sensitive than the MOS detectors, the pn time has
been scaled with an appropriate factor in order to obtain a final exposure
map in ”MOS-equivalent” time.
The factor has been evaluated as the ratio between the rate measured in the pn
image and in one of the MOS images for the common sources.
The final effective time depends on the position in the field of view:
its value on-axis is about six times that at the edge of the field
of view; such a big difference implies a very different sensitivity for source detection
at the center and at the edge of the field of view (FOV).
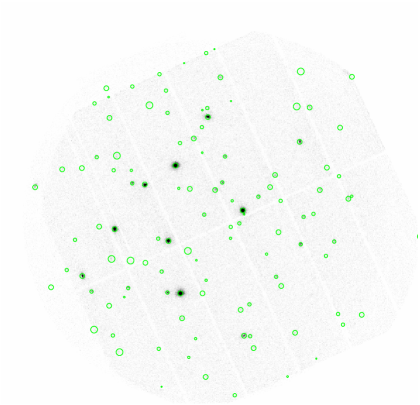
We have found 99 X-ray sources (see Fig. 2 and Table 1)
after removing some spurious detections due to hot pixels not listed in the
calibration files we had available.
Exposure time and count rates in Table 1 are expressed in MOS1-equivalent
units; col. 7 gives the probability level for the source to be a background
fluctuation expressed in terms of a gaussian--equivalent.
We have computed the Hardness Ratios (HR) of the X-ray sources detected in the pn
data, in order to estimate approximately the characteristic temperature of the
emitting coronal plasma.
The HR, evaluated as (H-S)/(H+S) (H and S are the counts in the hard (0.8-3.5 keV)
and soft (0.3-0.8 keV) bands, respectively), is reported in col. 8 of Table 1
with the corresponding error computed assuming Poisson statistics in each band.
Source photons were extracted from circular regions of 45″, and background
was measured in annuli, with radii of 50″ and 67.2″.
In some cases, smaller radii were adopted to exclude contributions from nearby sources.
The HR for the IC 2391 members and probable members (top panel in Fig. 3,
see Sect. 2.3) are rather soft, spanning the range from -0.470.14 to 0.150.11
while for the other X-ray sources (bottom panel in Fig. 3) HR spans a wider
range; the vast majority of these X-ray sources have a HR value higher than that
of IC 2391 members.
| Source | Name | Ra | Dec | Exposure | Rate Err. | Significance | HR | |
|---|---|---|---|---|---|---|---|---|
| VXR (CTIO) | (J2000) | (J2000) | [ks] | [cnt/ks] | ||||
| 1 | 08:40:06.686 | -53:01:33.56 | 18.96 | 6.02 1.39 | 6.93 | 0.95 0.31 | ||
| 2 | 19 | 08:40:37.416 | -53:07:44.08 | 21.56 | 3.54 0.74 | 5.69 | -0.40 0.19 | |
| 3 | 08:40:42.883 | -52:58:25.75 | 45.63 | 1.11 0.28 | 5.74 | |||
| 4 | 08:40:43.087 | -52:49:03.25 | 19.60 | 35.09 26.16 | 29.86 | -0.40 0.12 | ||
| 5 | 08:40:44.654 | -52:58:37.85 | 33.49 | 20.50 1.41 | 36.12 | 0.24 0.10 | ||
| 6 | 08:40:47.196 | -53:08:30.91 | 19.74 | 2.26 0.63 | 5.43 | |||
| 7 | 08:40:49.128 | -52:53:02.98 | 39.78 | 2.57 0.47 | 7.73 | |||
| 8 | 08:40:49.570 | -52:56:51.94 | 41.28 | 1.51 0.34 | 5.69 | |||
| 9 | 08:40:49.805 | -53:07:40.80 | 27.50 | 1.92 0.47 | 5.52 | -0.83 0.27 | ||
| 10 | 08:40:51.955 | -53:01:59.59 | 47.06 | 5.26 0.48 | 20.74 | 0.80 0.15 | ||
| 11 | 08:40:55.925 | -52:56:11.58 | 50.32 | 1.89 0.37 | 6.54 | |||
| 12 | 08:40:56.256 | -53:03:07.63 | 56.21 | 1.17 0.25 | 5.84 | |||
| 13 | 08:40:59.563 | -52:57:57.13 | 58.43 | 5.17 0.47 | 17.30 | 0.40 0.12 | ||
| 14 | 08:41:02.839 | -52:59:49.78 | 64.05 | 1.00 0.22 | 5.66 | |||
| 15 | 24A | 08:41:04.992 | -52:51:28.69 | 43.48 | 9.81 0.70 | 23.59 | -0.350.10 | |
| 16 | 28B | 08:41:07.978 | -53:00:03.82 | 69.10 | 3.95 0.35 | 19.37 | 0.05 0.09 | |
| 17 | 29 | 08:41:09.427 | -53:02:12.98 | 68.87 | 9.01 0.50 | 34.78 | -0.01 0.05 | |
| 18 | 08:41:09.660 | -52:48:39.13 | 30.10 | 3.35 0.67 | 5.87 | |||
| 19 | 30 | 08:41:10.140 | -52:54:10.55 | 58.37 | 23.82 0.89 | 51.01 | -0.15 0.04 | |
| 20 | 08:41:11.722 | -52:51:24.30 | 47.84 | 3.15 0.54 | 6.47 | |||
| 21 | 32C-H (96) | 08:41:12.269 | -53:09:09.90 | 51.11 | 2.82 0.42 | 9.34 | -0.25 0.18 | |
| 22 | 08:41:19.567 | -53:05:29.76 | 70.55 | 1.38 0.28 | 6.24 | |||
| 23 | 08:41:19.970 | -52:58:48.65 | 56.02 | 1.05 0.29 | 5.69 | |||
| 24 | 08:41:21.065 | -53:01:16.36 | 81.78 | 1.37 0.24 | 7.79 | 1.00 0.42 | ||
| 25 | 33A | 08:41:22.248 | -53:04:46.38 | 75.54 | 3.97 0.33 | 20.28 | -0.33 0.09 | |
| 26 | 08:41:22.901 | -52:56:46.93 | 60.85 | 7.23 0.60 | 24.21 | 0.63 0.22 | ||
| 27 | 08:41:25.481 | -52:57:44.21 | 85.43 | 1.83 0.26 | 9.43 | -0.04 0.10 | ||
| 28 | 08:41:27.254 | -53:02:59.64 | 88.39 | 0.98 0.16 | 9.26 | 0.65 0.20 | ||
| 29 | 08:41:28.474 | -53:13:55.92 | 9.65 | 18.70 21.07 | 16.50 | |||
| 30 | 08:41:31.570 | -52:58:29.21 | 94.72 | 2.94 0.25 | 20.28 | 1.00 0.20 | ||
| 31 | 08:41:33.950 | -53:10:22.37 | 55.84 | 2.43 0.38 | 8.43 | -0.21 0.16 | ||
| 32 | (100) | 08:41:35.782 | -53:09:26.53 | 60.82 | 2.70 0.36 | 12.24 | 0.15 0.11 | |
| 33 | 08:41:36.178 | -53:06:56.34 | 76.26 | 2.5 0.27 | 15.14 | 0.90 0.21 | ||
| 34 | 37 | 08:41:38.964 | -53:09:24.23 | 62.42 | 22.2 0.85 | 49.69 | 0.09 0.04 | |
| 35 | 38 | 08:41:39.686 | -52:59:33.94 | 105.21 | 79.09 1.15 | 172.24 | 0.04 0.02 | |
| 36 | 08:41:40.786 | -53:07:22.22 | 74.24 | 1.97 0.28 | 9.54 | 0.85 0.23 | ||
| 37 | 08:41:41.486 | -53:00:35.03 | 105.09 | 2.10 0.21 | 15.89 | |||
| 38 | (103) | 08:41:43.810 | -53:14:04.49 | 40.85 | 1.52 0.37 | 5.69 | ||
| 39 | 08:41:45.245 | -52:58:48.79 | 107.08 | 0.78 0.13 | 9.45 | 0.48 0.16 | ||
| 40 | 08:41:45.986 | -53:00:51.84 | 104.14 | 0.56 0.12 | 5.31 | |||
| 41 | 08:41:46.090 | -53:01:45.30 | 108.57 | 0.75 0.12 | 9.65 | 0.21 0.17 | ||
| 42 | 08:41:48.979 | -52:55:20.10 | 89.98 | 4.92 0.32 | 28.72 | 0.81 0.13 | ||
| 43 | 08:41:50.400 | -52:57:22.36 | 103.15 | 4.52 0.28 | 29.53 | 1.00 0.20 | ||
| 44 | 08:41:51.418 | -52:49:07.54 | 50.00 | 7.43 0.59 | 20.03 | -0.06 0.08 | ||
| 45 | 40 | 08:41:54.137 | -52:57:57.64 | 82.32 | 8.54 0.54 | 35.87 | -0.35 0.09 | |
| 46 | 41 | 08:41:57.898 | -52:52:14.63 | 69.59 | 58.83 1.23 | 111.92 | -0.06 0.02 | |
| 47 | 08:41:58.219 | -52:51:32.08 | 65.01 | 1.48 0.26 | 8.58 | |||
| 48 | 08:41:58.788 | -52:47:13.16 | 27.20 | 4.73 1.89 | 11.76 | |||
| 49 | 08:41:58.838 | -53:05:02.98 | 98.14 | 0.66 0.13 | 7.05 | 1.00 0.31 | ||
| 50 | (106) | 08:41:59.086 | -53:12:38.52 | 48.86 | 2.00 0.40 | 6.47 | ||
| 51 | 08:41:59.834 | -52:59:53.95 | 113.39 | 1.42 0.17 | 12.53 | 0.76 0.17 | ||
| 52 | 08:42:00.722 | -53:06:04.57 | 68.53 | 1.29 0.29 | 5.85 | |||
| 53 | 08:42:01.022 | -52:53:01.82 | 73.02 | 1.27 0.22 | 7.99 | |||
| 54 | 08:42:04.346 | -53:09:38.05 | 65.78 | 0.63 0.17 | 5.28 | |||
| 55 | 42 (108) | 08:42:05.261 | -52:53:55.36 | 48.28 | 11.00 0.82 | 27.74 | ||
| 56 | 08:42:07.332 | -52:57:52.45 | 107.53 | 2.10 0.22 | 13.85 | -0.03 0.09 | ||
| 57 | 08:42:07.920 | -53:11:06.25 | 45.73 | 1.27 0.26 | 7.04 | 1.00 0.17 | ||
| 58 | 08:42:08.378 | -53:02:44.81 | 108.9 | 1.22 0.23 | 5.93 | |||
| 59 | 08:42:11.431 | -53:08:01.90 | 75.35 | 2.78 0.32 | 12.63 | 0.70 0.17 | ||
| 60 | 44+L33 | 08:42:12.302 | -53:06:04.68 | 90.68 | 142 1.70 | 212.75 | -0.04 0.01 | |
| 61 | 08:42:12.418 | -52:54:16.85 | 83.38 | 0.82 0.17 | 5.86 | |||
| 62 | 08:42:13.102 | -52:57:50.04 | 105.31 | 0.57 0.11 | 7.41 | |||
| 63 | 45 | 08:42:14.779 | -52:56:02.40 | 94.06 | 143.35 1.63 | 226.53 | 0.01 0.01 | |
| 64 | 47 | 08:42:18.514 | -53:01:58.51 | 107.73 | 51.98 0.93 | 138.66 | -0.07 0.02 | |
| 65 | 08:42:18.898 | -52:51:54.65 | 64.79 | 2.14 0.28 | 11.23 | |||
| 66 | 46 | 08:42:19.068 | -53:06:00.68 | 88.64 | 11.50 0.50 | 47.78 | -0.07 0.05 | |
| 67 | 08:42:19.687 | -52:50:09.71 | 55.14 | 1.70 0.28 | 8.48 | -0.59 0.22 | ||
| 68 | 08:42:22.066 | -53:04:21.76 | 96.30 | 1.94 0.22 | 14.37 | |||
| 69 | 08:42:23.047 | -52:48:52.42 | 35.06 | 1.43 0.40 | 6.21 | |||
| 70 | 08:42:23.652 | -53:10:25.75 | 58.28 | 1.25 0.26 | 6.28 | |||
| 71 | 08:42:23.854 | -53:01:46.70 | 103.46 | 1.95 0.21 | 14.79 | |||
| 72 | 08:42:28.294 | -52:51:18.58 | 58.08 | 2.68 0.43 | 7.42 | 0.47 0.22 | ||
| 73 | 08:42:30.564 | -53:03:40.36 | 63.19 | 2.36 0.73 | 10.72 | |||
| 74 | 49 | 08:42:30.811 | -52:57:31.50 | 91.91 | 28.01 0.74 | 81.05 | -0.09 0.03 | |
| 75 | 08:42:37.176 | -52:49:50.09 | 38.30 | 1.01 0.35 | 5.70 | |||
| 76 | 08:42:37.349 | -52:57:26.24 | 85.90 | 8.49 0.43 | 38.53 | 0.74 0.09 | ||
| 77 | 08:42:37.819 | -52:56:25.04 | 81.26 | 0.71 0.15 | 6.43 | |||
| 78 | 08:42:38.311 | -53:03:29.92 | 77.39 | 1.63 0.31 | 6.06 | |||
| 79 | 08:42:39.595 | -53:05:39.30 | 76.26 | 4.79 0.36 | 23.98 | 0.22 0.07 | ||
| 80 | 08:42:44.196 | -53:10:41.09 | 49.14 | 2.69 0.52 | 6.30 | 0.05 0.24 |
| Source | Name | Ra | Dec | Exposure | Rate Err. | Significance | HR | |
|---|---|---|---|---|---|---|---|---|
| VXR | (J2000) | (J2000) | [ks] | [cnt/ks] | ||||
| 81 | 08:42:45.293 | -52:55:15.89 | 69.40 | 3.69 0.42 | 11.02 | 0.58 0.17 | ||
| 82 | 52 | 08:42:46.601 | -53:01:01.96 | 81.31 | 67.59 1.24 | 128.9 | -0.03 0.02 | |
| 83 | 08:42:47.004 | -52:56:24.40 | 73.08 | 0.99 0.21 | 6.68 | |||
| 84 | 08:42:47.664 | -53:09:22.39 | 54.97 | 1.47 0.29 | 7.25 | |||
| 85 | 08:42:48.245 | -53:03:21.96 | 75.03 | 2.85 0.39 | 9.10 | -0.29 0.12 | ||
| 86 | 53 (126) | 08:42:49.085 | -52:52:17.65 | 55.14 | 4.27 0.45 | 13.5 | -0.47 0.14 | |
| 87 | 08:42:49.565 | -53:07:02.42 | 61.99 | 1.18 0.27 | 5.36 | |||
| 88 | 08:42:50.690 | -52:49:57.94 | 19.78 | 3.27 0.74 | 7.12 | |||
| 89 | 08:42:54.653 | -53:00:49.61 | 73.31 | 1.49 0.27 | 6.75 | |||
| 90 | 08:42:55.807 | -52:55:22.30 | 56.28 | 3.8 0.38 | 17.13 | 1.00 0.23 | ||
| 91 | 08:42:56.861 | -52:51:09.25 | 34.51 | 1.25 0.37 | 6.01 | |||
| 92 | 55 | 08:42:57.497 | -53:08:54.56 | 40.51 | 3.5 0.70 | 9.59 | ||
| 93 | 08:42:58.764 | -53:05:55.03 | 61.41 | 6.89 0.49 | 25.14 | -0.13 0.06 | ||
| 94 | 08:43:03.564 | -52:56:13.67 | 36.15 | 2.36 0.53 | 6.76 | |||
| 95 | 56 | 08:43:03.571 | -53:04:41.74 | 53.81 | 50.91 1.37 | 82.85 | -0.03 0.03 | |
| 96 | 08:43:07.279 | -53:01:51.35 | 57.99 | 1.36 0.27 | 7.25 | -0.07 0.14 | ||
| 97 | 08:43:11.659 | -53:04:13.33 | 44.89 | 2.41 0.4 | 10.03 | 0.30 0.18 | ||
| 98 | 08:43:13.826 | -52:56:19.18 | 49.72 | 2.15 0.40 | 7.34 | 0.50 0.24 | ||
| 99 | 08:43:19.913 | -53:05:34.33 | 20.34 | 3.57 0.75 | 7.37 |
| Name | Flag | Source | Raott | Decott | V | B-V | R-I | V-I | Rate | K-S | logLx | ||
|---|---|---|---|---|---|---|---|---|---|---|---|---|---|
| (J2000) | (J2000) | (I) | [cnt/ks] | [erg/s] | |||||||||
| L06 | 08:40:17.501 | -53:00:55.69 | 5.57 | -0.13 | 2.11 | 28.44 | |||||||
| VXR19 | ? | 2 | 08:40:36.800 | -53:07:51.00 | 17.01 | 1.56 | 2.77 | 3.54 | 90% | 28.66 | |||
| VXR24A | ? | 15 | 08:41:04.100 | -52:51:44.00 | 15.85 | 1.45 | 2.58 | 9.81 | 29.10 | ||||
| VXR28B | ? | 16 | 08:41:08.000 | -53:00:08.00 | 17.75 | 1.65 | 2.94 | 3.95 | 28.71 | ||||
| VXR29 | ? | 17 | 08:41:09.400 | -53:02:1:00 | 17.40 | 1.71 | 3.07 | 9.01 | 29.07 | ||||
| VXR30 | * | 19 | 08:41:09.998 | -52:54:11.24 | 9.83 | 0.49 | 23.82 | 29.49 | |||||
| VXR32Ca | ? | 21 | 08:41:11.400 | -53:09:16.00 | 15.34 | 0.99 | 2.05 | 2.82 | 28.08 | ||||
| VXR32Ha | ? | 21 | 08:41:11.400 | -53:09:16.00 | 19.64 | 1.91 | 3.50 | 2.82 | 28.08 | ||||
| CTIO 096a | 21 | 08:41:12.370 | -53:09:10.30 | (16.14) | 1.91 | 2.82 | 28.08 | ||||||
| H21 | 08:41:16.314 | -53:04:26.66 | 11.69 | 0.82 | 0.76 | 27.99 | |||||||
| VXR33A | ? | 25 | 08:41:22.300 | -53:04:55.00 | 16.93 | 1.64 | 2.91 | 3.97 | 28.71 | ||||
| CTIO 100b | 32 | 08:41:35.960 | -53:09:27.10 | 18.46 | 1.80 | 2.70 | 28.54 | ||||||
| VXR37 | *? | 34 | 08:41:38.500 | -53:09:35.00 | 17.10 | 1.66 | 2.87 | 22.20 | 29.46 | ||||
| VXR38 | * | 35 | 08:41:39.800 | -52:59:36.00 | 13.38 | 1.25 | 0.77 | 1.54 | 79.09 | 30.01 | |||
| CTIO 103 | 38 | 08:41:43.960 | -53:14:07.00 | 17.74 | 1.72 | 1.52 | 28.29 | ||||||
| L15 | 08:41:46.574 | -53:03:45.37 | 7.59 | 0.27 | 0.52 | 27.83 | |||||||
| SHJM7a | 08:41:52.000 | -53:06:47.00 | 12.52 | 1.10 | 0.58 | 1.21 | 0.69 | 27.95 | |||||
| VXR40 | ? | 45 | 08:41:53.700 | -52:58:07.00 | 17.14 | 1.62 | 2.86 | 8.54 | 29.04 | ||||
| VXR41 | * | 46 | 08:41:57.900 | -52:52:16.00 | 13.48 | 1.25 | 0.72 | 1.46 | 58.83 | 29.88 | |||
| CTIO 106 | 50 | 08:41:58.930 | -53:12:36.30 | (16.45) | 1.98 | 2.00 | 27.93 | ||||||
| CTIO 106 | 50 | 08:41:58.930 | -53:12:36.30 | (16.45) | 1.98 | 2.00 | 27.93 | ||||||
| CTIO 106 | 50 | 08:41:58.990 | -53:12:36.90 | (16.56) | 2.01 | 2.00 | 27.93 | ||||||
| CTIO 108 | 55 | 08:42:04.910 | -52:53:54.10 | (13.32) | 1.41 | 11.00 | 28.85 | ||||||
| VXR42 | ? | 55 | 08:42:05.300 | -52:54:00.00 | 15.88 | 1.37 | 2.49 | 11.00 | 28.85 | ||||
| L24 | 08:42:07.984 | -53:09:35.15 | 8.60 | 0.15 | 0.84 | 28.04 | |||||||
| L13 | 08:42:09.955 | -52:58:03.99 | 7.39 | 0.02 | 0.55 | 27.85 | |||||||
| VXR44 | *? | 60 | 08:42:12.000 | -53:06:12.00 | 9.69 | 0.42 | 142.00 | 29.96 | |||||
| L33 | 60 | 08:42:12.331 | -53:06:04.50 | 9.59 | 0.44 | 142.00 | 29.96 | ||||||
| VXR45 | *? | 63 | 08:42:14.500 | -52:56:12.00 | 10.70 | 0.81 | 0.44 | 0.90 | 143.35 | 30.27 | |||
| VXR46 | * | 66 | 08:42:19.027 | -53:06:00.45 | 5.52 | -0.15 | 11.50 | 29.17 | |||||
| VXR47 | * | 64 | 08:42:18.400 | -53:01:57.00 | 14.00 | 1.44 | 1.10 | 2.03 | 51.98 | 29.72 | |||
| CTIO 114a | 08:42:21.560 | -52:53:38.90 | (12.51) | 0.85 | 0.68 | 27.94 | |||||||
| VXR48 | 08:42:25.426 | -53:06:50.49 | 4.84 | -0.17 | 0.75 | 27.99 | |||||||
| VXR49Bb | *? | 74 | 08:42:29.700 | -52:57:43.00 | 14.34 | 0.96 | 1.89 | 28.01 | 29.56 | ||||
| VXR52 | * | 82 | 08:42:46.640 | -53:01:01.84 | 10.34 | 0.57 | 0.23 | 0.44 | 67.59 | 29.94 | |||
| VXR53 | ? | 86 | 08:42:48.700 | -52:52:18.00 | 17.61 | 1.79 | 3.22 | 4.27 | 28.44 | ||||
| CTIO 126 | 86 | 08:42:49.050 | -52:52:15.90 | (14.39) | 1.80 | 4.27 | 28.44 | ||||||
| H36 | 08:42:50.108 | -53:02:01.96 | 11.31 | 0.64 | 0.84 | 28.04 | |||||||
| VXR55 | ? | 92 | 08:42:57.900 | -53:06:04.00 | 16.29 | 1.58 | 2.82 | 6.89 | 28.95 | ||||
| CTIO 130b | # | 08:42:58.210 | -52:49:46.20 | (17.23) | 2.03 | 1.99 | 28.41 | ||||||
| VXR56 | * | 95 | 08:43:03.464 | -53:04:41.36 | 7.68 | 0.10 | 50.91 | 29.82 | |||||
| CTIO 136 | 08:43:15.140 | -52:58:23.00 | 19.72 | 1.98 | 1.08 | 28.15 |
a These stars have R-I inconsistent with cluster membership (see Fig. 6).
b Stars having (J-K), J values incompatible with the cluster main sequence.

2.3 Cluster members and identifications
We have collected an optical catalog of cluster members based on
the Prosser & Stauffer Open Cluster Database project
222available at http://www.noao.edu/noao/staff/cprosser, and the
Barrado y Navascués et al. (2001) catalog for the faintest stars.
Our final list contains 172 likely members with spectral types ranging from B to M.
The EPIC field of view, shown in Fig. 2, contains 42 out of the 172
members of the cluster with spectral type from B to M.
We have cross-identified the X-ray sources with the optical catalog,
in two steps; in the first step we found a systematic offset between X-ray
source positions and membership catalog of 1.02 in RA and 1.23
in Dec; in the second step, we corrected the X-ray positions for this systematic
offset, before matching the X-ray and optical member positions, and retained
an identification if the offset between X-ray and optical positions was less
than 14.
The choice of such a limiting distance is a good compromise between the attempt
to minimize the number of spurious identifications (whose expected number for an offset
14 is 0.76) and to keep the largest number of bona-fide
optical counterparts.
We have found 24 X-ray sources identified with 31 possible or probable members; in particular we have detected about 30% of type B and A, 100% of F, 87% of G-K and 87% of M member stars in the FOV. In five cases it has been impossible to resolve very close stars, owing to the limited spatial resolution of the X-ray telescope. For these unresolved sources, the X-ray flux has been divided evenly between the optical candidates in the absence of further information.
We have also obtained upper limits to count rates at the optical positions of undetected cluster members. Table 2 summarizes the optical and X-ray characteristics of the possible and probable members of the cluster.
We have also searched optical counterparts of the 75 X-ray sources not identified with known members of the cluster. Using the 2MASS All-Sky Catalog of Point Sources (Cutri et al. 2003) with a match radius of 14, we found that 64 out of 75 X-ray sources have counterparts in the 2MASS catalog. Among these 64 sources, 9 have infrared photometry consistent with the cluster sequence (see Table LABEL:JHK); for 4 out of these 9 sources it has been possible to compute a reliable HR and in 3 case the values indicate a quite soft spectrum, with an HR in the same range as that of the IC 2391 members. The positions of the stars CTIO 100, CTIO 130 and VXR49B (which have been reported as members or probable members in the IC 2391 optical catalogues) in the (J-K), J color-magnitude diagram, are inconsistent with the cluster main sequence, making their membership doubtful.
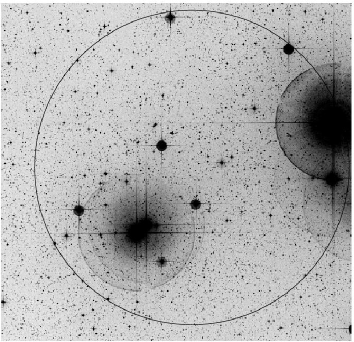
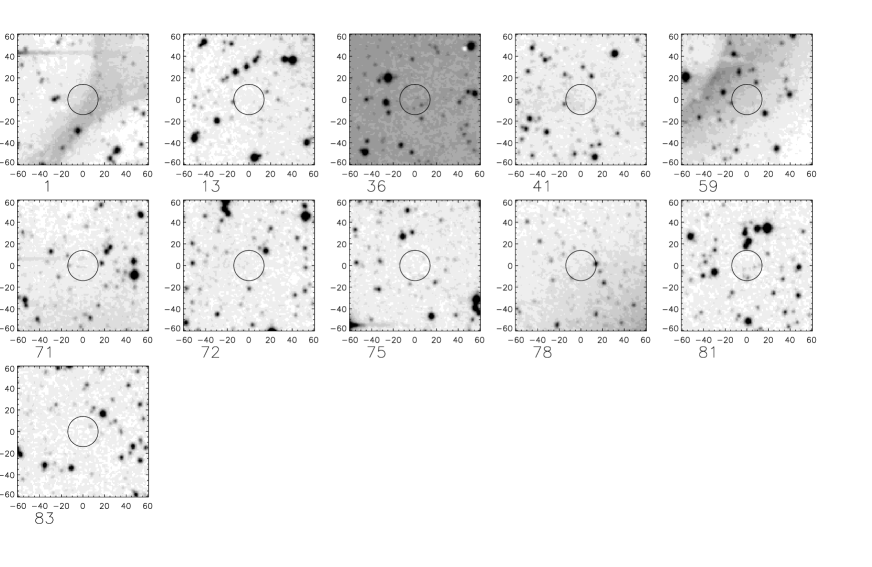
Eleven X-ray sources have no catalogued counterpart. A search on the STScI Digitised Sky Survey (DSS) shows that most of these sources have faint counterparts. Fig. 4 shows the IR DSS finding charts for these 11 sources.
| Source | Flag | J | H | K |
|---|---|---|---|---|
| 11 | 13.039 | 12.349 | 12.157 | |
| 18 | 13.524 | 12.904 | 12.646 | |
| 20 | 14.955 | 14.344 | 13.987 | |
| 23 | 14.143 | 13.583 | 13.235 | |
| 39 | N | 14.767 | 13.999 | 13.845 |
| 44 | Y | 13.717 | 13.128 | 12.869 |
| 85 | Y | 13.587 | 12.989 | 12.677 |
| 93 | Y | 12.010 | 11.384 | 11.128 |
| 99 | 14.560 | 13.901 | 13.612 |
2.4 Analysis of IC 2391 X-ray sources
For the eleven X-ray sources of the cluster with sufficient signal to noise (i.e. more than 500 counts in the EPIC/pn detection), we have performed spectral analysis by using primarily data from EPIC/pn, which collected typically a factor 1.9 more counts-per-source than a single MOS, thanks to its higher sensitivity. Source and background regions were selected interactively using the Astronomical Data Visualization DS9 display software, with the background regions extracted on the same chip and at the same off-axis angle of the source region. We have taken into account the shape of the Point Spread Function (PSF) to choose the radius of the circle within which to collect source counts. The shape of the PSF is quite complex but the radially averaged profile can be suitably represented by an analytical function described by Ghizzardi (2001) and Saxon (2002). Given that the encircled energy fraction is only weakly dependent on the off-axis angle we have adopted a constant extraction radius of 45 for all sources, and corrected for the lost photon counts with the proper fraction derived from the . In some cases we have used a smaller radius to exclude contributions from nearby stars and have changed the correction accordingly.
3 Spectral analysis
For the eleven sources with enough count statistics we have extracted spectra
of the single and double events with energy in the 0.3 - 3.5 keV band.
We have adopted this selection, since at higher energies the background
contribution is dominant while the source counts are very few.
We have computed the photon redistribution matrix using the SAS task
rmfgen and the ancillary response files using the SAS task arfgen.
Finally, spectra have been rebinned in order to have at least 25 counts per
spectral bin.
We have performed a spectral analysis based on global fitting, using the APEC
model spectra (Smith et al. 2001) implemented in the XSPEC software, in order to
obtain the relevant temperature components and relative Emission Measure (EM)
values.
The X-ray emission from stellar coronae is expected to be a superposition of spectra of many individual loops of hot plasma at different temperatures. This implies that the form of the differential emission measure as a function of temperature may be complex. Furthermore, chemical abundances may differ from the solar one. We have approximated the differential emission measure with one or more (in fact at most two) isothermal components and estimated the abundances parameter, Z, in which the abundances of individual elements are fixed to the ratios observed in the solar photosphere. Only in one case (VXR52) did we find that a model allowing abundances of Fe, O, and Mg to vary is needed to improve the fit (see Table 4). We show the spectra of the brightest stars in Fig. 5 and report the best-fit parameters in Table 4.
In all cases the hydrogen column density NH is consistent with the photometric
derived value, 3.2 1019 cm-2, computed from the average B-V color
excess EB-V=0.006 0.005 (Patten & Simon 1996).
The 2-T model fits result in the emission measure ratios, EM2/EM1, being
greater than 1, indicating the presence of significant hot components.
We note an increase of the coronal temperature from F to M stars,
as shown in Table 4.
In the Pleiades stars, using PSPC data, Gagné et al. (1995) have found a dependence
of fitted coronal temperature on spectral type and rotation, with fast G
rotators hotter than the other late-type stars, and F stars softer than all
the others. We have not enough spectra to test if this is also the case for IC 2391.
Briggs & Pye (2003), analysing XMM-Newton data, found an increase of temperature
with spectral type (from F to K) in the Pleiades; this is similar to the trend we see
in IC 2391.
Our spectra are systematically fitted with ”depleted” abundances with respect to the solar ones. In particular, we found Z 0.1-0.2 Z⊙ for K-stars and M-stars, 0.3 Z⊙ for the G-star VXR45 and 0.5 Z⊙ for the F-stars. Indications of subsolar abundances with a similar trend of Z with spectral type have been found for the Pleiades by Briggs & Pye (2003).
| Name | Source | Sp. | PN | kT1 | kT2 | Z/Z⊙ | log EM1 | log EM2 | (dof) P( |
|---|---|---|---|---|---|---|---|---|---|
| VXR | type | Counts | [keV] | [keV] | [cm-3] | [cm-3] | |||
| 46 | 66 | B8.5IV | 601 | 0.69 (0.61-0.76) | 0.10 (0.07-0.16) | 52.46 (52.35-52.55) | 0.93 (23) 0.55 | ||
| 56 | 95 | A1IV | 1329 | 0.80 (0.74-0.85) | 0.10 (0.07-0.12) | 52.94 (52.89-52.99) | 0.87(49) 0.72 | ||
| 30 | 19 | F6V | 566 | 0.60 (0.56-0.64) | 0.57 (0.52-0.63) | 52.18 (52.14-52.21) | 0.96 (31) 0.55 | ||
| 44+L33 | 60 | F6V | 5911 | 0.65 (0.63-0.66) | 0.52 (0.44-0.62) | 52.98 (52.91-53.03) | 1.44 (130) 8.17e-4 | ||
| 52 | 82 | F9 | 2249 | 0.59 (0.56-0.61) | 0.38a (0.32-0.46) | 52.72 (52.67-52.77) | 1.06 (63) 0.35 | ||
| 45 | 63 | G9 | 5794 | 0.52 (0.46-0.61) | 0.99 (0.94-1.03) | 0.27 (0.23-0.34) | 52.79 (52.71-52.85) | 52.96 (52.91-52.99) | 0.96 (156) 0.62 |
| 38 | 35 | K7.5e | 2796 | 0.40 (0.34-0.66) | 1.21 (1.06-1.27) | 0.18 (0.10-0.19) | 52.47 (52.33- 52.56) | 52.77 (52.73-52.78) | 0.96 (90) 0.59 |
| 41 | 46 | K7.5e | 1800 | 0.32 (0.27-0.38) | 1.01 (0.95-1.07) | 0.22 (0.17-0.29) | 52.51 (52.47-52.57) | 52.78 (52.75-52.80) | 1.03(56) 0.42 |
| 37 | 34 | M | 652 | 1.00 (0.81-1.05) | 0.10 (0.06-0.15) | 52.67 (52.64-52.76) | 1.09 (19) 0.36 | ||
| 49 | 74 | M1e | 923 | 0.75 (0.69-0.80) | 0.11 (0.08-0.15) | 52.59 (52.52-52.66) | 1.17 (25) 0.25 | ||
| 47 | 64 | M2e | 2244 | 0.37 (0.33-0.41) | 1.17 (1.04-1.26) | 0.20 (0.13-0.30) | 52.57 (52.53-52.60) | 52.60 (52.52-52.63) | 1.03 (74) 0.41 |
a: for VXR52 the model is 1-T VAPEC, Z/Z⊙ refers to Fe abundance,
Mg abundance is 0.28 (0.02-0.54), O abundance is 0.15 (0.05-0.26).


In general, although the obtained fits are statistically
acceptable, some spectral features are not well reproduced.
An inspection of the spectra (Fig. 5) shows that some line
features (e.g. at 0.6 keV and 1 keV) appear to be
not well reproduced by model fits.
Furthermore, we have been unable to fit the data of the two F6
stars, VXR44 and L33, unresolved in the EPIC image.
The attempts to fit this spectrum by adding further temperature
components, fixing the global chemical abundances and hydrogen
column density or allowing them to vary, did not improve the fit.
The stellar structure models predict that stars earlier than A7
lack of, or have very thin, convective zones (required to generate
magnetic activity), and hence lack one key ingredient for an
- dynamo. Therefore one expects no X-ray emission
from these stars. For the binary systems unresolved in the X-ray band
the emission is usually attributed to late companions.
This could be the case for two stars of IC 2391: VXR46,
a B8.5 spectral type star flagged as single star by Patten & Simon (1996), but that
could have a faint unknown companion, and VXR56, an A1 star flagged as
spectroscopic binary (Patten & Simon 1996).
The X-ray spectra of both VXR46 and VXR56 are fitted with a 1-T, low Z model,
quite similar to the best-fit model for the X-ray spectra of M-type members,
such as VXR37 and VXR49. Hence the X-ray emission of VXR46 and
VXR56 is consistent with arising from a K or M late-type companion.
Our finding for IC 2391 (at an age of 30 Myr) are compatible
with the Chandra results for the Pleiades, suggesting that
late B and A stars are not strong intrinsic X-ray sources (Daniel et al. 2002).
A recent analysis of two early-type stars in the star-forming region Cha I,
observed with XMM-Newton (Stelzer et al. 2004), indicates a more complex behavior:
one star (a Herbig Ae/Be) has X-ray properties indistinguishable from
lower-mass young stars while the other A-type star is particularly soft,
a characteristic expected for a wind-driven source.
Note that, on the basis of ROSAT data, Panzera et al. (1999) have also found that dF X-ray spectra are softer than those of later-type stars. Furthermore the ACIS observations of NGC 2516 (Micela 2001) and the EPIC observations of the Pleiades (Briggs & Pye 2003) and Blanco 1 (Pillitteri et al. 2004b) show that the X-ray spectra of dF stars tend to be softer than those of star of other spectral types. It is intriguing that this different behaviour occurs for stars over a wide range of ages. The low coronal temperature of dF stars implies that these stars are unable to sustain hot coronae as the cooler stars do, suggesting a different efficiency of the coronal heating mechanism responsible for the X-ray emission. This could be related to, and is a tracer of, the reduced efficiency of the dynamo owing to the convection zone becoming shallower at early F spectral type.
3.1 Flux and Luminosity determination
In order to convert the count rates to flux for cluster members detected with limited statistics, we have adopted a MOS constant conversion factor of 4.11 erg cm-2/count, obtained assuming that all cluster members have similar spectra. In order to compute its value, we derived first the pn conversion factor from count rates to flux as the mean of the ratio for the stars for which we have performed a detailed spectral analysis. The estimated overall uncertainty of the pn conversion factor due to the intrinsic spread observed in the sample stars is of the order of 15%. Considering that, for our sources, with EPIC/pn we collect about 1.9 more photons counts than with each MOS, we derived the MOS conversion factor appropriate for the source rate in the summed dataset. The X-ray luminosity in the 0.3-3.5 keV band, assuming a cluster distance of 162 pc, is given in col. 11 of Table 2.

Fig. 6 shows X-ray luminosity versus R-I color index for all IC 2391 members for which R-I is known. Most of the cluster stars emit at the saturation level of Lx/L (dashed line in the plot). We note that two stars (VXR37 and VXR47) yield a ratio above this level, likely because they have been observed during a flare (see Sect. 4), while the two stars SHJM7, CTIO 114 (for which we have only upper limits for the X-ray emission), and the VXR32C+VXR32H+CTIO 96 system are inconsistent with cluster membership. Indeed SHJM7 is reported as a possible cluster member by Stauffer et al. (1989) and as a probable background object by Patten & Simon (1996). CTIO 114 is also a probable field star. For the VXR32C+VXR32H+CTIO 96 system, we equally divided the Lx among the three stars since XMM-Newton cannot separate them; however, it is possible that VXR32C is not a cluster member and therefore most of the emission is due to VXR32H and CTIO 96.
4 Timing analysis
We have obtained light-curves in the (0.3-7.8) keV bandpass of the pn detected sources. Source and background light-curves were extracted from regions described in Sect. 2.4. In Fig. 7 we show source (top) and background (bottom) light-curves for bright pn detected cluster members. We clearly observe flare-like variations (e.g. on the dM stars VXR37, VXR49), but also short-term variability superimposed on more complex variations (VXR38, VXR46, VXR52). The count rate of VXR49 decreases by a factor 3 in about 20 ksec; this behaviour can be interpreted as the decay of a long-lasting flare followed by a short-lasting flare. Similarly, a first flare followed by a secondary bump triggered by the main event has been observed on four stars of the Blanco 1 open cluster by Pillitteri et al. (2004a). By analysing in detail two of these events on a dG9 star, these authors interpret the light-curve in terms of a loop arcade ignited in sequence with heating during the decays of both flares. See also the detailed modeling of a large flare on Prox Cen (Reale et al. 2004).
Thanks to the quasi-continuous time coverage, we have unambiguously detected X-ray rotational modulation in VXR45, a fast rotating star (P 19 ksec) in the supersaturated regime (Marino et al. 2003a). The FOV includes also the fast rotating member VXR47, a M2 star with a short photometric period of 22 ksec and v sin i 95 km/s (Stauffer et al. 1989). As shown in Fig. 7, the VXR47 light-curve suggests the presence of rotational modulation. In order to confirm that the X-ray emission may be due to rotation modulation, we have folded the X-ray light-curve with the photometric period (see Fig. 8). Phase-related variability hints at some rotational modulation but with irregular variations superposed. X-ray rotational modulation could be present also in the VXR38 and VXR44+L33 light curves. In particular the light-curve of VXR38 shows a smooth modulation on a time scale of 10000 sec that is very different from the photometric period of VXR38, namely 2.7 days (Patten & Simon 1996), while for VXR44+L33 there are no photometric periods reported in the literature. The detection of rotational modulation implies the presence of non-uniformly distributed active regions on these stars. Moreover, in VXR45 no strong evidence for spectral variations in the soft and hard passbands has been found. This is consistent with the hypothesis that the modulation we observe is mainly due to a longitudinal concentration of X-ray-emitting material, and that at all times the emission is largely due to the same mixture of emitting structures. A possible scenario is that a large polar region is always present while another region at lower latitude is responsible for the observed modulation, albeit other scenarios are possible.
We applied the unbinned Kolmogorov-Smirnov (K-S) test to all the light-curves of our sample. Column 10 of Table 2 reports the results in terms of the confidence level at which we can reject the hypothesis of a constant source. A summary of K-S test results is given in Table 5 and in Fig. 9: on short-time scales approximately 46% of the sources were variable at a confidence level 99%, 25% of them are not variable (confidence level ), the remaining 29% are marginally variable (confidence level between 90% and 99%). Our results do not depend on count statistics and appear to be an intrinsic property of the IC 2391 stars.
Combining X-ray data obtained with ROSAT and XMM-Newton we can explore long-term variability of the late-type stars of IC 2391. Twenty-one stars in our sample have been observed both with ROSAT/PSPC in 1992 and XMM-Newton/EPIC in 2001, and sixteen have been observed both with ROSAT/HRI in 1994 and XMM-Newton/EPIC. In order to compare our results with the ROSAT ones, we have derived X-ray luminosities in the (0.2-2.0) keV bandpass.
The comparison of the ROSAT/PSPC luminosities and those of this paper indicates that most of the stars have variations less than a factor of two on nine-year time scales, with the exception of VXR40. This is a dM star, variable at a confidence level 99% in the PSPC observation (Patten & Simon 1996) but not variable in the EPIC observation; probably we are observing an effect due to short-term variability during the PSPC observation rather than truly long-term variability. Comparing our data with those collected with ROSAT/HRI we do not find evidence of variations on seven-year time scales, only VXR38 has varied by a factor larger than 2, but similarly to VXR40 it was variable during the EPIC observation and not in the PSPC one, so probably we are again in presence of short-term variability.
In summary we have not found evidence of long term variability and such variability does not increase by exploring longer time scales. Our finding is consistent with a scenario in which stars much younger than the Sun, i.e. at ages 1 Gyr, do not have long-term cycles or their cycle amplitudes are much smaller than the solar one. Similar indications have been found from long-term variability analysis of other young open clusters, based on ROSAT, CHANDRA and XMM-Newton observations (e.g. Gagné et al. 1995; Marino et al. 2003b; Pillitteri et al. 2004b; Stern et al. 1995). On the other hand, thanks to XMM-Newton, we now have growing evidence that cycle activity is present in other stars with ages comparable to the solar one (Favata et al. 2004). This suggest that at very young age the coronal emission does not undergo long cyclic changes, in agreement with similar results established by the Ca H-K monitoring survey (e.g. Baliunas et al. 1995).


| Confidence | Number of |
|---|---|
| level1 | identified sources |
| 99% | 11 (46%) |
| 90%-99% | 6 (29%) |
| 90% | 7 (25%) |
1Confidence level for the rejection of the constant source hypothesis.

5 Summary
We have presented the results of the analysis of an observation of the open cluster IC 2391 obtained with XMM-Newton/EPIC camera.
We have detected 31 of the 42 members or probable members of the cluster in the FOV, corresponding to 24 X-ray sources. Furthermore we have computed upper limits at the optical positions of undetected cluster members. The IC 2391 members having more than 500 pn counts have been the subject of spectral analysis. We find that a 2-T model fits the spectra of G and K type stars while a soft 1-T model describes the spectra of F-type stars. The spectra of the A1 type star VXR56 and B8.5 type-star VXR46 are consistent with the hypothesis that a later-type companion is responsible for the observed X-ray emission. We have found a rise of the coronal temperature going from F to M stars and an indication of subsolar coronal chemical abundances.
Variability on short time scales is common among IC 2391 members; the Kolmogorov-Smirnov test applied to all X-ray photon time series of detected cluster members shows that approximately 46% of the sources are variable at a confidence level greater than 99%. Furthermore, a very fast rotating star of the cluster unambiguously shows X-ray rotational modulation, while indications of rotational modulation are found in another fast rotating star and in two other stars. These findings require that in very fast rotating stars the active regions are typically far from being evenly distributed on the stellar surface.
Comparing our data with published ROSAT data, we find no evidence for long-term cyclic variability with amplitude and cycle period analogous to the solar one.
Acknowledgements.
This work is based on observations obtained by XMM-Newton, an ESA science mission with instruments and contributions directly funded by ESA Member States and the USA (NASA). We acknowledge financial support from ASI and MIUR. This research has made use of the Open Cluster Database, as provided by C.F. Prosser and J.R. Stauffer and which currently may be accessed at http://www.noao.edu/noao/staff/cprosser/, or by anonymous ftp to 140.252.1.11, cd /pub/prosser/clusters/. This publication makes use of data products from the Two Micron All Sky Survey, which is a joint project of the University of Massachusetts and the Infrared Processing and Analysis Center/California Institute of Technology, funded by the National Aeronautics and Space Administration and the National Science Foundation. We acknowledge the usage of the photographic data obtained using The UK Schmidt Telescope and the STScI digitization. We wish to thank the referee, Dr. Ramon Garcia Lopez, for his useful comments.References
- Baliunas et al. (1995) Baliunas, S. L., Donahue, R. A., Soon, W. H., et al. 1995, ApJ, 438, 269
- Barbera et al. (2002) Barbera, M., Bocchino, F., Damiani, F., et al. 2002, A&A, 387, 463
- Barrado y Navascués et al. (2001) Barrado y Navascués, D., Stauffer, J. R., Briceño, C., et al. 2001, ApJS, 134, 103
- Briggs & Pye (2003) Briggs, K. R. & Pye, J. P. 2003, MNRAS, 345, 714
- Caillault & Helfand (1985) Caillault, J.-P. & Helfand, D. J. 1985, ApJ, 289, 279
- Cutri et al. (2003) Cutri, R. M., Skrutskie, M. F., van Dyk, S., et al. 2003, VizieR Online Data Catalog, 2246, 0
- Damiani et al. (1997a) Damiani, F., Maggio, A., Micela, G., & Sciortino, S. 1997a, ApJ, 483, 350
- Damiani et al. (1997b) Damiani, F., Maggio, A., Micela, G., & Sciortino, S. 1997b, ApJ, 483, 370
- Daniel et al. (2002) Daniel, K. J., Linsky, J. L., & Gagné, M. 2002, ApJ, 578, 486
- Favata et al. (2004) Favata, F., Micela, G., Baliunas, S. L., et al. 2004, A&A, 418, L13
- Franciosini et al. (2000) Franciosini, E., Randich, S., & Pallavicini, R. 2000, A&A, 357, 139
- Gagné et al. (1995) Gagné, M., Caillault, J., & Stauffer, J. R. 1995, ApJ, 450, 217
- Ghizzardi (2001) Ghizzardi, S. 2001, ”EPIC-MCT-TN-011”, Tech. rep., EPIC Milano Calibration Team
- Jansen et al. (2001) Jansen, F., Lumb, D., Altieri, B., et al. 2001, A&A, 365, L1
- Jardine (2004) Jardine, M. 2004, A&A, 414, L5
- Jeffries et al. (1997) Jeffries, R. D., Thurston, M. R., & Pye, J. P. 1997, MNRAS, 287, 350
- Kenyon et al. (1994) Kenyon, S. J., Gomez, M., Marzke, R. O., & Hartmann, L. 1994, AJ, 108, 251
- Marino et al. (2003a) Marino, A., Micela, G., Peres, G., & Sciortino, S. 2003a, A&A, 407, L63
- Marino et al. (2003b) Marino, A., Micela, G., Peres, G., & Sciortino, S. 2003b, A&A, 406, 629
- Micela (2001) Micela, G. 2001, in ASP Conf. Ser. 234: X-ray Astronomy 2000, 143
- Micela et al. (1999) Micela, G., Sciortino, S., Harnden, F. R., et al. 1999, A&A, 341, 751
- Micela et al. (2000) Micela, G., Sciortino, S., Jeffries, R. D., Thurston, M. R., & Favata, F. 2000, A&A, 357, 909
- Micela et al. (1996) Micela, G., Sciortino, S., Kashyap, V., et al. 1996, ApJS, 102, 75
- Micela et al. (1985) Micela, G., Sciortino, S., Serio, S., et al. 1985, ApJ, 292, 172
- Micela et al. (1990) Micela, G., Sciortino, S., Vaiana, G. S., et al. 1990, ApJ, 348, 557
- Micela et al. (1988) Micela, G., Sciortino, S., Vaiana, G. S., et al. 1988, ApJ, 325, 798
- Panzera et al. (1999) Panzera, M. R., Tagliaferri, G., Pasinetti, L., & Antonello, E. 1999, A&A, 348, 161
- Patten & Simon (1993) Patten, B. M. & Simon, T. 1993, Bulletin of the American Astronomical Society, 25, 883
- Patten & Simon (1996) Patten, B. M. & Simon, T. 1996, ApJS, 106, 489
- Pillitteri et al. (2004a) Pillitteri, I., Micela, G., Reale, F., & Sciortino, S. 2004a, A&A, submitted
- Pillitteri et al. (2004b) Pillitteri, I., Micela, G., Sciortino, S., Damiani, F., & Harnden Jr., F. R. 2004b, A&A, 421, 175
- Pizzolato et al. (2003) Pizzolato, N., Maggio, A., Micela, G., Sciortino, S., & Ventura, P. 2003, A&A, 397, 147
- Prosser et al. (1996) Prosser, C. F., Randich, S., Stauffer, J. R., Schmitt, J. H. M. M., & Simon, T. 1996, AJ, 112, 1570
- Randich (1998) Randich, S. 1998, in ASP Conf. Ser. 154: Cool Stars, Stellar Systems, and the Sun, 501
- Randich et al. (1995) Randich, S., Schmitt, J. H. M. M., Prosser, C. F., & Stauffer, J. R. 1995, A&A, 300, 134
- Randich et al. (1996) Randich, S., Schmitt, J. H. M. M., Prosser, C. F., & Stauffer, J. R. 1996, A&A, 305, 785
- Reale et al. (2004) Reale, F., Güdel, M., Peres, G., & Audard, M. 2004, A&A, 416, 733
- Saxon (2002) Saxon, R. D. 2002, ”XMM-CCF-REL-116”, Tech. rep., XMM-SOC
- Sciortino et al. (2002) Sciortino, S., Damiani, F., Favata, F., Flaccomio, E., & Micela, G. 2002, in ASP Conf. Ser. 277: Stellar Coronae in the Chandra and XMM-NEWTON Era, 389
- Sciortino et al. (2000) Sciortino, S., Micela, G., Favata, F., Spagna, A., & Lattanzi, M. G. 2000, A&A, 357, 460
- Simon & Patten (1998) Simon, T. & Patten, B. M. 1998, PASP, 110, 283
- Smith et al. (2001) Smith, R. K., Brickhouse, N. S., Liedahl, D. A., & Raymond, J. C. 2001, ApJ, 556, L91
- Stauffer et al. (1989) Stauffer, J., Hartmann, L. W., Jones, B. F., & McNamara, B. R. 1989, ApJ, 342, 285
- Stauffer et al. (1994) Stauffer, J. R., Caillault, J.-P., Gagne, M., Prosser, C. F., & Hartmann, L. W. 1994, ApJS, 91, 625
- Stelzer et al. (2004) Stelzer, B., Micela, G., & Neuhäuser, R. 2004, A&A, 423, 1029
- Stern et al. (1995) Stern, R. A., Schmitt, J. H. M. M., & Kahabka, P. T. 1995, ApJ, 448, 683
- Stern et al. (1981) Stern, R. A., Zolcinski, M. C., Antiochos, S. K., & Underwood, J. H. 1981, ApJ, 249, 647
- Strüder et al. (2001) Strüder, L., Briel, U., Dennerl, K., et al. 2001, A&A, 365, L18
- Turner et al. (2001) Turner, M. J. L., Abbey, A., Arnaud, M., et al. 2001, A&A, 365, L27
- Vilhu (1984) Vilhu, O. 1984, A&A, 133, 117