An ISOCAM survey through gravitationally lensing galaxy clusters. ††thanks: Based on observations with ISO, an ESA project with instruments funded by ESA Member States (especially the PI countries: France, Germany, the Netherlands and the United Kingdom) and with the participation of ISAS and NASA
The massive cluster of galaxies Abell 2219 (z = 0.228) with two spectacular gravitational lensing arcs was observed at 14.3 m (hereafter 15 m) with the Infrared Space Observatory and results were published by Barvainis et al. (1999AJ….118..645B (1999)). These observations have been reanalyzed using a method specifically designed for the detection of faint sources that had been applied to other clusters. Five new sources were detected and the resulting cumulative total of ten sources all have optical counterparts. The mid-infrared sources are identified with three cluster members, three foreground galaxies, an Extremely Red Object, a star and two galaxies of unknown redshift. The spectral energy distributions (SEDs) of the galaxies are fit with models from a selection, using the program GRASIL. Best-fits are obtained, in general, with models of galaxies with ongoing star formation. Infrared luminosities and star formation rates are obtained for six sources: the cluster members and the foreground galaxies. For the three cluster members the infrared luminosities derived from the model SEDs are between and , corresponding to infrared star formation rates between 10 and 24 . The two cluster galaxies that have optical classifications are in the Butcher-Oemler region of the color-magnitude diagramme. The three foreground galaxies have infrared luminosities between and yielding infrared star formation rates between 3 and 16 . Two of the foreground galaxies are located in two foreground galaxy enhancements (Boschin et al. 2004A&A…416..839B (2004)). Including Abell 2219, six distant clusters of galaxies have been mapped with ISOCAM and luminous infrared galaxies (LIRGs) have been found in three of them. The presence of LIRGs in Abell 2219 strengthens the association between luminous infrared galaxies in clusters and recent or ongoing cluster merger activity.
Key Words.:
Galaxies: clusters: general – Galaxies: clusters: individual (Abell 2219) – Infrared: galaxies1 Introduction
The study of clusters of galaxies is of fundamental importance in understanding the mechanisms that drive galaxy formation and evolution and in constraining cosmological theories for the formation of large-scale structures (e.g. Bahcall 1988ARA&A..26..631B (1988); Gladders et al. 2002AJ….123….1G (2002); Schuecker et al. 2003A&A…402…53S (2003)). Moreover clusters offer the opportunity of studying environmental effects on the evolution of galaxies and, through the phenomenon of gravitational lensing, allow the observation of background galaxies that would normally be below detection thresholds (e.g. Mellier 1999ARA&A..37..127M (1999); Metcalfe et al. 2001IAUS..204..217M (2001, 2003)).
The comprehension of the properties of clusters of galaxies is growing rapidly thanks to a range of exceptionally good observations taken using both ground-based (e.g. Yamada et al. 2000PASJ…52…43Y (2000); Böhringer et al. 2001A&A…369..826B (2001); Gladders et al. 2002AJ….123….1G (2002); Andreon & Cuillandre 2002ApJ…569..144A (2002)) and space-based telescopes, particularly in the infrared, optical and X-ray bands (e.g. Duc et al. 2002A&A…382…60D (2002); Stanford et al. 2002ApJS..142..153S (2002); Burke et al. 2003MNRAS.341.1093B (2003)).
Mid-infrared deep surveys with ESA’s Infrared Space Observatory (ISO, Kessler et al. 1996A&A…315L..27K (1996)) have revealed a population of starburst field galaxies that evolve significantly with redshift and have a median redshift of 0.8 (Aussel et al. 1999A&A…342..313A (1999); Oliver et al. 2000MNRAS.316..749O (2000); Serjeant et al. 2000MNRAS.316..768S (2000); Lari et al. 2001MNRAS.325.1173L (2001); Elbaz et al. 2002A&A…384..848E (2002); Gruppioni et al. 2002MNRAS.335..831G (2002); Metcalfe et al. 2003A&A…407..791M (2003)). The mid-infrared emission from the ISOCAM sources accounts for most of the cosmic infrared background (Altieri et al. 1999A&A…343L..65A (1999); Franceschini et al. 2001A&A…378….1F (2001); Elbaz & Cesarsky 2003Sci…300..270E (2003); Metcalfe et al 2003A&A…407..791M (2003); Sato et al. 2003A&A…405..833S (2003)). Mid-infrared data have been published for local clusters (e.g. Boselli et al. 1997A&A…327..522B (1997, 1998); Contursi et al. 2001A&A…365…11C (2001)) and distant clusters of galaxies (e.g. Pierre et al. 1996A&A…315L.297P (1996); Lémonon et al. 1998A&A…334L..21L (1998); Soucail et al. 1999A&A…343L..70S (1999); Fadda et al. 2000A&A…361..827F (2000); Metcalfe et al. 2003A&A…407..791M (2003); Coia et al. coia (2003)). The results of the observations revealed a wide dispersion in the number of luminous infrared galaxies (LIRGs, Genzel & Cesarsky 2000ARA&A..38..761G (2000)) in clusters. New observations with the Spitzer Space Telescope (Rieke et al. 2001AAS…199.4401R (2001); Dole et al. 2003ApJ…585..617D (2003); Werner et al. spitzer (2004)) will further contribute to the understanding of the infrared population of galaxies in clusters.
The cluster of galaxies Abell 2219 () was observed using the 15 m (LW3 : 12 to 18 m, ) filter of the ISOCAM instrument on board ISO (Cesarsky et al. 1996A&A…315L..32C (1996)). Results were published by Barvainis et al. (1999AJ….118..645B (1999), hereafter BAH99) and consist of five sources with flux densities between 530 Jy and 1100 Jy. One of the sources was identified with the Extremely Red Object (ERO) J164023+4644 at redshift and the remaining four sources were identified with galaxies of unknown redshift.
In this paper we present the results of our re-analysis of the ISOCAM observations of Abell 2219 using a method specifically designed for the detection of faint sources (Metcalfe et al. 2003A&A…407..791M (2003)). Section 2 contains a short description of the cluster. Data reduction, source extraction and photometric calibration are described in section 3. The results are given in section 4. Spectral energy distributions, infrared star formation rates and luminosities are in section 5. The discussion is given in section 6 and conclusions are summarized in section 7.
We adopt H km s-1 Mpc-1, and . With this cosmology, the luminosity distance to the cluster is and 1″ on the sky corresponds to 3.7 kpc. The age of the Universe at the cluster redshift of 0.228 is 10.7 Gyr.
2 The cluster
| Reads | n Steps | dm | dn | area | Done k | Tot.t | ||
| (m) | per step | M | N | () | () | times | (sec) | |
| 15.0 | 12 | 3 | 3 | 14 | 14 | 13.4 | 3 | 4074 |
Abell 2219 is a massive cluster with an estimated value for the mass of and a virial radius of Mpc (Carlberg et al. 1997ApJ…476L…7C (1997); Boschin et al. 2004A&A…416..839B (2004)). It is an optically rich cluster with an Abell richness class of 3 (Abell et al. 1989ApJS…70….1A (1989)). The core is dominated by a cD galaxy with a minor concentration of galaxies visible around the second brightest cluster member at a projected distance of 190 kpc from the core. The cluster exhibits two spectacular gravitational lensing arcs (Smail et al. 1995MNRAS.277….1S (1995)), labelled A and B in Fig. 1. The distribution of redshifts of cluster galaxies is shown in Fig. 2.
Abell 2219 is one of the brightest X-ray clusters detected in the ROSAT All Sky Survey, with a luminosity in the 0.1-2.4 keV band of and a temperature, , of keV (Allen et al. 1992MNRAS.259…67A (1992); Rizza et al. 1998MNRAS.301..328R (1998)). The gas distribution traced by the X-ray observations is elliptical in shape and centered on the cD galaxy. The major axis of the ellipse is misaligned with respect to the major axis of the optical mass distribution, but lies close to the axis defined by the cD galaxy and the second brightest cluster member, labelled C in Fig. 1. This misalignment could indicate a past or ongoing merger of the cluster with the secondary galaxy concentration detected in the optical (Smail et al. 1995MNRAS.277….1S (1995); Boschin et al. 2004A&A…416..839B (2004)).
Abell 2219 is characterized by a diffuse radio halo that extends for more than 2 Mpc and is similar in shape to the radio halo in Coma but 10 times more powerful (Bacchi et al. 2003A&A…400..465B (2003)). There may be a connection between cluster mergers and the presence of extended and diffuse radio emission (Feretti 2003tsra.symp..209F (2003)).
3 Observations, data reduction, source detection and photometric calibration
Abell 2219 was observed with ISO in raster mode on April 20, 1997. Three independent observations were made using the LW3 ISOCAM filter. The parameters of the observations are given in Table 1. The area covered was 13.4 square arcminutes centered on the cluster core, corresponding to a physical area of . The diameter of the central maximum of the point spread function (PSF), at the first Airy minimum, is arcseconds. The full-width at half-maximum (FWHM) is about half that amount and Okumura (korio (1998)) obtained a value of 4.9″ at 15 m for the PSF FWHM in the 6″ per pixel field-of-view.
The data were reduced using the software CIA (Delaney & Ott ISOCAM (2002), Ott et al. 1997adass…6…34O (1997)) in conjunction with dedicated routines following the method described in Metcalfe et al. (2003A&A…407..791M (2003)). The three maps were merged into a single image thus increasing the sensitivity to faint sources. In the process the data were rebinned so that the final maps have a pixel size of 1″ benefiting from the raster displacement and thus improving the resolution and allowing better cross-identification with observations at other wavelengths. The 15 m merged map obtained is overlaid in Fig. 1 on the Palomar B-band image of the cluster.
The extraction of sources was done using SExtractor (Bertin & Arnouts 1996A&AS..117..393B (1996)). The tool was run separately on the three individual maps. For the parameters chosen, the software could automatically detect sources above over 9 consecutive pixels. The program was then run on the merged image with the same parameters used for the individual rasters. A detection was considered real when present on the merged map and on at least two of the three individual maps. The source list obtained is given in Table 2. The name of the ISOCAM source is derived from the satellite acronym (ISO), the partial name of the cluster (A2219) and an index number of the 15 m source as listed in Table 2 (e.g. ISO_A2219_01 is source 01 in Table 2). The index indicates increasing Right Ascension.
Montecarlo simulations involving the insertion of fake sources in the unprocessed data were performed on the three individual rasters to analyse the effects of the data reduction process as described in Metcalfe et al. (2003A&A…407..791M (2003)). The simulations were performed independently for all rasters and SExtractor was applied with the same parameters adopted in the absence of the inserted fake sources. The recovered signals for the fake sources were typically 60-70% of the inserted values. The signals from the real sources were then scaled according to the calibration factor determined from the simulations. The scaled signals were converted to mJy using the filter specific ISOCAM calibration factor i.e. 1 ADU per gain per second mJy for LW3 (Delaney & Ott ISOCAM (2002)). A further scaling factor was applied to correct for detector responsive transients effects. The steps for correcting for the detector responsive transients are described in Metcalfe et al. (2003A&A…407..791M (2003)), Section 4.3. Taking the approach described there, source signals recorded in the CAM LW3 filter in deep micro-scanned rasters were found to relate to stabilised source signals (determined by applying the model of Coulais & Abergel (2000A&AS..141..533C (2000)) as implemented in CIA) in the ratio: recorded_signal/stabilised_signal = .
The column named Precision in Table 2 is a measure of the accuracy of the photometric results. The precision values are derived from fake source simulations. For each source brightness the precision is the 1-sigma scatter found in the recovered fluxes of fake sources of similar brightness inserted into the raw data.

| ISO_A2219 | Flux | Precision | Flux | Precision | Coordinates | BAH99 | Redshift | Optical | ||
|---|---|---|---|---|---|---|---|---|---|---|
| (ADU) | (ADU) | (mJy) | (mJy) | R.A. (J2000) | DEC. (J2000) | ID | Flux (mJy) | ID | ||
| 01 | 0.608 | 0.029 | 0.891 | 0.042 | 16 40 12.8 | +46 43 04.0 | 1 | 0.230 | 42 | |
| 02 | 0.673 | 0.029 | 0.985 | 0.042 | 16 40 14.0 | +46 41 48.0 | 2 | 0.111 | 45 | |
| 03 | 0.289 | 0.021 | 0.433 | 0.030 | 16 40 16.4 | +46 42 29.7 | - | - | - | - |
| 04 | 1.072 | 0.062 | 1.558 | 0.090 | 16 40 21.4 | +46 40 44.8 | 3 | 0.188 | 72 | |
| 05 | 0.768 | 0.055 | 1.122 | 0.079 | 16 40 22.6 | +46 43 12.0 | 4 | - | ||
| 06 | 0.313 | 0.021 | 0.468 | 0.030 | 16 40 23.1 | +46 42 17.7 | - | - | 0.218 | 81 |
| 07 | 0.437 | 0.029 | 0.644 | 0.042 | 16 40 23.1 | +46 44 05.1 | 5 | 1.048 | - | |
| 08 | 0.348 | 0.021 | 0.515 | 0.030 | 16 40 25.0 | +46 44 23.2 | - | - | 0.135 | 90 |
| 09 | 0.179 | 0.021 | 0.275 | 0.030 | 16 40 28.5 | +46 42 57.8 | - | - | - | - |
| 10 | 0.160 | 0.021 | 0.248 | 0.030 | 16 40 29.4 | +46 43 32.5 | - | - | - | Star |
| ISO_A2219 | L15μm | LIR | k-corr. | SFR[IR] | Best-fit SED | other SED (95%) | Membership |
|---|---|---|---|---|---|---|---|
| (L⊙) | (L⊙) | (M⊙ yr-1) | Model | ||||
| 01 | 2.20e+09 | 1.04e+11 | 1.2 | 18 | S (Y) | - | C |
| 02 | 3.92e+08 | 1.85e+10 | 1.0 | 3 | SB+1 (O) | S (O), SB+1 (Y) | F |
| 04 | 1.99e+09 | 9.36e+10 | 1.0 | 16 | S (Y) | S (O), S (Y) | F |
| 05 | 3.00e+09 | 1.41e+11 | 1.4 | 24 | SB+1 (O) | S (O), S (O), SB+1 (Y) | C⋆ |
| 06 | 1.21e+09 | 5.73e+10 | 1.5 | 10 | SB+1 (O) | SB+1 (Y) | C |
| 08 | 3.15e+08 | 1.49e+10 | 1.0 | 3 | SB+1 (O) | S (O) | F |
4 Results
The five sources published by BAH99 are confirmed. In addition five new sources were found. The sources are listed in Table 2 and include the flux densities from BAH99. The small differences in flux and position between the present analysis and the results of BAH99 fall within the combined errors.
All of the 15 m sources have an optical counterpart (Fig. 1). With the exception of source ISO_A2219_10, which is associated with a star, all sources are identified with galaxies. The sources are compared with the spectroscopic catalog of Boschin et al. (2004A&A…416..839B (2004)). ISO_A2219_01 and ISO_A2219_06 are associated with the cluster galaxies 42 and 81 that are described as Butcher-Oemler galaxies (Butcher & Oemler 1984ApJ…285..426B (1984)), i.e. a description that refers to the excess of blue galaxies in distant clusters relative to nearby clusters. Galaxy 81 has weak x-ray emission indicating the presence of an active nucleus. ISO_A2219_02 is identified with a galaxy in the foreground enhancement of galaxies at z 0.11 and ISO_A2219_04 with another density enhancement at z 0.19 (Fig. 2). They are listed in the catalog of Boschin et al. (2004A&A…416..839B (2004)) as star forming galaxies number 45 and 82. ISO_A2219_08 is listed in the same catalog as source 90. ISO_A2219_07 is associated with ERO J164023+4644 at a redshift of . Sources ISO_A2219_03 and ISO_A2219_09 are identified with galaxies of undetermined redshifts; their flux densities, as listed in Table 2, need to be corrected for gravitational lensing if they are confirmed as background sources, as suggested by the faintness of the optical counterparts. ISO_A2210_05 is assumed to be in the cluster based on the dimensions of its optical counterpart and location in a group of cluster galaxies. Moreover, it lies quite close to a mass concentration in the lens model described in Smith et al. (astro-ph/0403588 (2004)), streghtening the conclusion that ISO_A2210_05 is indeed a cluster galaxy.
4.1 Hubble Space Telescope images
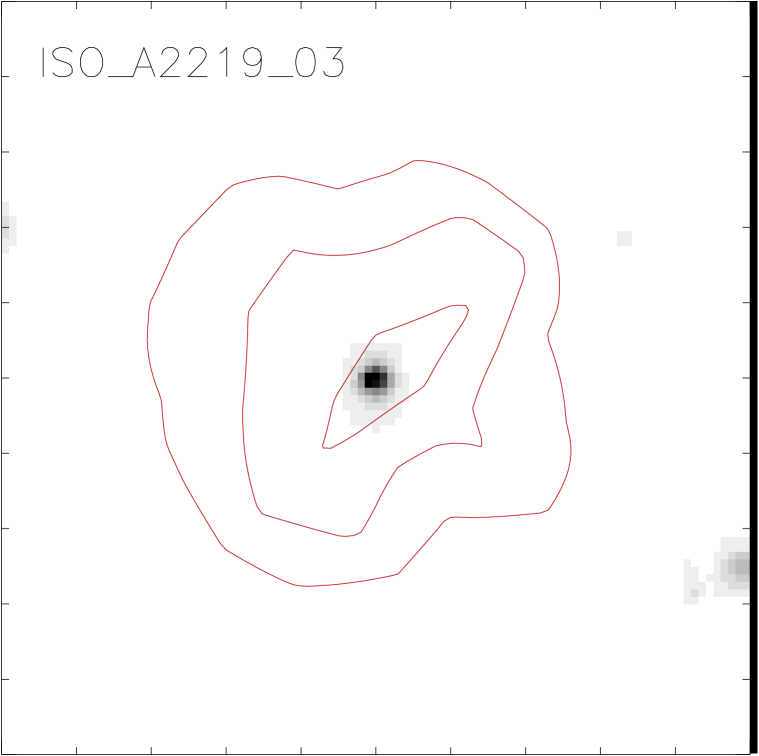
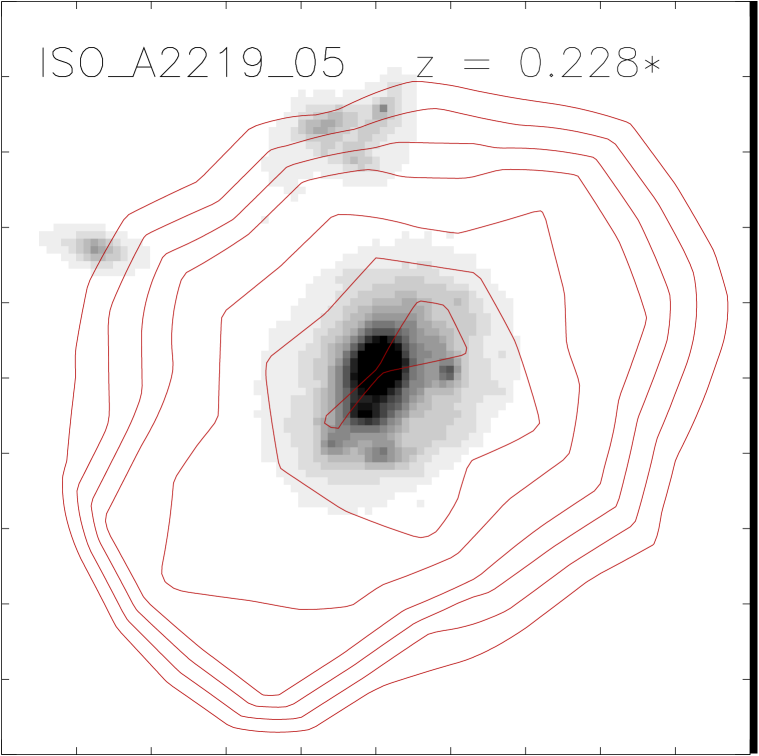
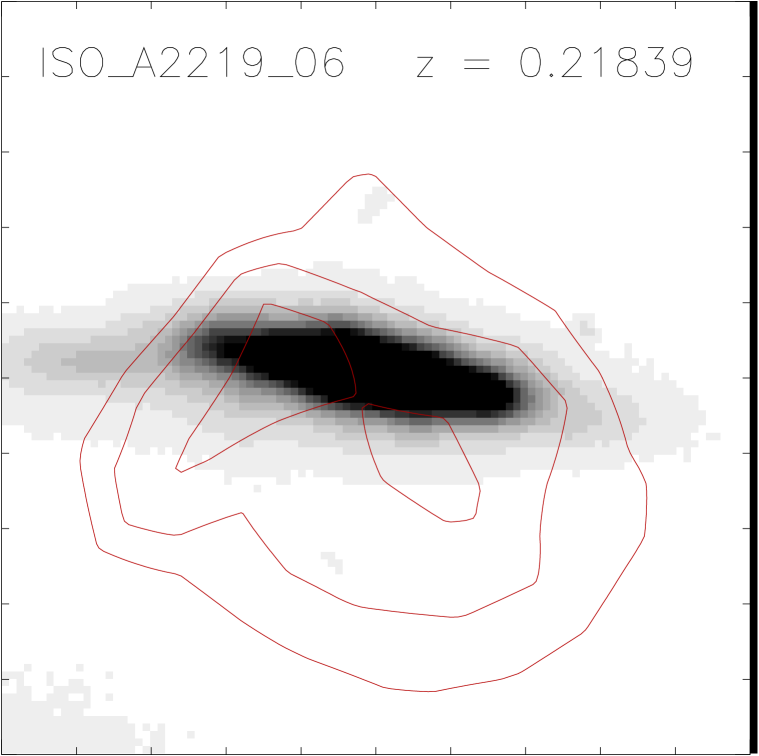
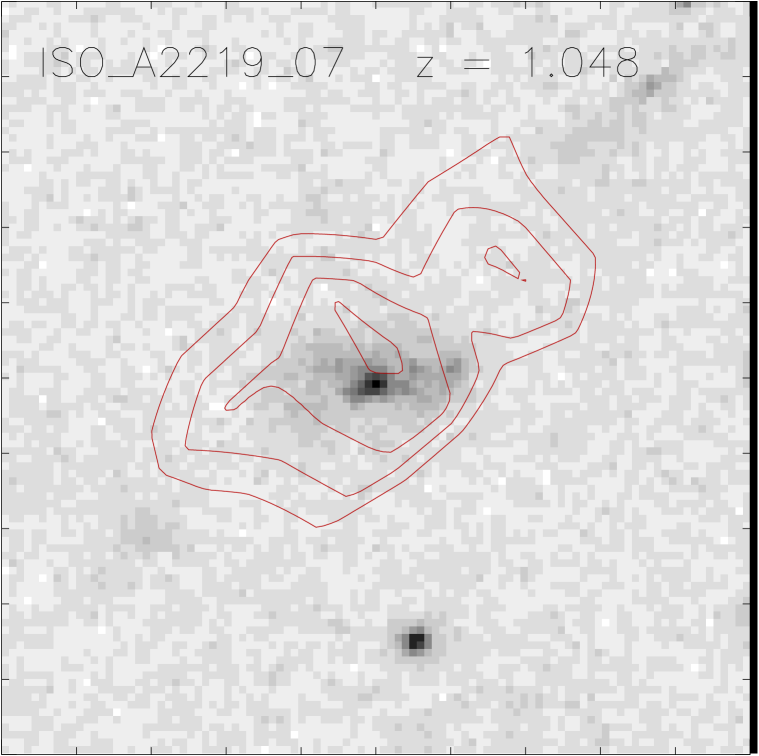
An area of 2.5′2.5′, centered on the cluster core, was observed by the Hubble Space Telescope (HST) using the F702W filter on WFPC-2 (Smith et al. 2002MNRAS.330….1S (2002)). The areas observed with HST and ISOCAM partially overlap and the overlap region includes sources ISO_A2219_03, ISO_A2219_05, ISO_A2219_06 and ISO_A2219_07. For these sources, miniature maps centered on the ISOCAM coordinates were extracted from the HST image and the 15 m contours are overlaid on the maps in Fig. 3.
The HST image of ISO_A2219_03 shows a small face-on galaxy, probably an E/S0 galaxy since in this image there is no evidence of a spiral structure. However, the spatial resolution of the image is too poor to determine the morphological type. Given its angular dimensions (4″15 kpc at the cluster redshift), ISO_A2219_05 might be a cluster galaxy. It shows disturbances at at least three sites in the outer regions and an elongated bulge which could be the result of past or on-going mergers. ISO_A2219_06 is associated with an inclined spiral cluster galaxy. The morphology of the ERO associated with ISO_A2219_07 appears irregular. Its color and spectroscopic properties were thoroughly studied by Smith et al. (2001ApJ…562..635S (2001, 2002)).
Overall, these four HST overlays indicate that the mid-infrared detections are not strongly associated with galaxies of a specific morphological type, even though this sample is too small to draw definite conclusions.
5 Spectral energy distributions, infrared star formation rates (SFRs) and luminosities
Spectral energy distributions (SEDs) were computed for sources ISO_A2219_01, ISO_A2219_02, ISO_A2219_04, ISO_A2219_05, ISO_A2219_06 and ISO_A2219_08 using the program GRASIL (Silva et al. 1998ApJ…509..103S (1998)) by including archival measurements in the optical and the near-infrared. Additional photometric data were obtained by running SExtractor on optical and near-infrared images. These include images taken in the B (Palomar Hale), I (WHT), J (WHT), and K (WHT) photometric bands (Smail et al. 1998MNRAS.293..124S (1998); Smith et al. 2002MNRAS.330….1S (2002)).


The observed data were compared with SED models that represent broad classes of spectral type, following a procedure fully described in Coia et al. (coia (2003)) and Biviano et al. (biviano (2004)).
In this work, 20 models were considered. They were either taken from the public GRASIL library, or built by running the publicly available GRASIL code, or kindly provided by L. Silva (private comm.). The 20 models reproduce the SEDs of several kinds of galaxies, from early-type, passively evolving ellipticals (labelled ’E’, in the following), to spiral galaxies (labelled ’S’), and starburst galaxies (similar to the local examples Arp220 and M82), as seen either at the epoch of the starburst event, or 1 Gyr after (labelled ’SB’ or ’SB+1’, respectively). Two SB models were considered, one involving as much as % of the total baryonic mass of the galaxy, and another involving only % of the total baryonic mass of the galaxy. The strong burst models generally provide a better fit to the SEDs of our galaxies. At variance with Mann et al. (2002MNRAS.332..549M (2002)) we avoid considering models older than the age of the Universe at the cluster redshift. Specifically, we consider models for galaxies with a formation redshift , corresponding to an age at the cluster redshift of Gyr, and models with a formation redshift , corresponding to an age at the cluster redshift of Gyr. We label the corresponding models with the suffixes ’Y’ and ’O’, respectively.
The best-fitting SED model was determined by minimization, leaving the normalisation of the model as a free parameter. The SEDs are plotted in Fig. 4 and summarized in Table 3. S and SB+1 models provide the SED best-fits and there seems to be no clear preference for Y or O models.
The k-corrections derived from the best-fit SEDs were used to obtain the rest-frame 15 m luminosities using the relationship between the measured 15 m luminosities and the k-corrected total infrared luminosities (LIR) from Elbaz et al. (2002A&A…384..848E (2002)).
The source ISO_A2219_01 has a total infrared luminosity of (Table 3) which classifies it as a LIRG. ISO_A2219_05 also has an infrared luminosity typical of a LIRG, assuming it is a cluster member. ISO_A2219_06 has an infrared luminosity of , which is comparable to the luminosity of cluster sources found in Abell 1689 by Fadda et al. (2000A&A…361..827F (2000)).
SFRs were computed from the mid-infrared fluxes and model SEDs following the conversion of Kennicutt (1998ARA&A..36..189K (1998)).
| (1) |
The values obtained are listed in Table 3. The infrared SFRs of the three cluster sources range from 10 to 24 , with a mean value of 17 . The infrared SFRs for the three foreground galaxies fall in the range between 3 and 16 . The high values of the SFRs in cluster and foreground galaxies are however much less than the values in field galaxies with redshifts that were found in deep surveys with ISO (Oliver et al. 2000MNRAS.316..749O (2000); Mann et al. 2002MNRAS.332..549M (2002); Elbaz & Cesarsky 2003Sci…300..270E (2003)).
6 Discussion
The dominant population of galaxies that fall in the Butcher-Oemler region of the color-magnitude diagramme of Abell 2219 are a-type, i.e. galaxies with strong Balmer absorption (, Boschin et al. 2004A&A…416..839B (2004)).
ISO_A2219_01 and ISO_A2219_06 are identified with dusty star-forming galaxies 42 and 81 that are classified as a-type with strong H absorption and weak [O ii] emission with (Boschin et al. 2004A&A…416..839B (2004)). The optical SFR for ISO_A2219_01 is estimated at which is much less than the value of 18 given in Table 3. Most of the star formation is missed in the optical because it is enshrouded by dust. In the clusters Abell 1689 (Fadda et al. 2000A&A…361..827F (2000), Duc et al. 2002A&A…382…60D (2002)) and Cl 0024+1654 (Coia et al. coia (2003)), that were observed with ISO, the SFRs inferred using [O ii] are about one-tenth of those calculated from the infrared luminosities. The mid-infrared sources in Abell 1689 are detected in H, indicating that the star forming processes are not completely hidden by dust (Balogh et al. 2002MNRAS.335…10B (2002)). The GRASIL models have also been used to obtain the SEDs of the ISOCAM sources in Cl 0024+1654 (Coia et al. coia (2003)) and Abell 2218 (Biviano et al. biviano (2004)). The galaxies in the Butcher-Oemler region of the color-magnitude diagramme have SEDs that are best-fit by spiral models. However the galaxies on the main sequence in Cl 0024+1654 are usually best-fit with models of starburst galaxies as observed 1 Gyr after the burst event. A large number of cluster sources was detected by ISOCAM at 7 m in Abell 2218. The SEDs of most of these sources are best-fit by models of quiescent ellipticals with negligible SFRs.
A number of clusters with redshifts between and were mapped with ISOCAM and the numbers of sources that have fluxes consistent with LIRGs, within the precision of the measurements, was determined for each cluster. A comparison was made between the number of LIRGs in the clusters taking into account virial masses and radii, areas scanned and cluster distances (Coia et al. coia (2003)). The cluster Cl 0024+1654 was compared with the other clusters because it has a large number (10) of luminous sources that have measurements consistent with LIRGs. This comparison revealed a large difference between Cl 0024+1654 () and Abell 370 () because in the latter only one source was detected whereas 8 were expected from the comparison. The two clusters have similar mass, redshift and optical richness and the large difference in the luminous infrared populations was attributed to a recent collision in Cl 0024+1654 (Czoske et al. 2002A&A…386…31C (2002)) and the presence of gas rich progenitors to fuel the starbursts. The collision may account for the large difference in the ratio of mass to infrared light for the two clusters.
The cluster Cl 0024+1654 was also compared with Abell 2218 (), Abell 2390 () and Abell 1689 () and a total of three sources was expected whereas none was detected. A similar comparison has now been made between Cl 0024+1654 and Abell 2219. In this case there is good agreement because only one source was expected and two were detected implying that the clusters have similar values for the ratio of mass to infrared light.
It is interesting that the redshift distributions along the lines-of-sight to the clusters Cl 0024+1654 and Abell 2219 are quite similar. They have smaller foreground clusters that are displaced from the main cluster by a small amount in redshift (Fig. 2). In Cl 0024+1654 there is strong evidence that the two clusters were recently involved in a collision (Czoske et al. 2001A&A…372..391C (2001, 2002)). There is also very strong evidence for merger activity in Abell 2219 as shown by the merging of small clumps of galaxies with the cluster, the radio halo and powerful X-ray emission (Boschin et al. 2004A&A…416..839B (2004)). The presence of LIRGs in Cl 0024+1654 and Abell 2219 strengthens the link between luminous infrared sources in clusters with recent or ongoing merger activity.
The sample of clusters will be expanded by the ongoing observations with the Spitzer Space Telescope (Werner et al. spitzer (2004)).
7 Conclusions
This paper presents new results from mid-infrared observations of the massive cluster Abell 2219. The number of mid-infrared sources is increased from 5 to 10 with respect to the earlier work of Barvainis et al (1999AJ….118..645B (1999)). All the sources have optical counterparts. Three sources are identified with foreground galaxies, three with cluster galaxies, one with ERO J164023+4644 at and one with a star. The remaining two sources have undetermined redshifts and are likely to be background sources that are gravitationally lensed by the cluster.
SEDs were obtained for the three cluster members and the three foreground galaxies. Model SEDs were used to estimate parameters such as the infrared luminosity and SFR for the observed infrared sources. Models providing the best-fits to the observed SEDs are those of actively star-forming galaxies, either massive spirals, or starburst galaxies observed Gyr after the burst event. Two of the cluster galaxies are classified as LIRGs and have a mean SFR of , while the third has infrared luminosity and SFR comparable to those star forming galaxies found in other clusters. The foreground galaxies have infrared SFRs between 3 and 16 and two of them are located in foreground galaxy enhancements.
The mid-infrared properties of the galaxies in Abell 2219 are compared with five distant clusters that were mapped with ISOCAM. The number of LIRGs detected in Abell 2219 agrees with the expected number when compared with Cl 0024+1654 that is rich in luminous infrared galaxies.
Acknowledgements.
JPK acknowledges support from CNRS and Caltech. The ISOCAM data presented in this paper were analyzed using CIA, a joint development by the ESA Astrophysics Division and the ISOCAM Consortium. The ISOCAM Consortium is led by the ISOCAM PI, C. Cesarsky.This research has made use of data obtained from the High Energy Astrophysics Science Archive Research Center (HEASARC), provided by NASA’s Goddard Space Flight Center.
References
- (1) Abell, G. O., Corwin, H. G., & Olowin, R. P. 1989, ApJS, 70, 1
- (2) Allen, S. W., Edge, A. C., Fabian, A. C. et al. 1992, MNRAS, 259, 67
- (3) Altieri, B., Metcalfe, L., Kneib, J. P. et al. 1999, A&A, 343, 65
- (4) Andreon, S. & Cuillandre, J.-C. 2002, ApJ, 569, 144
- (5) Aussel, H., Cesarsky, C. J., Elbaz, D. & Starck, J. L. 1999, A&A, 342, 313
- (6) Bacchi, M., Feretti, L., Giovannini, G., & Govoni, F. 2003, A&A, 400, 465
- (7) Bahcall, N. A. 1988, ARA&A, 26, 631
- (8) Balogh, M. L., Couch, W. J., Smail, I., Bower, R. G., & Glazebrook, K. 2002, MNRAS, 335, 10
- (9) Barvainis, R., Antonucci, R. & Helou, G. 1999, ApJ, 118, 645 (BAH99)
- (10) Bertin, E. & Arnouts, S. 1996, A&AS, 117, 393
- (11) Biviano, A., Metcalfe, L., McBreen, B. et al. 2004, A&Aaccepted.
- (12) Böhringer, H., Schuecker, P., Guzzo, L. et al. 2001, A&A, 369, 826
- (13) Boschin, W., Girardi, M., Barrena, R. et al. 2004, A&A, 416, 839
- (14) Boselli, A., Gavazzi, G., Lequeux, J. et al. 1997, A&A, 327, 522
- (15) Boselli, A., Lequeux, J., Sauvage, M. et al. 1998, A&A, 335, 53
- (16) Burke, D. J., Collins, C. A., Sharples, R. M., Romer, A. K., & Nichol, R. C. 2003, MNRAS, 341, 1093
- (17) Butcher, H & Oemler A. Jr. 1984, ApJ, 285, 426
- (18) Carlberg, R. G., Yee, H.K.C., Ellingson, E. et al. 1997, ApJ, 476, L7
- (19) Cesarsky, C. J., Abergel, A., Agnese, P. et al. 1996, A&A, 315, L32
- (20) Coia, D., McBreen, B., Metcalfe, L. et al. 2003, submitted to A&A(astro-ph/0310317)
- (21) Contursi, A., Boselli, A., Gavazzi, G. et al. 2001, A&A, 365, 11
- (22) Coulais, A. & Abergel, A. 2000, A&AS, 141, 533
- (23) Czoske, O., Kneib, J.-P., Soucail, G. et al. 2001, A&A, 372, 391
- (24) Czoske, O., Moore, B., Kneib, J.P. & Soucail, G. 2002, A&A, 386, 31
- (25) Delaney, M. & Ott, S. 2002, ”ISOCAM Interactive Analysis User’s Manual”, Version 5.0, SAI/96-5226/Dc, http://www.iso.vilspa.esa.es/users/expl_lib/CAM_top.html
- (26) Dole, H., Lagache, G., & Puget, J.-L. 2003, ApJ, 585, 617
- (27) Duc, P.A., Poggianti, B., Fadda, D. et al. 2002, A&A, 382, 60
- (28) Elbaz, D., Cesarsky, C., Chanial, P. et al. 2002, A&A, 384, 848
- (29) Elbaz, D. & Cesarsky, C. 2003, Science, 300, 270
- (30) Fadda, D., Elbaz, D., Duc, P.-A. et al. 2000, A&A, 361, 827
- (31) Feretti, L. 2003, in Texas in Tuscany. XXI Symposium on Relativistic Astrophysics. Eds.: R. Bandiera, R. Maiolino, F. Mannucci. World Scientific pp. 209-220
- (32) Franceschini, A., Aussel, H., Cesarsky, C. J. et al. 2001, A&A, 378, 1
- (33) Genzel, R. & Cesarsky, C. J. 2000, ARA&A, 38, 761
- (34) Gladders, M. D., Yee, H. K. C., & Ellingson, E. 2002, AJ, 123, 1
- (35) Gruppioni, C., Lari, C. & Pozzi, F. et al. 2002, MNRAS, 335, 831
- (36) Kennicutt, R. C. 1998, ARA&A, 36, 189
- (37) Kessler, M. F., Steinz, J. A., Anderegg, M. E. et al. 1996, A&A, 315, L27
- (38) Lari, C., Pozzi, F., Gruppioni, C. et al. 2001, MNRAS, 325, 1173
- (39) Lémonon, L., Pierre, M., Cesarsky, C. J. et al. 1998, A&A, 334, L21
- (40) Mann, R.G., Oliver, S., Carballo, R. et al. 2002, MNRAS, 332, 549
- (41) Mellier, Y. 1999, ARA&A, 37, 127
- (42) Metcalfe, L., McBreen, B., Kneib, J.-P. & Altieri, B. 2001, in Proc. IAU Symp., 204, The Extragalactic Infrared Background and its Cosmological Implications, ed. M. Harwit & G. Hauser, PASP.
- (43) Metcalfe, L., Kneib, J.-P., McBreen, B. et al. 2003, A&A, 407, 791
- (44) Okumura, K. 1998, ISOCAM PSF report, ver. 1.0
- (45) Oliver, S., Rowan-Robinson, M., Alexander, D.M. et al. 2000, MNRAS, 316, 749
- (46) Ott, S., Abergel, A., Altieri, B. et al. 1997, Astronomical Data Analysis Software and Systems VI, A.S.P. Conference Series, Vol. 125, 1997, Gareth Hunt and H. E. Payne, eds., p. 34., 6, 34
- (47) Pierre, M., Aussel, H., Altieri, B. et al. 1996, A&A, 315, L297
- (48) Rieke, G. H., Young, E. T., Ade, P. A. R. et al. 2001, Bulletin of the American Astronomical Society, 33, 1366
- (49) Rizza, E., Burns, J. O., Ledlow, M. J. et al. 1998, MNRAS, 301, 328
- (50) Sato, Y., Kawara, K., Cowie, L. L. et al. 2003, A&A, 405, 833
- (51) Schuecker, P., Caldwell, R. R., Böhringer, H. et al. 2003, A&A, 402, 53
- (52) Serjeant, S., Oliver, S., Rowan-Robinson, M. et al. 2000, MNRAS, 316, 768
- (53) Silva, L., Granato, G.L., Bressan, A., & Danese, L. 1998, ApJ, 509, 103
- (54) Smail, I., Hogg, D. W., Blandford, R. et al. 1995, MNRAS, 277, 1
- (55) Smail, I., Edge, A. C., Ellis, R. S., & Blandford, R. D. 1998, MNRAS, 293, 124
- (56) Smail, I., Morrison, G., Gray, M. E. et al. 1999, ApJ, 525, 609
- (57) Smith, G. P., Treu, T., Ellis, R., Smail, I., Kneib, J.-P., & Frye, B. L. 2001, ApJ, 562, 635
- (58) Smith, G. P., Smail, I., Kneib, J.-P. et al. 2002, MNRAS, 330, 1
- (59) Smith, G. P., Kneib, J.-P., Smail, I. et al. 2004, submitted to MNRAS, astro-ph/0403588
- (60) Soucail, G., Kneib, J. P., Bézecourt, J. et al. 1999, A&A, 343, L70
- (61) Stanford, S. A., Eisenhardt, P. R., Dickinson, M., Holden, B. P., & De Propris, R. 2002, ApJS, 142, 153
- (62) Werner, M. W., Roellig, T. L., Low, F. J. et al. 2004, ApJS (Spitzer Special Issue) accepted
- (63) Yamada, T., Kajisawa, M., Tanaka, I. et al. 2000, PASJ, 52, 43