- Observations of G32.45+0.1 and G38.55+0.0: diffuse hard X-ray sources found with the Galactic Plane Survey
Abstract
We report on - observations of G32.45+0.1 and G38.55+0.0. These were discovered as diffuse hard X-ray sources with the Galactic plane survey, but the limited spatial resolution of could not conclude whether these are truly diffuse or a group of unresolved point-sources. -, with higher spatial resolution than , confirmed that G32.45+0.1 has a diffuse shell-like structure with a radius of . The spectrum shows featureless continuum, hence can be fitted with a power-law model of with an absorption of . From this value, we estimate the distance to G32.45+0.1 to be kpc, then the luminosity (in the 0.5–10.0 keV band) and radius of the shell are ergs s-1 and 20 pc, respectively. The radio complex sources in the NRAO/VLA Sky Survey (NVSS; 1.4 GHz) are globally associated to the X-ray shell of G32.45+0.1. Therefore G32.45+0.1 is likely to be a synchrotron dominant shell-like SNR. No significant diffuse structure was found in the - image of another diffuse source G38.55+0.0. The upper limit of the observed flux (0.5–10.0 keV) is estimated to be ergs cm-2 s-1 being consistent with the result.
111Department of Physics, Graduate School of Science, Kyoto University, Sakyo-ku, Kyoto 606-8502222RIKEN (The Institute of Physical and Chemical Research), 2-1 Hirosawa, Wako, Saitama 351-0198333Faculty of Humanities and Social Sciences, Iwate University, 3-18-34 Ueda, Morioka, Iwate 020-85501 Introduction
Since cosmic rays were discovered by Hess in 1912, the source and the mechanism of acceleration have been unknown. The spectrum of cosmic rays shows a single power-law up to the knee energy ( eV), where the gyro radius of electrons in typical interstellar magnetic field is much smaller than the Galactic radius. Therefore cosmic rays below the knee energy is likely to be Galactic origin. The discoveries of synchrotron X-rays and inverse Compton TeV -rays from the supernova remnant (SNR) SN 1006 indicated that electrons are accelerated close to the knee energy (Koyama et al. 1995; Tanimori et al. 1998). The results of the small-scale structure is successfully explained by a diffusive shock acceleration model (DSA); the first-order Fermi mechanism is working at the shock front of SNRs (Bamba el al. 2003b; Yamazaki et al. 2004).
Besides SN 1006, synchrotron X-ray emissions were discovered from other SNRs, G347.5-0.3 (RX J1713.73946; Koyama et al. 1997; Slane et al. 1997), Cas A (Vink et al. 2000), Tycho’s SNR (Hwang et al. 2002), RX J0852.04622 (Slane et al. 2001), RCW 86 (Borkowski et al. 2001a), AX J1843.80352 (Bamba et al. 2001; Ueno et al. 2003), 30 Dor C (Bamba et al. 2004). Although the synchrotron X-ray emissions were observed from several SNRs, the total number and the X-ray fluxes so far discovered are insufficient to account for all cosmic rays in our Galaxy; if SNRs are the main accelerator of the cosmic rays, we can expect more non-thermal SNRs. Accordingly, we searched for the SNR candidates in the data of the Galactic plane survey which covered on the Galactic plane (Yamauchi et al. 2002). About half a dozen candidates were found in this survey area; follow-up deep exposure observations with were made on three candidates, G11.0+0.0, G25.5+0.0, and G26.60.0, and these were suggested to be non-thermal SNRs (Bamba et al. 2003a). G28.60.1 (AX J1843.80352) is deeply observed with both and and is established to be a synchrotron X-ray emitting shell-like SNR (Bamba et al. 2001; Ueno et al. 2003).
Two other candidates G32.45+0.1 and G38.55+0.0 are seen as diffuse-like hard sources in the images, and the spectra show a power-law like feature with =1–3. The spatial sizes ( a few arcmin) are, however, marginal compared with the point spread function (PSF) of ( 1 arcmin) to determine whether these are diffuse or a group of unresolved point-sources. We, therefore, made - (Aschenbach et al. 2000) observations on G32.45+0.1 and G38.55+0.0 with higher spatial resolution (PSF5 arcsec) and larger effective area than those of .
2 Observations
G32.45+0.1 and G38.55+0.0 were observed with - on 2003 September 25 (Observation ID = 0136030101), and 2003 September 21 (Observation ID = 0136030201), respectively. Although the data were obtained from both the EPIC-MOS (Turner et al. 2001) and EPIC-PN (Strder et al. 2001) cameras, the major part of these objects were suffered by the PN-CCD gaps and bad columns, and we verified that cleaned PN data do not improve accuracy of results obtained with MOS only, hence we ignore the PN data hereafter. All the EPIC instruments were operated in the full frame mode with the medium filter. We used version 5.4.1 of the Standard Analysis System (SAS) software, and selected X-ray events with PATTERN keywords between 0 and 12.
The net exposure times were 26.8 ks and 15.9 ks for G32.45+0.1 and G38.55+0.0, respectively. In the observation of G32.45+0.1, however, the particle background was exceptionally high and variable, and hence we accumulated the background light-curve in the 10–12 keV band from all of the field of view and removed the high background data (the time intervals when the count rate is larger than 0.3 count s-1). After the filtering, the exposure times of MOS1 and MOS2 are 20.5 ks and 21.2 ks, respectively. The filtering using the same prescription was also performed on the observation of G38.55+0.0. Then the filtered exposure times of MOS1 and MOS2 are 15.1 ks and 15.4 ks, respectively.
In order to estimate the residual soft-proton cotamination (which is vignetted), we calculated the value “R” according to Section B.2 of De Luca and Molendi (2004). For both of the observations, the values R of MOS1 and MOS2 are 1.2 and 1.1, respectively, hence the contributions of residual soft-protons are negligible in the filtered data.
3 Analysis of G32.45+0.1
3.1 X-Ray Image
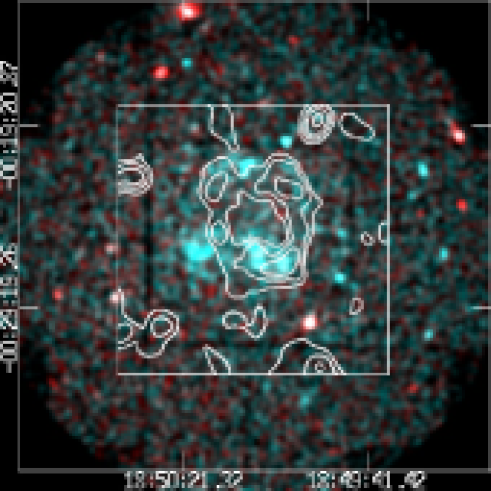
In figure 1, the soft (0.5–2.0 keV) and hard (2.0–7.0 keV) band X-ray images are shown with two colors. In the hard band image (blue) only, we see a shell-like structure with a radius of about 4 arcmin.
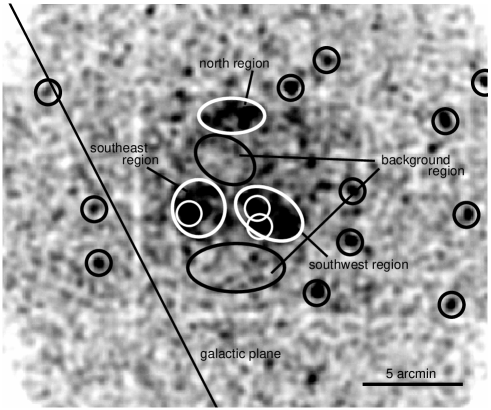
In order to estimate the accurate flux of the diffuse shell in the hard band image, we picked up point-sources using the EWAVELET software, with the detection threshold of 5. Thus detected point-sources are indicated with the black and (thin) white circles in figure 2. The three white circles are in the diffuse shell, and hence we made radial profiles of these sources and estimated the FWHM assuming Gaussian profile. As listed in table 1, all the FWHMs of the sources are significantly larger than that of the point spread function (PSF) of - (FWHM ). We, therefore, conclude that these are not point-like sources, but are local enhancements on the shell.
| (R.A., Dec.)J2000 | position | extension (FWHM arcsec) |
| (, ) | the southeast region | |
| (, ) | the southeast region | |
| (, ) | the southeast region | |
| Uncertainties correspond to 1 regions. | ||
3.2 Spectrum
Firstly, we divided the diffuse emission into three regions (north, southwest, and southeast; figure 2), and extracted the X-ray spectra separately. However the statistics of all the spectra are not enough for spectral fittings. We therefore added them together and regarded it as the spectrum of the whole shell. The background are taken from the neighborhood ellipses which are also shown in figure 2. Since these background regions are near to the source regions enough and the average off-axis angle of them is almost equal to that of source regions, the contribution of the vignetting effect is negligible in this spectral measurements, and hence we did not apply the vignetting correction. The background-subtracted spectra of MOS1 and MOS2 are shown in figure 3. Since the spectra have no emission line, we fitted them with a model of power-law modified by photo-electric absorption . The cross-sections were taken from Morrison and McCammon (1983). The fittings were statistically accepted for the spectra with the best-fit parameters shown in table 2.
For comparison, we tried fittings with a thin thermal plasma model in non-equilibrium ionization (an NEI model; Borkowski et al. 2001b), and obtained a nearly equal fit. The best-fit parameters of the NEI model are shown in table 2.
| Parameters | Power-law | NEI |
|---|---|---|
| 5.2 (3.9–7.5) | 4.6 (3.4–6.1) | |
| [keV] | 2.2 (1.8–3.0) | 5.2 (3.0–12) |
| Abundanceb | ( 0.35) | |
| log() [cm-3 s] | ||
| Flux | ||
| Reduced (d.o.f.) | 1.14 (46) | 1.19 (44) |
| aParentheses indicate single parameter 90% confidence intervals. | ||
| bAssuming the solar abundance ratio (Anders, Grevese 1989). | ||
| cThe error could not be decided in the region of (1–5) | ||
| which is the limit of XSPEC software. | ||
| dAbsorption corrected flux in the 0.5–10.0 keV band. | ||

4 Analysis of G38.55+0.0
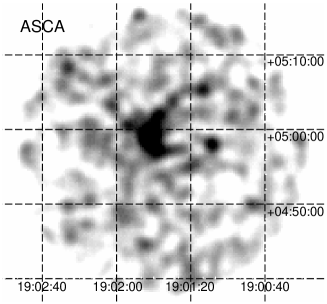
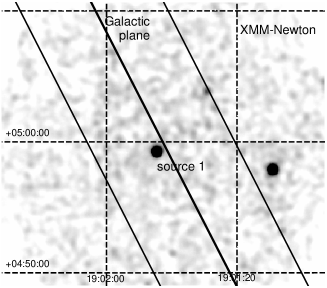
The EPIC/MOS1+2 image in the 2.0–7.0 keV band near G38.55+0.0 is shown in the right panel of figure 4. For comparison, we show the image in the same energy band (2.0–7.0 keV band) near the G38.55+0.0 region in the left panel of figure 4. Although, we can see a structure extending larger than the point spread function (PSF) of (), no significant diffuse emission except some point-sources are found in the - image. A possibility of a group of unresolved point-sources may be excluded, because only one point-source is found near the center of G38.55+0.0 by the - observation of PSF (FWHM). We first extracted the spectrum of the point-source (source 1) at the center of G38.55+ 0.0. The source region was selected from a -radius circle, and the background was taken from an annular region around the source with the inner and outer radii of and . We fitted the background-subtracted spectrum with a power-law model. The fitting was statistically accepted with the best-fit parameters shown in table 3. For comparison, we made the spectrum from a -radius region with a background from an annulus of inner-outer radius of –. The background subtracted spectrum is also fitted with a power-law model. The best-fit parameters are given in table 3. Within the statistical error, we see no significant difference of the best-fit and for the “diffuse” emission and the - point-source emission. However the observed flux of is 5 times larger than that of source 1 in the - image. Therefore one possibility is that there is a “diffuse” component with low surface brightness.
| Parameter | source 1 (-) | 6’-radius region |
|---|---|---|
| 3.3 (2.0–5.3) | 2.0 (1.6–2.6) | |
| 1.7 (1.1–2.7) | 1.1 (0.9–1.3) | |
| Observed flux | ||
| corrected flux | ||
| Reduced (d.o.f.) | 0.295 (5) | 0.912 (19) |
| aParentheses indicate 90% confidence intervals. | ||
| bFlux in the 0.5–10.0 keV band. | ||
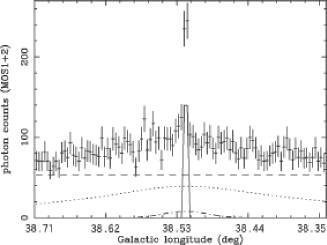
In order to estimate the flux of the putative “diffuse” emission in the - observation, we made a projected profile along the Galactic plane with the width of using the hard band image (2–7 keV, see figure 4). Then the profile is fitted with a model function made under the following assumptions; the non-X-ray background (NXB) is constant in the -field of view, the cosmic X-ray background (CXB) and the Galactic Ridge emission (GRXE) are also constant along the Galactic plane but are modified by the vignetting effect, and the contribution of source 1 is given by a Gaussian profile with the width of PSF. In addition, we approximated the putative “diffuse” emission to be a simple Gaussian of 3 with the center at the source 1 position (see the image). Figure 5 is the projected profile and the best-fit model; NXB is shown with the dash line, the sum of CXB and GRXE is given with the dotted line, and source 1 is shown with the solid line. With this fitting, the flux of the putative “diffuse” emission is constrained to be less than 0.018 counts s-1 (90% upper limit), so this component is undetected in the - observation, unlike observation. A reason for this may be higher particle background than that of observation.
This value is converted to ergs cm-2 s-1 (in 0.5–10 keV), under the power-law model with and , the best-fit parameters of G38.55+0.0.
| component | count ratea | model |
| NXB [counts s-1 deg-2] | 2.8 (1.8–4.0) | constant |
| CXB + GRXE [counts s-1 deg-2] | 2.3 (0.43–4.3) | constantb |
| point-source [counts s-1] | 1.0 (0.68–1.3) | Gaussian |
| diffuse [counts s-1] | Gaussian | |
| aAll count rates are the photon rates in the 2–7 keV band. | ||
| bConstant along the Galactic plane, but is modified by the vignetting effect. | ||
| Parentheses indicate 90% errors. | ||
5 Discussion
5.1 G32.45+0.1
We found a clear shell structure with a radius of in the - hard band (2.0–7.0 keV) image. The X-ray spectrum is well-fitted with either a power-law or a thin thermal plasma model. The thermal model requires the temperature of 3.0–12 keV which is similar to (or higher than) that of typical young SNRs such as Cas A and Tycho’s SNR (T 2–4 keV; e.g., Vink et al. 1996, Gotthelf et al. 2001 (Cas A); Fink et al. 1994 (Tycho’s SNR) ). This model, however, also requires an uncomfortably low metal abundance ( 0.35 solar abundance), compared with Cas A and Tycho’s SNR (2 solar abundance). Thus the spectrum of G32.45+0.1 is likely to be a power-law. The best-fit parameter of =5.2 (3.9–7.5) gives rough estimation of the source distance to be 17 kpc with an assumption that the density in the Galactic plane is 1 H cm-3. Then the X-ray luminosity (0.5–10.0 keV) and the radius are estimated to be ergs s-1 and pc, respectively. These values are not largely different from those of the non-thermal component of SN 1006 ( ergs s-1 and 9.5 pc ; e.g., Dyer et al. 2004).
We found a radio shell at the position of G32.45+0.1 from the NRAO/VLA Sky Survey (NVSS) data at 1.4 GHz (Condon et al. 1998) overplotted with contours in figure 1, although the authors regarded the radio shell as 7 individual (point-like) sources as listed in the NVSS catalogue. The flux sum is Jy. From the shell-like morphology in both the radio and X-ray bands and the X-ray power-law model of photon index of =2.2 (1.8–3.0), G32.45+0.1 is highly possible to be a synchrotron X-ray emitting shell-type SNR. For a discussion of a wide band spectrum, we fitted the X-ray spectrum with an SRCUT model (Reynolds and Keohane 1999). The radio index has not yet been determined, but simple acceleration model predicts the energy index to be 0.5. In fact, the energy index () at 1 GHz of SN 1006, the typical synchrotron X-ray SNR, is reported to be 0.57 (Allen et al. 2001). Thus we tried fitting assuming to be 0.5 or 0.6. The best-fit parameters are shown in table 5.
| Parameters | ||
|---|---|---|
| 5.2 (4.5–6.2) | 5.2 (4.4–6.1) | |
| Cut-off frequency [ Hz] | 3.4 (0.79–91) | 5.4 ( 35) |
| Normc | 0.019 (0.017–0.022) | 0.11 (0.095–0.12) |
| Reduced (d.o.f.) | 1.14 (46) | 1.14 (46) |
| aParentheses indicate 90% confidence intervals. | ||
| bThe fixed value of . | ||
| cThe flux density at 1 GHz [Jy]. | ||
Here the absorption is consistent with the fitting result with the power-law model. Using the values of the cut-off frequency, we can estimate the maximum energy of electrons accelerated by the SNR shock according to Reynolds and Keohane (1999). Assuming the cut-off frequency is Hz, the maximum electron energy () is estimated to be
This result is consistent with the standard picture of the non-thermal SNRs. For example, and of SN 1006 are 20–70 TeV and 3.5–85 G, respectively (Bamba et al. 2003b).
In either 0.5 or 0.6, the predicted flux density at 1.4 GHz is smaller than NVSS result. This apparent inconsistency may be attributable to a non-uniform shell structure. In fact, the radio brightest region show no X-ray shell (see figure 1). This can be interpreted that the X-ray emission is dominated in relatively low region, because the synchrotron energy loss rate is proportional to , and hence the energy loss at the X-ray emitting electron energy may be negligible. The radio shell, on the other hand, may come from a higher region, where energy loss of high energy electron is significant, and hence X-ray is weak. More quantitative study requires spatial resolved X-ray and radio spectroscopy, which is beyond the scope of this paper.
5.2 G38.55+0.0
On the contrary to the results, no significant diffuse emission is detected in the - image of the G38.55+0.0 region. The absorbed surface brightness (2.0–10.0 keV) of the GRXE is at (Sugizaki et al. 2001). Assuming a thin thermal plasma of 7 keV for GRXE (Kaneda et al. 1997), the - count is estimated to be counts s-1 deg-2. The unabsorbed surface brightness of the CXB component (in 2.0–10.0 keV), on the other hand, is (Ishisaki 1996). With the Galactic absorption of cm-2, the count rate is estimated to be counts s-1 deg-2. Then the sum (GRXE+CXB) is counts s-1 deg-2. This value is consistent with the best-fit result of the projected profile in table 4 (2.3 counts s-1 deg-2). Thus our flux estimation based on the model fitting to the projected profile is reliable. We then obtain the absorbed flux upper limit of the putative “diffuse” emission to be ergs cm-2 s-1 (0.5–10 keV band), and the absorbed flux of the resolved point-source to be ergs cm-2 s-1 in the same energy band. Then the sum of these fluxes is ergs cm-2 s-1, which is consistent with the observed flux of G38.55+0.0. We note that no radio counterpart at the position of G38.55+0.0 has been reported. Accordingly, whether G38.55+0.0 is diffuse source or a new SNR is still an open issue.
6 Summary
The results of - observations and analyses of G32.45+0.1 and G38.55+0.0 are summarized as follows:
-
1.
G32.45+0.1 shows a clear shell-like structure in the hard X-ray band.
-
2.
The spectrum of G32.45+0.1 shows a non-thermal feature, and can be fitted with a power-law model of 2.2, which suggests synchrotron X-ray emission from the shell of the SNR.
-
3.
The gives the source distance to be 17 kpc. Then the X-ray luminosity in the 0.5–10.0 keV band and the shell radius of G32.45+0.1 are estimated to be , and 20 pc, respectively.
-
4.
No significant diffuse emission from G38.55+0.0 is detected. The upper limit in the 0.5–10.0 keV band is , consistent with the flux.
We thank all the members of the Galactic plane survey team. M.U. is supported by JSPS Research Fellowship for Young Scientists. This work is supported by a Grant-in-Aid for the 21 century COE, “Center for Diversity and Universality in Physics”.
References
- [1] Allen, G. E., Petre, R., & Gotthelf, E. V. 2001, ApJ, 558, 739
- [2] Anders, E., & Grevesse, N. 1989, Geochim. Cosmochim. Acta, 53, 197
- [3] Aschenbach, B., Briel, U. G., Haberl, F., Braeuninger, H. W., Burkert, W., Oppitz, A., Gondoin, P., & Lumb, D. H. 2000, Proc. SPIE, 4012, 731
- [4] Bamba, A., Ueno, M., Koyama, K., & Yamauchi, S. 2001, PASJ, 53, L21
- [5] Bamba, A., Ueno, M., Koyama, K., & Yamauchi, S. 2003a, ApJ, 589, 253
- [6] Bamba, A., Yamazaki, R., Ueno, M., & Koyama, K. 2003b, ApJ, 589, 827
- [7] Bamba, A., Ueno, M., Nakajima, H., & Koyama, K. 2004, ApJ, 602, 257
- [8] Borkowski, K. J., Rho, J., Reynolds, S. P., & Dyer, K. K. 2001a, ApJ, 550, 334
- [9] Borkowski, K. J., Lyerly, W. J., & Reynolds, S. P. 2001b, ApJ, 548, 820
- [10] Condon, J. J., Cotton, W. D., Greisen, E. W., Yin, Q. F., Perley, R. A., Taylor, G. B., & Broderick, J. J. 1998, AJ, 115, 1693
- [11] De Luca, A. & Molendi, S. 2004, A&A, 419, 837
- [12] Dyer, K. K., Reynolds, S. P., & Borkowski, K. J. 2004, ApJ, 600, 752
- [13] Fink, H. H., Asaoka, I., Brinkmann, W., Kawai, N., & Koyama, K. 1994, A&A, 283, 635
- [14] Gotthelf, E. V., Koralesky, B., Rudnick, L., Jones, T. W., Hwang, U., & Petre, R. 2001, ApJL, 552, L39
- [15] Hwang, U., Decourchelle, A., Holt, S. S., & Petre, R. 2002, ApJ, 581, 1101
- [16] Ishisaki, Y. 1996, Ph.D. thesis, Univ. Tokyo
- [17] Kaneda, H., Makishima, K., Yamauchi, S., Koyama, K., Matsuzaki, K., & Yamasaki, N. Y. 1997, ApJ, 491, 638
- [18] Koyama, K., Petre, R., Gotthelf, E. V., Hwang, U., Matsuura, M., Ozaki, M., & Holt, S. S. 1995, Nature, 378, 255
- [19] Koyama, K., Kinugasa, K., Matsuzaki, K., Nishiuchi, M., Sugizaki, M., Torii, K., Yamauchi, S., & Aschenbach, B. 1997, PASJ, 49, L7
- [20] Morrison, R. & McCammon, D. 1983, ApJ, 270, 119
- [21] Reynolds, S. P. & Keohane, J. W. 1999, ApJ, 525, 368
- [22] Slane, P., Plucinsky, P., Harrus, I. M., Hughes, J. P., Green, A. J., & Gaensler, B. M. 1997, Bulletin of the American Astronomical Society, 29, 1368
- [23] Slane, P., Hughes, J. P., Edgar, R. J., Plucinsky, P. P., Miyata, E., Tsunemi, H., & Aschenbach, B. 2001, ApJ, 548, 814
- [24] Strüder, L. et al. 2001, A&A, 365, L18
- [25] Sugizaki, M., Mitsuda, K., Kaneda, H., Matsuzaki, K., Yamauchi, S., & Koyama, K. 2001, ApJS, 134, 77
- [26] Tanimori, T. et al. 1998, ApJL, 497, L25
- [27] Turner, M. J. L. et al. 2001, A&A, 365, L27
- [28] Ueno, M., Bamba, A., Koyama, K., & Ebisawa, K. 2003, ApJ, 588, 338
- [29] Vink, J., Kaastra, J. S., & Bleeker, J. A. M. 1996, A&A, 307, L41
- [30] Vink, J., Kaastra, J. S., Bleeker, J. A. M., & Bloemen, H. 2000, Advances in Space Research, 25, 689
- [31] Yamauchi, S. et al. 2002, 8th Asian-Pacific Regional Meeting, Volume II, 81
- [32] Yamazaki, R., Yoshida, T., Terasawa, T., Bamba, A., & Koyama, K. 2004, A&A, 416, 595