Dynamics and star formation activity of CG J1720-67.8 unveiled through integral field spectroscopy and radio observations††thanks: Based on data collected at the Anglo-Australian Telescope, Siding Spring, Australia (Proposals PATT/02A/24, PATT/03A/22), at the Magellan Telescope, Las Campanas Observatory, Chile, at the Australia Telescope Compact Array, Narrabri, NSW (Proposal C1026), and at the ESO 3.6 m telescope (Proposal 63-N-0737).
Abstract
CG J1720-67.8 is an ultra compact group of several galaxies with a low velocity dispersion, and displaying the hallmarks of mutual interaction and possible tidal dwarf galaxy formation. In hierarchical models, the system is a possible precursor to a massive elliptical galaxy. In this paper, we use new optical integral field spectroscopic and radio observations to investigate the evolutionary status of the group in more detail: global star-formation rates are estimated using H and 1.4 GHz radio continuum measurements; H i observations provide an upper limit to the global neutral gas content; optical broadband colours and spectra provide ages and stellar mass estimates for the tidal dwarf candidates; the bidimensional H velocity field is used to trace the kinematics of the group and its members, which are compared with numerical simulations of galaxy encounters. The observations suggest a model in which multiple interactions have occurred, with the latest strong encounter involving at least two major components within the last 200 Myr. Debris from the encounter fuels ongoing star formation at the global level of M⊙ yr-1, with self-gravity within the tidal tail possibly providing a mechanism to enhance the star formation rate of the tidal dwarf candidates, with bursts of star-formation in clumps of mass M⊙ appearing within the last 10 Myr. The amount of time required for final merging of all group components remains uncertain.
keywords:
galaxies: evolution — galaxies: interactions — galaxies: starburst1 INTRODUCTION
One of the most important problems in cosmology concerns the formation and evolution of galaxies. Sixty per cent of galaxies are found in groups (Tully, 1987). This fact alone indicates that the group environment is of utmost importance for galaxy evolution. The most recent views of hierarchical structure formation in the Universe involve galaxy groups as building blocks of clusters and as places where interactions pre-process galaxies, which eventually become part of the cluster population (e.g. Mihos, 2004). Due to the high densities and low velocity dispersions (with respect to clusters) that characterize them, compact groups (CGs) of galaxies offer the most favorable environmental conditions for interaction and merging processes to take place and lead to profound galaxy transformations. The evolution of CGs is believed to end in bright elliptical galaxy formation through subsequent mergers (e.g., Kauffmann & Charlot, 1998; Baugh et al., 1998). Therefore, groups can be regarded as putative factories of field elliptical galaxies. This evolutionary scenario is supported by the recent identification of “fossil groups” or “over-luminous elliptical galaxies” in the X-ray domain. More than 10 fossil groups are known to date, although only a few of them have been studied in detail (see e.g., Sun et al., 2004, and references therein). The most likely interpretation of these fossil systems is that they are the end-results of galaxy merging within normal groups (Jones et al., 2003).
However, despite considerable efforts, details of the processes leading from CGs to elliptical galaxies are still uncertain and, particularly, the latest stages of evolution of CGs are profoundly unknown. In fact only very few high density (i.e. evolved) CGs have been found to date. The most well studied sample of CGs is that compiled by Hickson (1982) which encompasses groups in differing evolutionary stages. However, none of these systems can be said to be close to final merging, with the possible exception of HCG 31 (López-Sánchez, Esteban, & Rodríguez, 2004) and HCG 79 which is estimated to achieve final coalescence in less than 1 Gyr (Nishiura et al., 2000). The rarity of highly evolved CGs suggests that, once triggered, the coalescence phase must be relatively short. On the other hand, the fraction of fossil groups with respect to normal groups would point to a relatively slow rate of formation of fossil groups, consistent with the long dynamical friction time-scale of L∗ galaxies (Jones et al., 2003). Hence, apart from the importance of understanding the physical processes prevailing in transition objects, it is of great significance to find and study galaxy groups that show characteristics of a very advanced phase of evolution such as extremely high density and low velocity dispersion.
In recent work (Temporin et al., 2003a, b), we have presented a photometric and spectroscopic analysis of the ultra-compact galaxy group CG J1720-67.8 (Weinberger, Temporin, & Kerber, 1999). The group, characterized by a very high density and the presence of an outstanding tidal tail hosting a number of tidal dwarf galaxy (TDG) candidates, reveals properties indicative of an advanced evolutionary stage. Interpreting its properties in the framework of hierarchical clustering theories would suggest that the group is close to evolving into to a single merged galaxy, although the evolutionary history of this interesting galaxy group is not yet established.
In this paper we present new observations of CG J1720-67.4 both in the optical and radio domain and use them in combination with previously obtained data to advance our understanding of the evolutionary state of the group. In particular, a mosaic of integral field spectra covering virtually the whole extent of the group is used to investigate the group kinematics. New long-slit spectra of the central/southern part of the tidal tail, obtained at the 6.5-m Magellan telescope, serves to further investigate the kinematics of some tidal dwarf galaxy (TDG) candidates. The star formation activity of the group is studied using new H and radio-continuum data. H i observations are used to obtain information on the mass of neutral gas in the group, an additional clue to the evolutionary state of the system. Finally, we investigate the properties of the tidal features by means of photometry.
For a description of data obtained at the ESO 3.6 m telescope with EFOSC2 in the bands and their reduction and photometric calibration, we refer the reader to Temporin et al. (2003a). Our observations and analysis of integral field data, long-slit spectra and radio data are described in Sections 2, 3, and 4, respectively, where results from the individual observations are also reported. Our observational results are used to discuss the star formation activity (Section 5), the structure of the diffuse light and tidal features (Section 6) and the group’s kinematics and dynamics in the framework of its interaction history (Section 6). Our main results are summarised in Section 7.
2 INTEGRAL FIELD SPECTROSCOPY
2.1 Observations and data reduction
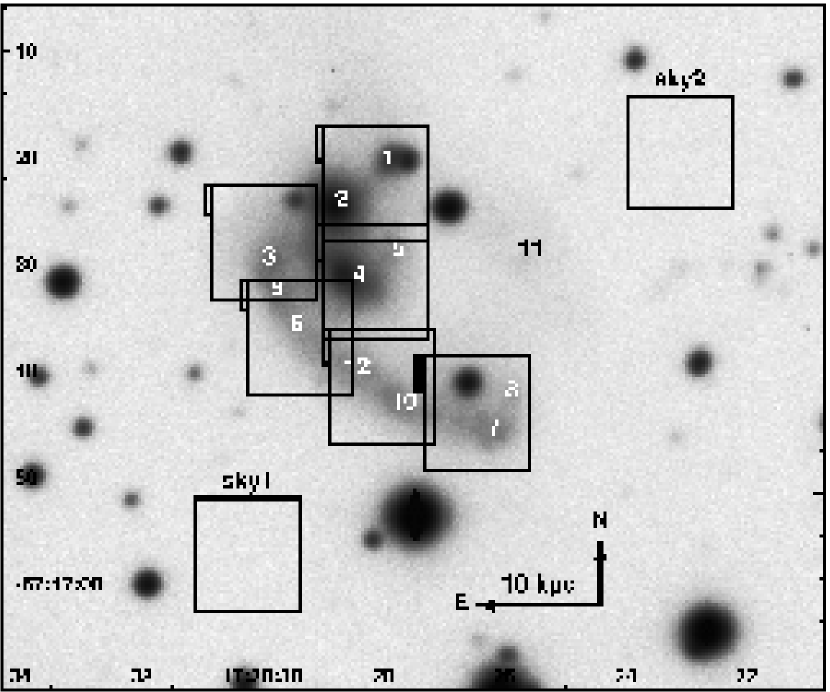
CG J1720-67.8 was observed in the wavelength range 6500 - 7120 Å centered on the redshifted H line and including [N ii] 6548,6583 Å, and [S ii] 6716,6731 Å emission lines. A mosaic of fields was made by combining observations carried out in 2002 June and 2003 June at the Anglo-Australian Telescope equipped with the integral field unit SPIRAL (Segmented Pupil/Image Reformatting Array Lens) and a 600 lines mm-1 grating. The instrument was used in nod-and-shuffle mode111See the SPIRAL data reduction manual written by J. Bailey, available at http://www.aao.gov.au/local/www/spiral/reduction/spiral_reduction.html to obtain optimal subtraction of the sky-background from the target spectra, especially important for the faintest components such as the clumps along the tidal tail. The useful part of the array encompassed 1415 micro-lenses222Each array had 4 or 5 additional micro-lenses, which collected useful signal from the target, but from which the sky-background could not be subtracted., giving a field of view of 9.810.5 arcsec with a spatial scale of 0.7 arcsec per micro-lens per pixel. Spectra were imaged on to the 20484096 13.5 m-size pixel EEV chip, used in 2 by 2 binning mode, giving a dispersion of 0.6 Å pixel-1. The spectral resolution, evaluated from the FWHM of comparison lines was 80 km s-1. The seeing varied between 1.0 and 2.2 arcsec during the observations. Nearly the whole extent of CG J1720-67.8 was covered with 6 pointings of the array (Fig. 1), allowing for sufficient overlapping between adjacent pointings in order to ensure the reconstruction of the mosaic and the consistency of flux calibration. Two series of exposures, alternating sky and target, were taken in each pointing for a total exposure time of 30 min on target and an equal amount on sky. In one of the array pointings, along the tidal tail of the group, an additional series of exposures was taken in order to improve the signal-to-noise ratio. Observations of the spectrophotometric standard stars LTT4364 and LTT9239 were made for flux calibration purposes.
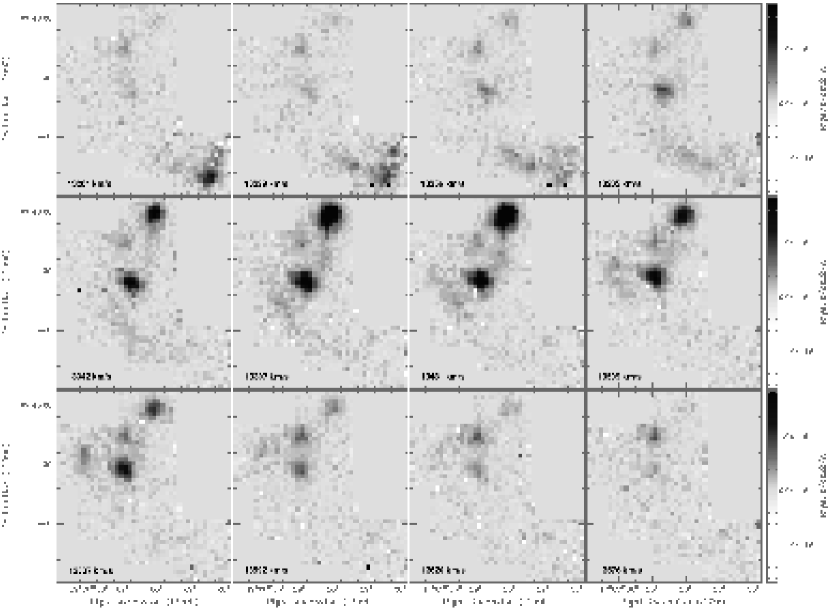
The basic reduction steps, involving the fibre-tracing using flat-field spectra, the extraction of the spectra, dark correction, wavelength linearization, and throughput calibration of the fibres, were done using the 2dfdr software, provided by the Anglo-Australian Observatory. Repeated exposures were combined using iraf333iraf is distributed by the National Optical Astronomy Observatory, which is operated by the Association of Universities for Research in Astronomy, Inc., under cooperative agreement with the National Science Foundation after correction for atmospheric extinction, flux calibration, and the application of a correction for atmospheric telluric absorption bands, particularly affecting the [N ii] 6583 emission-line. A correction for Galactic extinction (AV = 0.29 mag) was also applied. The exact position of the micro-lens arrays on the target (see Fig. 1) was verified by reconstructing a continuum image for each array position and measuring the position of stars and/or galaxy nuclei falling within the field of view. Spectra in the overlapping regions of the arrays were checked for flux calibration consistency. Flux calibration of all arrays were found to be mutually consistent and an average of the spectra from overlapping fibres was used for the mosaic reconstruction. An idl procedure was written to combine the 6 arrays into a final mosaic and iraf scripts for handling of integral field spectra developed and kindly provided by M. Radovich and S. Ciroi were modified to reconstruct images of the whole mosaic at the desired wavelengths. The calibrated and reconstructed images at each wavelength step were combined with the miriad package into a data cube to facilitate the identification of group substructures at different radial velocities (see Fig. 2).
For an easier identification of the structures, we projected our reconstructed maps on to a finer pixel grid (each pixel was projected on to 44 pixels) and smoothed the resulting maps. Such maps were used only for visualization purposes, while measurements were performed on the original data.
A portion of Galaxy 4 including the nucleus was observed in the blue wavelength range ( 4850 - 5470 Å), although under worse seeing conditions (the seeing varied from 2.3 to 2.7 arcsec during the exposures). The total exposure time on target was 1800 s. Unfortunately, mapping of the rest of the group in this spectral range was prevented by unfavourable weather conditions. The reduction steps described above were applied to the blue range as well. The flux calibration was based on the immediately preceding exposure of the spectrophotometric standard star LTT9239. However the sky conditions during the observations were not photometric. Therefore, a check of the flux calibration was necessary. Since the position of the array was slightly offset from the corresponding position in the red wavelength range, the reconstructed maps in the H line and the adjacent continuum were compared to the H line and continuum maps to match the individual spectra in the two ranges. A comparison of the continuum level in the two wavelength ranges showed a considerable discrepancy. Since fluxes in the red part of the spectrum are fully consistent with fluxes of previously obtained long-slit spectra, the discrepancy was attributed to non-photometric sky conditions during the observations in the blue range. A correction was applied to the blue spectra to match the average continuum level in the red part. The spectra so rescaled have H fluxes consistent with those measured from long-slit spectra.
2.2 Measurements and data analysis
2.2.1 Intensity and velocity maps
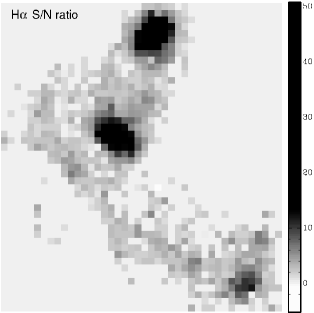
Emission-line positions and fluxes were determined through Gaussian fitting of the lines in the individual spectra. While [N ii] 6548,6583 and [S ii] 6716,6731 were detected only in the spectra with best S/N ratio, H was detected in most of the spectra. A map of the S/N ratio in the H line is shown in Fig. 3. For some portions of the group – namely the region occupied by TDG3+9, Galaxy 4, and the southern part of Galaxy 2 – it was possible to obtain a (very incomplete) map of the emission-line ratio [N ii]/H. In some cases we found [N ii]/H slightly higher than expected for H ii regions, in the range 0.6 - 1.0, which might indicate the presence of shocked gas. The highest values of the emission-line ratio are found in a few positions across TDG3+9, while moderately high values are found mainly in the outer parts of Galaxy 4, at the departure of the small tail on its western side and toward Galaxy 2.
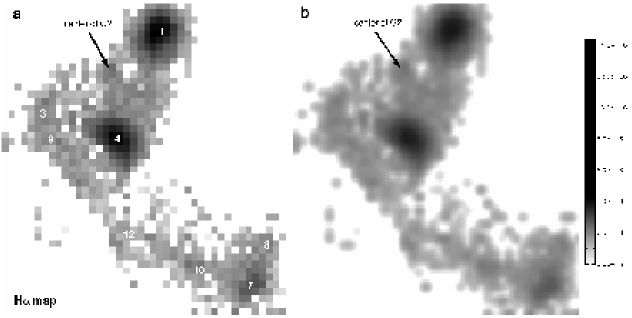
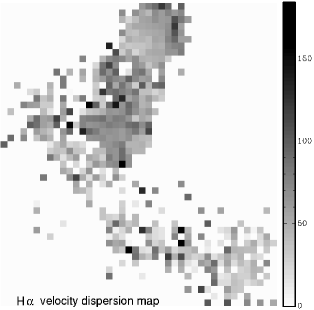
H measurements were used to obtain a map of the group in the emission-line (Fig. 4) and a radial velocity field of the ionized gas. The intrinsic width of the line varied across the objects from instrumental values up to 10 Å. A map of the velocity dispersion of the gas (Fig. 5) was derived from the H FWHM, after correction for the instrumental FWHM, as measured on the comparison spectrum in the relevant fibres, in order to take into account linewidth variations across the array. In some points reaches values 180 km s-1. Interestingly, the highest values of velocity dispersion are found in the central/southern part of Galaxy 2 and in the northern part of Galaxy 4, where the two galaxies partly overlap. The broadening of the emission-line in this region might indicate the presence of an unresolved second component at slightly different radial velocity, originating in Galaxy 2. Additional regions showing particularly high gaseous velocity dispersion are the western side of Galaxy 1, the central part of the TDG candidate 3+9, and a region south of the nucleus of Galaxy 4, where the presence of a clump was evident from previous optical photometry (fig. 5 in Temporin et al., 2003a).
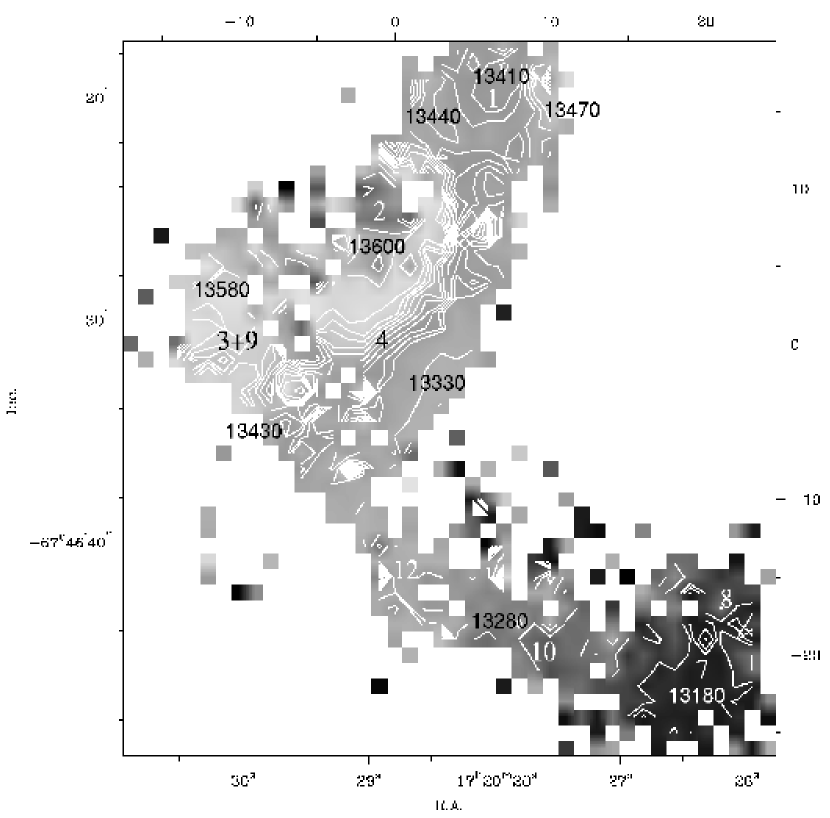
The positions of 6 night-sky emission-lines were measured in every spectrum of the six different arrays and compared with predicted wavelengths. No systematic dependences of the error on the position within an individual array were detected. The median error in radial velocity ranges from 2.3 to 5.1 km s-1 depending on the array considered. Errors in radial velocities are known to depend on the S/N ratio of the lines used for the measurements. We verified that measured position of low-S/N night-sky lines yielded to errors 20 km s-1. We adopt this value as an estimate of our error in radial velocity for regions where the S/N ratio of the H emission-line was particularly low (see Fig. 3). A mosaic of the group’s velocity field (Fig. 6) was reconstructed after application of the relevant heliocentric correction for each array.
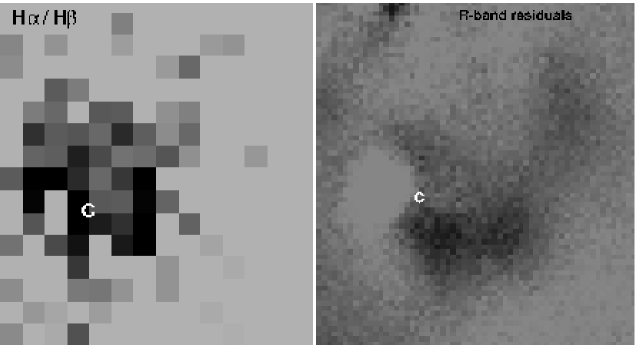
For the portion of Galaxy 4 observed both in the blue and red wavelength range, we were able to obtain a map of the internal extinction in terms of H/H ratio (Fig. 7). The observed ratio has values between 3.5 and 8.5 around the center of the galaxy and is particularly high in regions north-east and south-west of the center, where it varies between 7.0 and 10.5. Assuming a case B photoionized nebula and a Cardelli et al. (1989) extinction law, this translates into a color excess E() in the range 0.2 to 1.3 mag across the galaxy. Extinction estimates become uncertain in the outer parts of the galaxy, where the S/N ratio of the emission lines (in particular of H) decreases. These results confirm our earlier interpretation of the galaxy broad-band color indices (Temporin et al., 2003a). Interestingly, as visible in Fig. 7, the position of highly extinguished regions is roughly coincident with the residual structures observed in broad-band images after subtraction of the best-fitting bi-dimensional galaxy model and interpreted in our earlier work as regions of enhanced star formation.
2.2.2 Analysis of the velocity field
As visible in Fig.6, the entire group appears dominated by the kinematics of Galaxy 4, although, at first glance, the kinematic center seems to be displaced from the photometric center of the galaxy. Galaxy 1 shows the same systemic velocity as Galaxy 4, while the systemic velocity of Galaxy 2 is roughly 200 km s-1 higher. To investigate the kinematics of the three main galaxies, we attempted a fitting of iso-velocity tilted rings to the bi-dimensional velocity field by applying the gipsy task rotcur, following the procedure described by Begeman (1989).
The velocity field of Galaxy 1 shows little gradient and appears significantly distorted. The orientation of the kinematic axis is not clear, although the small velocity gradient observed might indicate a P.A. 160°. By fixing the centre position and disc inclination to photometrically determined values, the fitting procedure gave a rather stable value of the systemic velocity Vsys = 13422 2 km s-1. However the attempting to fit rotational velocities at differing radii produced randomly varying values and hence was not successful. No velocity curve could be derived for this galaxy.
Galaxy 2 shows some velocity gradient, but the ionized gas was detected in too small a region to allow a fitting of the velocity field and the extraction of a velocity curve.
The procedure was successfully applied to Galaxy 4, allowing us to obtain its rotation curve. The fitting was performed in several steps. To limit the number of free parameters we adopted as inclination value for the galaxy = 50° based on our photometric analysis. The systemic velocity was determined as average of the Vsys of individual concentric tilted rings with fixed inclination, centred on the photometric centre of the galaxy. This value, Vsys = 13433.5 13.7 km s-1, was adopted for all rings during the subsequent iterations of the fitting. In the second step we allowed the position of the centre to vary during the fitting, to determine the kinematic centre. The fitted centre position changes for different rings and tends to move away from the photometric centre in a north-west direction along the kinematic minor axis, thus confirming the impression that the kinematic centre is considerably offset with respect to the photometric centre of Galaxy 4. We adopted as the kinematic centre the fitted position for the iso-velocity ring with radius 2.1 arcsec. The offset between the photometric centre and the adopted kinematic centre is 5.9 arcsec. Finally we fitted separately the approaching and receding side of the galaxies maintaining Vsys, , and the centre position fixed. The fitting procedure was performed once with respect to the photometric centre and once with respect to the kinematic centre, only including points within 25°of the kinematic major axis. This choice made it possible to include a sufficient number of points and, at the same time, minimise the contamination by adjacent galaxies. The resulting (de-projected) rotation curve is shown in Fig. 8 for both choices of centre position. The fitting of the approaching side succeeded only up to a radius 4.2 arcsec, beyond which not enough points are available and the contamination by the nearby tidal tail becomes strong. The fitting of the receding side could be extended to a radius of 8.4 arcsec, however for 5 arcsec the curve becomes irregular because of contamination by Galaxy 2, which lies north of Galaxy 4 and partly overlaps to it. The curves obtained with the two different centres are very similar. However the one referred to the kinematic centre is better behaved. The rotation curve is symmetric out to a radius of 2 to 3 arcsec, beyond which the two halves tend to diverge.
In order to estimate the mass of the galaxy we attempted to fit the rotation curve (for radii 5 arcsec) assuming pure circular motion of the gas. Following Bertola et al. (1991) we used as a fitting law for the circular velocity Vc
| (1) |
where the parameters , , and were allowed to vary. The fitting was performed with a least-squares Levenberg-Marquardt algorithm and gave as a result = 265 km s-1, = 2.7 arcsec, and = 1.26 with an rms = 28 km s-1 and a reduced = 1.9. The fitted rotational velocity at = 5 arcsec, where the curve tends to flatten, is Vc(5″) = 148 km s-1. The mass within this radius can be estimated through the expression
| (2) |
which yields M(5″) = (2.2 0.8)1010 M⊙. This estimate of the mass of Galaxy 4 is in good agreement with the value obtained through a comparison of the observations with spectrophotometric evolutionary synthesis models (Temporin & Fritze-v. Alvensleben, 2003).
Since the length of the tail, measured along its spine on the optical images, is 28.8 kpc, a rough estimate of its age is given by ttail 28.8 kpc/148 km s-1 200 Myr, under the assumption that the tidal tail has been launched by Galaxy 4. We note that, since Vc(5″) is only a lower limit to the maximum rotational velocity, the above estimate is an upper limit to the age of the tail. The age of the tail, therefore, suggests a relatively recent interaction. For comparison, the estimated ages of the tidal tails in a sample of merging systems along the Toomre sequence (Toomre, 1977) range between 400 and 770 Myr, the highest value being found for NGC 7252, the system located at the end of the sequence (Knierman et al., 2003; Hibbard et al., 1994). Interestingly, the age of the interaction-induced burst of star formation of Galaxy 4, as estimated from comparison of the observations with spectrophotometric evolutionary synthesis models, is 40 – 180 Myr (Temporin & Fritze-v. Alvensleben, 2003), the oldest age offering a better match to the observations, consistent with the above estimate of ttail.
2.2.3 Total spectra of individual objects
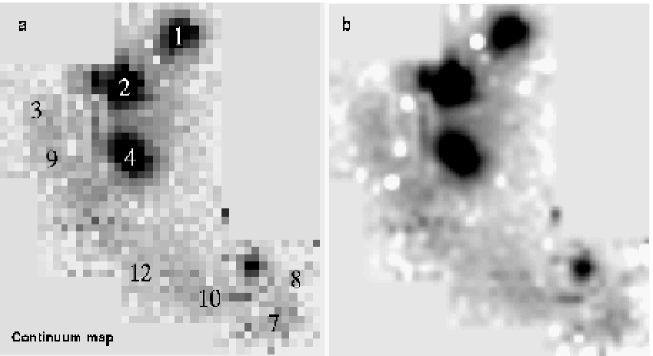
Fibre-spectra belonging to each individual object were identified on the continuum map (Fig. 9), and added together to obtain the relevant total spectra. These are more suitable than long-slit spectra to derive average physical properties of the ionized gas in each object and to estimate the star-formation activity of each galaxy. Relevant measurements are listed in Table 1. The H fluxes in Table 1 are somewhat different from those derived in Section 5.1 through polygonal aperture photometry. These 15 - 20 per cent discrepancies are due to difficulties in the aperture definition in case of partly overlapping sources. The diagnostic emission-line ratios [N ii]/H and [S ii]/H agree, within the errors, with those plotted on fig. 10 of Temporin et al. (2003a). In addition, a comparison of our new measurements of H fluxes with previous ones shows that only in the case of Galaxy 4 slit-spectra significantly underestimated (by about 67 per cent) the total flux, while for the other galaxies the bulk of the flux fell within the slit. Therefore star formation properties of the individual objects remain unaltered with respect to our earlier claims, with the exception of Galaxy 4, for which a total star formation rate twice as high as the previously determined one is suggested (i.e. 3 M⊙ yr-1, after correction for internal extinction).
An integrated spectrum of Galaxy 4 was obtained in each wavelength range by adding up all spectra covering the same portion of galaxy in both ranges. We measured an average internal extinction E() 0.6 mag, consistent with that obtained from long-slit spectra (Temporin et al., 2003a, table 2). The presence of dust patches causing extinction in excess of the average E() determined for the galaxy (Section 2.2.1) suggests that the overall H luminosity and star formation rate of the galaxy might be somewhat underestimated even after the application of an average internal extinction correction.
3 LONG-SLIT SPECTROSCOPY
3.1 Observations and data reduction
A new long-slit spectrum, across the clumps in the southern part of the tidal tail of CG1720-67.8 (position angle 735), was obtained in 2002 May at the Magellan 6.5-m telescope (Las Campanas Observatory). This spectrum complements the data previously obtained in other regions of the group, and already described in Temporin et al. (2003a, b). The 1800 s exposure was taken through a 72.01.25 arcsec slit with the Boller and Chivens spectrograph and a 600 lines mm-1 grating, and imaged on to a 2048515 13.5-m pixel CCD. This configuration gave a dispersion of 1.557 Å pixel-1 in the wavelength range 3780 - 6970 Å, a spectral resolution of 6.8 Å (FWHM), and a spatial scale of 0.25 arcsec pixel-1. The seeing at the time of the observations was 1.2 arcsec.
The usual reduction steps: bias subtraction, flat-fielding, and wavelength calibration, were carried out on the bi-dimensional spectrum with standard iraf packages, while the iraf script l.a.cosmic444Available at http://www.astro.yale.edu/dokkum/lacosmic/ (van Dokkum, 2001) was used for cosmic ray rejection. An average sensitivity curve obtained from three exposures of the standard star CD32d9927, taken during the same night, was used for the absolute flux calibration. The spectrum shows the usual Balmer hydrogen emission-lines, [O ii] 3727, [O iii] 4959,5007, He i 5876, [O i] 6300, and [N ii] 6548,6583.
3.2 Measurements and data analysis
Individual emission regions were identified on the continuum-subtracted H emission-line profile along the slit (Fig. 10). Some of them are portions of the TDG candidates found in the central and southern parts of the tidal tail (Temporin et al., 2003b). We labelled these regions according to our previous papers (see also Fig. 1) although we must stress that the spectra previously obtained sampled different parts of these clumps, hence emission-line fluxes (and ratios) are not expected to be exactly the same. An additional, fainter emitting region, labelled ‘13’ is visible in the spectrum and appears to correspond to a faint clump lying to the east of object 12. One-dimensional spectra of the individual regions were extracted and corrected for Galactic extinction (AV = 0.29 mag). Once the spatial coverage of the slit has been taken in to account,the fluxes of the detected emission-lines are in reasonable agreement, as an order of magnitude, with those measured on integral field data, therefore we do not quote them.
The emission-line ratios obtained with the new spectrum confirm the physical conditions and metal abundances (ionization parameter U 3, Z 0.2 - 0.3 Z⊙) already suggested for the TDG candidates, with a tendency for TDG 7+8 toward lower metallicities. An interesting outcome of the new observations concerns the distribution of dust across the star-forming clumps. In fact considerable variations of E() along the slit reveal an unhomogeneous distribution of dust in the southern part of the tidal tail, as shown in Fig. 11. In particular, we observe a variation of E() from 0.0 to 0.2 mag in the region occupied by TDG 7. The Balmer decrement on a spectrum across the same object but at a different position angle gave E() 0.4 mag (Temporin et al., 2003a).
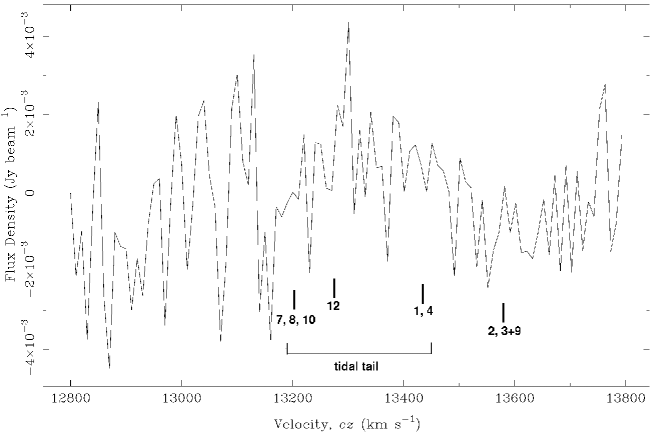
The brightest emission lines were used to obtain independent radial velocity measurements along the slit by binning the spectrum along the spatial direction according to the seeing. The resulting radial velocity trend is shown in Fig. 12 and will be further discussed in Section 7.2. Errors in radial velocity are estimated from the average shift of night-sky lines with respect to the expected wavelengths along the slit. Sub-regions marked in Fig. 12 do not necessarily indicate distinct objects; in fact there is no clear kinematic distinction between them. However, it is interesting to note that there are kinematic discontinuities between the different clumps cross-identified with TDG candidates. Within each clump we observe regular velocity gradients, sometimes reversed with respect to the general velocity gradient observed along the tidal tail, visible in Fig. 12 and, more clearly, in the velocity field of Fig. 6. Within the clumps we measured velocity gradients of order of 20 km s-1 kpc-1, similar to gradients observed by some authors in other TDG candidates (e.g., Mendes de Oliveira et al., 2001).
4 RADIO OBSERVATIONS
4.1 H I observations
Observations were made in 2002 January 17 and February 25 with the 750A and 1.5A configurations of the Compact Array555The Compact Array is part of the Australia Telescope which is funded by the Commonwealth of Australia for operation as a National Facility managed by CSIRO, respectively. The integration time was hrs, and the frequency of the redshifted H i line was predicted to lie at 1359 MHz. The bandwidth was 8 MHz, and the channel spacing was 15.6 kHz. Images were made using ‘natural’ weighting, resulting in a beam size (FWHP) of around 44 39 arcsec. The rms noise was 1.5 mJy beam-1 when the data were smoothed to 10 km s-1 (close to the theoretical value) and 0.5 mJy beam-1 when smoothed to 200 km s-1. No H i emission was detected anywhere in the velocity range to 13800 km s-1 (see Fig. 13). We estimate an 3- upper limit to any emission (assuming a velocity width of 200 km s-1) of 0.3 Jy km s-1. At a distance of 180 Mpc, this corresponds to M M⊙. The observational parameters are summarised in Table 2, and the results are summarised in Table 3.
4.2 Radio continuum observations
Radio continuum observations were made at a frequency of 1384 MHz on 2002 January 17 and February 25 with the 750A and 1.5A configurations of the ATCA (simultaneous with the H i observations described above). Additional observations were taken in two sessions on 2003 August 4 and 5 using the 6D configuration. On the first day, two frequencies centered at 4800 MHz and 8640 MHz were observed simultaneously over 12 hrs. On the second day, we switched between two pairs of frequencies at 5184 and 5952 MHz and 1384 and 2368 MHz over the observing period of 11 hrs. In each case, the bandwidth of the radio continuum observations was 128 MHz, and full polarimetry was obtained. As for the H i observations, the secondary (phase and amplitude) calibrator was PKS B1718-649, and the primary (flux scale) calibrator was PKS B1934-648. The observational parameters are summarised in Table 2.
Images were made using ‘uniform’ weighting at 1384 MHz. But, for maximum sensitivity, the images were made with ‘natural’ weighting at other frequencies. The beamsize and RMS noise at each frequency is listed in Table 4. In each case, CG J1720-67.8 was detected. At 1.4 GHz, the integrated flux density is 4.2 mJy. At 5 GHz, the integrated flux density is around 1.1 mJy, or slightly higher (the smaller beam and lower S/N ratio means that some extended emission will not have been included). This implies a spectral index () of , consistent with synchrotron radiation.
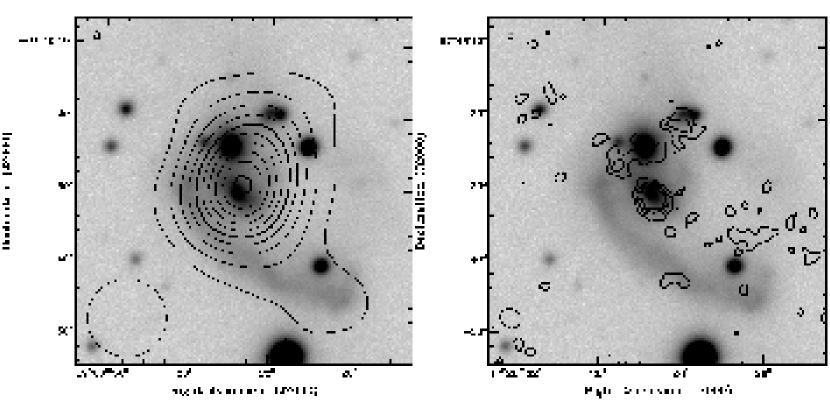
As Fig. 14 and Table 4 show, the emission at all frequencies peaks at 17h20m28s.8, 67°46′31″ (J2000), which is within 1 arcsec of the optical centroid of Galaxy 4 (Temporin et al., 2003a). The 1.4-GHz image shows a significant extension of the radio source to the north towards Galaxy 1, but the outer contours also reveal a contribution from Galaxy 2, which is seen more clearly in the 5-GHz image. At 1.4 GHz, there is also a significant emission (approximately 0.2 mJy) from the faint candidate TDG 7 at the end of the tidal arm.
5 STAR FORMATION
5.1 Overall star formation properties of CG J1720-67.8
The total observed H flux of the group, determined by adding up the fluxes from each pixel in the H map (Fig.4) is F(H) = 9.5 10-14 ergs s-1 cm-2. At the distance of the group, d = 180 Mpc, this gives the luminosity L(H) = 3.7 1041 ergs s-1. Note that this luminosity is not corrected for internal extinction, therefore it is to be considered as a lower limit to the H luminosity of the group. The value is slightly higher but consistent with our previous measurements based on long-slit spectroscopic observations which give a combined H luminosity of 3.3 1041 ergs s-1 for the condensed components (galaxies, tidal features, tidal dwarf candidates) in CG J1720-67.8 (Temporin et al., 2003a, tables 2 and 3). The internal extinction values determined from the Balmer-decrement in the long-slit spectra give an average color-excess = 0.50.2 mag. This, applied to the total observed flux, yields an extinction-corrected total luminosity L(H)corr = 1.2 1042 ergs s-1, which translates in to a total present-day star-formation rate (Kennicutt, 1998) SFR = 10 M⊙ yr-1 over the stellar mass range 0.1 – 100 M⊙.
This is somewhat lower than the value of 42 M⊙ yr-1 derived from the far-infrared flux (Temporin et al., 2003a). It is possible that the H extinction has been greatly underestimated. On the other hand Temporin et al. (2003a) note that far-infrared measurements in the vicinity of CG J1720-67.8 are confused by infrared cirrus. However, it has also been pointed out by Bothun, Lonsdale, & Rice (1989) that the 60-to-100 m flux density ratio f60/f100 can be used as an indicator of the dust heating source, and therefore the efficacy of far-infrared flux as an estimator of SFR. The ratio for CG J1720-67.8 is f60/f100 = 0.3 0.1, which is closer to the range f60/f100 0.3 where dust heating is dominated by the diffuse interstellar radiation field of old disc stars, than the range f60/f100 0.5 where heating is entirely dominated by the UV radiation from young stars, and where far-infrared flux is a good SFR indicator. This suggests that the far-infrared-derived SFR may be an upper limit.
As discussed by many authors (e.g. Cram et al., 1998), radio flux densities of galaxies without AGN activity provide yet another method of estimating star-formation rate, but without the problems of extinction. At 1.4 GHz, the total flux density of 4.2 mJy translates in to a star-formation rate of 18 M⊙ yr-1 using the relationship established by Condon (1992) and Haarsma et al. (2000) with . This is slightly less than double the H-derived SFR and slightly less than half of the far-infrared-derived SFR. The discrepancy between the radio and H-derived SFRs appears to be no more than the scatter observed in other local galaxies (Cram et al., 1998), and the total extinction of mag, required to make the radio and H SFRs in exact agreement, compares reasonably with the Balmer-decrement value of = 0.50.2 mag.
Total H fluxes of the individual group components can however be obtained from the final map with better resolution than the radio data allow. We measured separately the main tidal tail (including the candidate TDGs), galaxies 1, 2, and 4, and the secondary short tidal tail west of Galaxy 4 (including object 5) by means of polygonal apertures. An estimate of the average underlying continuum flux in the same apertures was measured on a continuum map obtained by averaging fluxes on the two sides of the H line in a 19Å-wide band and used to evaluate the H equivalent width of the tails. Fluxes, luminosities (not corrected for internal extinction), and equivalent widths (EW) are given in Table 5. It is worth noting that the tidal tail contributes 31 per cent of the total H luminosity of the whole group, and 38 per cent of this amount (i.e. 12 per cent of the group luminosity in the emission line) stems from the southern end of the main tidal tail where TDG7+8 is located. This object and Galaxy 1 have the highest EW(H), 275 and 141 Å, respectively. All other objects show relatively low equivalent widths.
5.2 Star formation history of the TDG candidates
Our previous analysis of optical colors (Temporin et al., 2003b) indicated a young age (7 to 20 Myr) for the burst of star formation in the TDG candidates embedded in the tidal tail. In the attempt to obtain a better estimate of the burst age, we now take into account the additional information given by long-slit and integral field spectra and we compare our observations with starburst99 evolutionary synthesis models (Leitherer et al., 1999). This is a qualitative comparison, not a fitting procedure and is only meant to provide a rough indication of the burst age of the TDG candidates, useful to our understanding of the evolution of the system. Modelling the star-forming clumps would require that the presence of the underlying older stellar populations stemming from the parent galaxy be taken into account, since it contributes to the observed spectra. This is beyond the scope of this paper. For the comparison of optical colors with the models we use our measured magnitudes after subtraction of the contribution of the tidal tail (Temporin et al., 2003b).
Total spectra of the objects obtained with integral field data (Section 2.2.3) have too small a spectral range to be compared with synthetic spectra. However they are useful for estimating the H equivalent width of the objects (Table 1) and to determine a scale factor for slit-spectra to compensate for limited spatial coverage. While the total flux of the continuum of TDG 7+8 is not significantly different from that measured on slit spectra, for TDG 10 and TDG 3+9 we measured fluxes a factor of 2.0 and 1.6 higher than in the slit-spectra taken at positions 10 and 9, respectively. A correction for internal extinction was applied before comparison with the synthetic spectra. This proved particularly difficult for TDG 7+8 because of the patchy distribution of dust across it (see Section 3.2). For this object we chose to compare the models with both the spectrum obtained at the ESO 3.6-m telescope and that obtained at the Magellan telescope. The first is the sum of the spectra at positions 7 and 8, and has been corrected for extinction using the average E(BV) = 0.28 mag; the latter includes only object 7 and its extinction correction was based on the average value measured along the slit, E(BV) = 0.15 mag. The two dereddened spectra are very similar, apart from a scale factor in luminosity. In addition, there appears to be a small metallicity gradient across the regions sampled by the two spectra.
For TDG 3+9 we used the slit-spectrum at the position 9 (which has a better signal-to-noise ratio than that at the position 3), corrected for the relevant E(BV) and scaled in intensity to match the total continuum flux measured on the integral field data. The spectrum of TDG 10 was prepared in a similar way.
For comparison, we chose models666We used the dataset available at http://www.stsci.edu/science/starburst99/ simulating an instantaneous burst with a Salpeter initial mass function between masses Ml = 1 M⊙ and Mu = 100 M⊙ and metallicities Z = 0.004 ( 0.2 Z⊙) and Z= 0.008 ( 0.4 Z⊙), thus approaching those measured in our spectra (Z = 0.2 - 0.3 Z⊙). Models, calculated for a total mass of 106 M⊙ and including the nebular continuum, have been scaled to match the observed, extinction-corrected luminosity. Since the luminosity scales with the mass, the comparison with the models gives us a rough idea of the mass of the TDG candidates.
We find that measured H equivalent widths are in agreement with models calculated for burst ages between 5.5 and 8.5 Myr, with the exception of TDG 12, whose lower EW(H) is consistent with an age of 10 Myr. Optical colors, after correction for internal extinction, are in rough agreement with the same age interval. Out of the spectral energy distributions calculated with the above constraints, those showing reasonable agreement with the spectra of TDG 7+8 and TDG 3+9 are the models for ages of 6 - 8 Myr and metallicities Z = 0.004 - 0.008. The models are overplotted on spectra in Fig. 15. In particular, TDG 7+8 (and especially the spectrum at the position 7) appears to be in good agreement with the model at lower metallicity and age 8 Myr, for a total mass of 1.8107 M⊙. TDG 3+9 is in better agreement with the higher metallicity 6 Myr model and a mass of 2.3107 M⊙. The same 8 Myr model reproduces the continuum of TDG 10 reasonably well (with mass 2.0107 M⊙). However this object shows deeper Balmer absorption lines than the model, suggesting a non-negligible contribution by an older stellar population. In fact, a 50 Myr model better reproduces the continuum in the red part of the spectrum and the Balmer absorption lines (although not the continuum at the blue end of the range, nor the H equivalent width).
Finally, the continuum and the strong Balmer absorption lines of TDG 12 are in good agreement with a 60 Myr synthetic spectrum. The scale factor in luminosity with respect to the model would imply a mass of 1.1108 M⊙, an unlikely high value in our opinion. The EW(H) for this model is far lower than that observed. The comparison process is made even more difficult by the higher uncertainty on the internal extinction of this clump with respect to the others. We speculate that, in this case, there might also be a superposition of a relatively young and old stellar populations. We note that the TDGs in the central part of the tail (objects 10 and 12) are those with the highest contribution to the optical broad band fluxes from the tidal tail (Temporin et al., 2003b).
To summarise, most clumps have properties suggesting ages of their most recent burst of star formation in the range 6 to 8 Myr with total masses of 2107 M⊙.
6 LIGHT CONTRIBUTED BY TIDAL MATERIAL
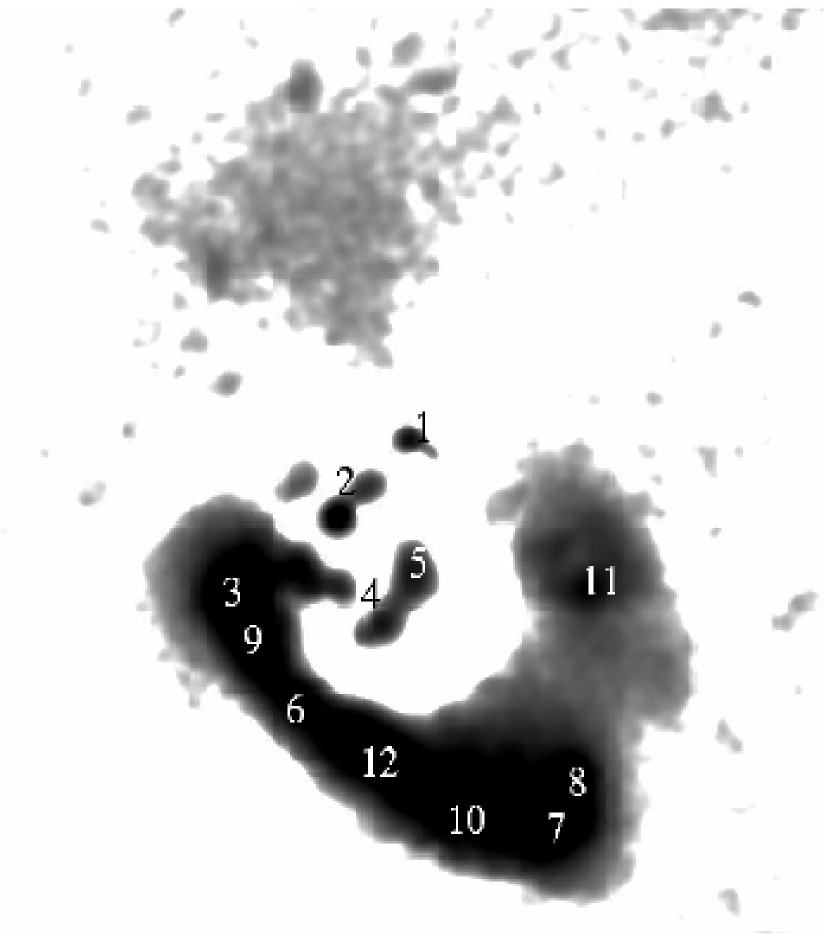
As noticed above, the main tidal tail considerably contributes to the H luminosity of the group. From our optical broad-band images (ESO 3.6 m telescope -exposures, see Temporin et al., 2003a, for a full description of the data and the reduction steps) we are also able to estimate the contribution of this tidal tail and other tidal material/ faint diffuse light to the total luminosity of the system. For this purpose the best-fitting galaxy models (obtained as described in Temporin et al. (2003a)) were subtracted from the optical images and foreground stars were subtracted by means of a point-spread-function fitting procedure with daophot (Stetson & Harris, 1988). A bi-dimensional fit to the background was also subtracted, and the images were edited to mask saturated stars and residuals left over by the star-subtraction procedure. The and -band images were convolved with a Gaussian to match the seeing of the band image. The resulting images reached a surface brightness limit (3 level) of 26.9 mag arcsec-2 in and 26.0 mag arcsec-2 in . A smoothing of the -band image with a 3-pixel box-car median filter allowed us to reach a sensitivity similar to the other bands, with a 3 brightness limit of 26.3 mag arcsec-2. The diffuse and tidal light distribution is marginally affected by two bright stars located at the boundaries of the features of interest. These regions were masked. Isophotal contours are more uncertain in the vicinity of the masked regions, but measurement of the total light of the tidal features is not significantly affected. According to Poissonian statistics, and taking into account the smoothing, we estimated errors of order 0.01 mag. As in the case of galaxy magnitudes, the calibration error ( 0.05 mag) is dominant. We find that the tidal material as a whole represents about 31, 27 and 25 per cent of the total luminosity of the system in , , and , respectively. The material, including what was previously indicated as an irregular halo of diffuse light, appears mainly organized in three substructures, namely i) the arc-shaped prominent tidal tail, ii) a fainter tail-like feature including object 11 and extended from north-west to south, reaching (or possibly crossing in projection) the southern part of the brightest tail, and iii) some diffuse light arranged in a cone-like shape extending north-ward with the apex next to the center of Galaxy 1. The latter structure is detected only at 3-level in the image, while is visible above 4 in the and images. Fig. 16 shows the structures brighter than 4 (26.6 mag arcsec-2) in the -band; residual light from galaxy-model subtraction is also visible, and has been taken into account when calculating the total luminosity of the system. The highest contribution to the total luminosity is given by the bright tidal tail. The total magnitudes of the three tidal features (measured within the 4-level isophote) and their percentage contribution to the total luminosity of the galaxy group are listed in Table 6. We notice that the two tails contribute to the total light in slightly decreasing percentage from to , while the opposite is true for the cone-like feature, which shows also a widening in the and images. The dominance of an older stellar population in this last component might provide an explanation.
7 EVOLUTIONARY STAGE OF CG J1720-67.8
7.1 Possible encounter geometries
Tails and bridges in interacting systems commonly have a gravitational origin, as was demonstrated by Toomre & Toomre (1972). The kinematics of tidal tails can be used to infer the approximate spin geometry of a galaxy encounter (e.g. Hibbard & van Gorkom, 1996; Mihos & Bothun, 1998). Here we use the information from the H velocity field of CG J1720-67.8 together with the other observational results to speculate about the encounter geometry of its members. In the following we summarise and discuss the kinematic and star-formation properties of the galaxy group and propose a few possible scenarios for the interaction history that gave it its present configuration. Our interpretation is also based on the comparison with observations and numerical modelling of other merging systems from the literature, however adequate numerical simulations specially devoted to model this system are necessary to establish the validity of any of the suggested scenarios. We postpone the comparison with detailed simulations to a future work.
The appearance of CG J1720-67.8 is dominated by a bright tidal tail in which several star-forming clumps are embedded. The continuous kinematic trend along this tidal tail across the clumps (Fig. 6) suggests that these clumps are indeed associated with the tail and not projected on to it. Some systems show signs of return of tidal material to the progenitor galaxy’s main body (e.g. NGC 7252, Hibbard et al., 1994) and numerical simulations have confirmed this fate for the tidal material more tightly bound to the progenitor (e.g. Hibbard & Mihos, 1995; Barnes & Hernquist, 1996). In our data there is no evidence of return of tidal material. In fact the tidal tail is estimated to be younger than 200 Myr and most likely even the bound tidal material closest to the galaxy’s main body has not yet inverted its motion. The velocity field of the group shows a global trend, with the kinematic axis coincident with that of Galaxy 4. However the global kinematic centre has a 5.9 arcsec offset with respect to the centre of this galaxy. We interpret this offset as an effect of the interaction with one of (or both) the companion galaxies. The asymmetry of the velocity curve of Galaxy 4 at radii 3 arcsec supports the idea that the kinematics are influenced by the interaction.
Galaxy 1 has an anomalous velocity field and shows little rotation, if any. Its recessional velocity is comparable to the systemic velocity of Galaxy 4. We note that a bridge emanates from Galaxy 1 toward Galaxy 2 (in projection) and, according to the velocity field, a bridge of ionized gas, at systemic velocity, seems to connect Galaxies 1 and 4.
In prograde major mergers between disc galaxies the formation of two opposite tidal tails (one per galaxy) is expected, while in retrograde mergers the formation of well defined tails would be suppressed in favour of plumes (as shown in Toomre & Toomre, 1972; White, 1979). A strong response in the disc, hence the formation of long and robust tidal tails, requires a small impact parameter, although not too small otherwise the merging would occur before long tails had the time to develop (Barnes, 1992). Since tails are formed only after pericentre passage, the galaxies in CG J1720-67.8 must have already passed the pericentre of their orbits at least once. The fact that CG J1720-67.8 has only one long, bright tidal tail, without a strong counter-tail, and exhibits a second faint tail and a cone-like plume suggests that either a prograde-retrograde encounter, with small impact parameter, has taken place – i.e. only one of the galaxies had the spin vector (roughly) aligned with the orbital angular momentum vector – or one of the interacting galaxies was gas-poor. Since the strong tail is actively forming stars – it hosts blue clumps whose latest bursts of star formation are likely to have occurred 6 to 8 Myr ago and it is responsible for 31 per cent of the H luminosity of the group – it must contain a considerable amount of gas, hence it has likely been produced by a gas-rich galaxy. The most likely progenitor is Galaxy 4, the spiral galaxy to which the tail appears to be connected. As a consequence, we can assume that the direction of the orbital angular momentum vector is concordant with the spin vector of Galaxy 4. Since the tail is quite broad, our observational viewpoint is likely to be approximately above the orbital plane.
Which role did Galaxies 1 and 2 play in this encounter? Were they both involved in the interaction that produced the strong tail, and if not, which one is the close interacting companion of Galaxy 4? We try to address these questions by considering the star formation activity and its distribution in the group.
The H emission indicates that star formation activity is present all across the bodies of Galaxies 1 and 4 (although it peaks in their central parts), in the centre of Galaxy 2, all along the strongest tidal tail, in the bridges (at low level), and at least in one clump in the faint tail. We do not have information about star formation in the plume, however this feature is redder than the other tidal debris. The emission in the continuum at 1.4 GHz, which is a good tracer of star formation and in contrast to H is not affected by extinction, peaks at the position of Galaxy 4 and extends to the other two galaxies and to the tail (with a secondary peak at its southern end). A number of numerical simulations (e.g., Noguchi, 1988; Barnes & Hernquist, 1991, 1996; Mihos, Bothun, & Richstone, 1993; Mihos & Hernquist, 1994) have shown that merger events drive large quantities of gas from the disc to the centre of galaxies inducing a central burst of star formation. Such a process could account for the star formation at the centre of the early-type Galaxy 2 which appears to be a dying merger-induced starburst. Mihos, Richstone, & Bothun (1992) found that star formation rates in merging galaxies can be increased by an order of magnitude for several times 108 years with most star formation activity located in the central region of the merging galaxies. In their close-encounter simulations, both prograde and retrograde mergers lead to strong bursts of star formation. In retrograde mergers the burst begins in the individual discs while they are still separated and continues as the gas falls into the central regions of the merger. Such a situation could be representative of Galaxies 1 and 4. The high velocity dispersion of the gas observed at the base of the tidal tail and in some parts of the galaxies in connection with regions of star formation (Section 2.2.1), might indicate that collisionally triggered star formation is taking place. Collisions in the inter-stellar medium, of interacting galaxies have been indicated by Mihos, Bothun, & Richstone (1993) as a second trigger of star formation in interacting galaxies, in addition to the increased gas density. On the basis of the above description regarding the tidal tails and bridges, the kinematics and the star formation, we argue that Galaxy 1 is likely to be the retrograde interacting companion of Galaxy 4. This view agrees with the results of evolutionary synthesis modelling of the galaxies (Temporin & Fritze-v. Alvensleben, 2003), which indicate an age of 180 Myr for the interaction-induced bursts in both galaxies, consistent with estimated age of the strong tidal tail. In this case the cone-like plume could have originated from Galaxy 1. Assuming that the R-band luminosity of the two galaxies roughly traces their masses, this would be a minor merger, with an approximate mass ratio 4:1 for Galaxy 4: Galaxy 1.
As an alternative possibility, the second faint tail and/or the plume are the result of a previous encounter possibly involving Galaxy 2. No active star-formation is detected in these fainter tidal structures, except for the presence of a ring-like feature encompassing the blue clump no. 11 with no detected H emission. Since Galaxy 2 has a de Vaucouleurs bulge and a weak disc component and exhibits active star formation in its central parts (although at low level), we suggest the possibility that Galaxy 2 is the remnant of a relatively recent merger. If this were the case, the central star formation could be interpreted as the remains of a burst triggered during the merging phase. The faint tail and plumes could be the tidal debris of such a merger, most probably involving two relatively gas-poor galaxies (e.g. two early-type spirals).
To summarise, we suggest the following possible interaction scenarios that could lead to the present configuration of CG J1720-67.8:
-
1.
Galaxy 2 is a merger remnant, responsible for the faint tail and plume. This merger is in excess of 500 Myr old, since the bulge of the galaxy has had time to relax to a de Vaucouleurs profile and the merger-induced burst of star formation has already faded. Galaxies 1 and 4 have recently undergone a close passage, which has produced bursts of star formation in both galaxies and the formation of the prominent blue tidal tail as well as a bridge departing from Galaxy 4 toward Galaxy 1. This view is additionally supported by the fact that the two galaxies have similar systemic velocities and both of them exhibit evidence of a recent episode of star formation involving a big fraction of their bodies. An interaction of both galaxies with Galaxy 2 might be underway, as suggested by the presence of the bridge of matter departing from Galaxy 1 toward Galaxy 2 and the possible bridge between Galaxies 2 and 4.
-
2.
Galaxy 2 was an early-type galaxy to start with and has recently undergone a close interaction with Galaxies 1 and 4. As a consequence of this interaction, Galaxy 4 launched a strong tidal tail and a bridge, Galaxy 1 launched a faint tail (retrograde encounter?) and a small bridge, and Galaxy 2 gave origin to the cone-like plume extending to the north. The encounter drove some gas from the disc to the center of the gas-poor Galaxy 2, which started a small episode of star formation, while stronger episodes of star formation were triggered in the gas-rich Galaxies 1 and 4.
The information derived from our observations is not sufficient to unambiguously establish the interaction history of the system. The above scenarios cannot be proven without encounter simulations specifically suited to reproduce the observed geometry of the galaxy group. Hence, at this level, they remain hypotheses that require verifying. From observational data alone, we cannot yet establish what the future outcome of this system will be, although the small separation of the galaxies in space and the strong interactions they are undergoing suggest that the group will merge in a relatively short time.
7.2 Kinematics of TDG candidates
As discussed above, the velocity field of the group shows a regular gradient along the tidal tail. No particular kinematic structures are detected at the position of the TDG candidates, except for the strong gradient at the position of TDG3+9, already reported in Temporin et al. (2003b). However, local velocity gradients of order of 20 km s-1 kpc-1 have been found in the long-slit spectrum across the southern part of the tail (Section 3.2). These results may be reconciled when one considers that the seeing conditions during integral field observations of southern part of the tail were poor and would thus tend to smear out small local velocity gradients. Additionally, the H S/N ratio along the tidal tail is quite low (see Fig. 3), which means that the error in velocity measurements is of order of 20 km s-1 (Section 2.1), sufficient to hide such small velocity gradients. Although we still lack a proof of self-gravitation for our TDG candidates, we believe that the observed local gradients and the kinematic discontinuities might suggest distinct kinematics in the individual clumps on top of the velocity gradient of the tidal tail.
7.3 Additional indications of the evolutionary stage
Indications of the evolutionary stage of a galaxy group can come from the estimate of its neutral hydrogen content. In a homogeneous sub-sample of 48 Hickson Compact Groups (HCGs, Hickson, 1982), Verdes-Montenegro et al. found a mean H i deficiency Def with respect to the expected H i content for the optical luminosities and morphological types of the member galaxies and proposed an evolutionary scenario in which the amount of detected H i would decrease with evolution by continuous tidal stripping and/or heating. However, for the triplets in the HCG sample, they found that the H i deficiency is not significant (Def = 0.19 0.10). They argued that these triplets could be either unreal or unevolved systems. We followed the same method (Haynes & Giovanelli, 1984) to determine the Def parameter for CG J1720-67.8. Our H i observations failed to detect emission at the position of CG J1720-67.8, so we compare the upper limit M M⊙, estimated in Section 4.1, with the expected H i content of the system as well as with the amount of H i found in other well studied interacting/merging systems. Taking into account the extinction-corrected B-band magnitudes and the morphological types obtained from our photometric measurements Temporin et al. (2003a), we determined the expected H i masses for the individual galaxies and used their sum as the predicted H i content of the whole galaxy group, M = 4.9 109 M⊙. This yields a lower limit Def, i.e. a significant H i deficiency.
In a study of five members of the Toomre sequence of merging systems, Hibbard & van Gorkom (1996) found a tendency for the H i content in the galaxy bodies to progressively decrease going from earlier to later stage mergers. While in earlier stages the H i is found mainly associated with the galaxies, in late stage mergers the remnant’s body is devoided of H i in favour of the tidal tails. The putative two-disc merger NGC3256 has been found to have a mass of H i-emitting gas M = 6.2 109 M⊙ with 75 per cent of the mass in the tidal tails (English et al., 2003). In all cases, the H i masses of the above cited merging systems are higher than that estimated for CG J1720-67.8.
Considering the total B-band luminosity of CG J1720-67.8 after correction for Galactic extinction and average internal extinction E() = 0.5 mag, LB = 1.11011 L⊙,B, we find an upper limit to the H i mass per unit blue luminosity M/LB 0.02 M⊙ L. The ratio does not change significantly if the contribution to the B-luminosity of the early-type Galaxy 2 (whose contribution to the H i mass is probably negligible) is subtracted. This value is lower than the lowest value found in the Toomre sequence of mergers (0.07 for NGC7252 Hibbard & van Gorkom, 1996). This fact again points to an H i deficiency in CG J1720-67.8.
The bright tidal tail of CG J1720-67.8 has an H luminosity, L(H) = 1.1 1041 ergs s-1, considerably higher than most tidal tails of the merging galaxies in the Toomre sequence [L(H+[N ii]) = 1039 to 3.7 1040 ergs s-1; Hibbard & van Gorkom (1996)] and its percentage contribution to the global H luminosity ( 19 per cent) is comparable to that of the knotty northern tail of NGC 4676. Hence CG J1720-67.8, besides being particularly poor in atomic gas, displays a star formation activity significantly more intense (roughly by an order of magnitude in the tidal tail and at least a factor of 4 globally) than the merging galaxy pairs we used as a term of comparison. Additionally, its global star formation rate is roughly twice as high as that measured for HCG 31 (López-Sánchez, Esteban, & Rodríguez, 2004), a strongly interacting compact galaxy group having some common properties to CG J1720-67.8 and believed to be already very evolved (Rubin, Hunter, & Ford, 1990; Amram et al., 2002). We suggest that this star formation activity is, at least partially, responsible for the H i deficiency of the galaxy group. Part of the H i could also have been dispersed (at low density level) in the group surroundings by the interaction process, thus becoming particularly difficult to detect.
8 CONCLUSIONS
In this paper and our previous works (Weinberger, Temporin, & Kerber, 1999; Temporin et al., 2003a, b) we have collected a series of multiwavelength observations with the main aim of establishing the evolutionary state of the ultra-compact galaxy group CG J1720-67.8. Our studies have revealed this system as an interesting candidate to represent the rarely observed phase in the evolution of compact groups that precedes the final merging. In particular in this work we have considered the kinematics of the group components – based on both integral field and long slit optical spectroscopy – and the intensity and distribution of star formation activity – based on H and radio continuum observations – together with the photometric properties of the whole group and its tidal debris to put some constraints on the interaction history of CG J1720-67.8. We use encounter simulations in the literature as well as examples of merging galaxy pairs to interpret our observations and outline some possible evolutionary scenarios. However, the presence of tails and bridges involving all three galaxies suggests a more complex interaction than those usually simulated considering only galaxy pairs. In CG J1720-67.8 we have most probably a three-body encounter or an even more complicated case with one of the galaxies being already the outcome of a relatively recent merger.
Although other interpretations are possible, as discussed extensively in Section 7.1, we favour a scenario in which Galaxy 4 and Galaxy 1 experienced a prograde-retrograde close encounter within the last 200 Myr. During this encounter, the strong tidal tail and the bridge between the two galaxies were formed, and possibly also the cone-like plume with the apex pointing approximately to the centre of Galaxy 1. The interaction process triggered strong star formation episodes across the bodies and in the centres of both galaxies. More recent star formation events ( 10 Myr) have taken place in the condensations of gas and stars that formed under the action of self-gravity within the tidal tail. These condensations have properties consistent with tidal dwarf galaxies in the process of formation. Although these objects cannot be confirmed as real TDGs, they do show possible signs of self-gravitation.
The role of Galaxy 2 in this recent encounter is not clear. The small bridge departing from Galaxy 1 in its direction suggests that this galaxy was involved in the interaction. The presence of a further bridge between Galaxies 2 and 4 is possible but cannot be established with certainty because of the significant overlap between the two galaxies in projection on the sky. Our new data have confirmed the presence of low level star formation concentrated in the central part of Galaxy 2. This fact, together with the surface brightness distribution indicating a dominant de Vaucouleurs bulge, suggested the interesting hypothesis that Galaxy 2 is a merger remnant still showing the remnant of a central burst of star formation triggered by the merger event. If this was the case, the faint secondary tail seen on the western side of the group could have emanated from Galaxy 2’s progenitors. This is also an alternative origin for the northern cone-like plume. Since our data do not have sufficient spatial resolution to disentangle any possible double nucleus or other substructure within Galaxy 2, the merger hypothesis remains speculative. The proximity of the three galaxies in space and their strong interactions suggests that they will merge in a relatively short time. Furthermore, several indications of significant H i deficiency in the group (Section 7.3), according to the evolutionary scenario proposed by Verdes-Montenegro et al. , support the idea that the galaxy system is already evolved. Dedicated dynamical modelling is necessary to evaluate the validity of any of the proposed scenarios and predict the future evolution of the system.
Acknowledgments
ST acknowledges support by the Austrian Science Fund (FWF) under project no. P15065 and is grateful to the staff of the Anglo-Australian Observatory for their helpful assistance during the observations at the AAT, and to the Australia Telescope National Facility (Epping, NSW) for hospitality during the preparation of part of this work. ST would like to thank S. Ciroi for useful suggestions and for making available, together with M. Radovich, their scripts for integral field data handling.
References
- Amram et al. (2002) Amram P., Mendes de Oliveira C., Plana H., Balkowski C., Boulesteix J., Carignan C., 2002, Ap&SS, 281, 389
- Barnes (1992) Barnes J. E., 1992, ApJ, 393, 484
- Barnes & Hernquist (1991) Barnes J. E., Hernquist, L., 1991, ApJ, 370, L65
- Barnes & Hernquist (1996) Barnes J. E., Hernquist, L., 1996, ApJ, 471, 115
- Baugh et al. (1998) Baugh C. M., Cole S., Frenk C. S., Lacey C. G., 1998, ApJ 498, 504
- Begeman (1989) Begeman K. G., 1989, A&A, 223, 47
- Bertola et al. (1991) Bertola F., Bettoni D., Danziger J., Sadler E., Sparke L., de Zeeuw T., 1991, ApJ, 373, 369
- Bothun, Lonsdale, & Rice (1989) Bothun G. D., Lonsdale C. J., Rice W., 1989, ApJ, 341, 129
- Cardelli et al. (1989) Cardelli J. A., Clayton G. C., Mathis J. S., 1989, ApJ, 345, 245
- Condon (1992) Condon J. J., 1992, ARA&A, 30, 575
- Cram et al. (1998) Cram L., Hopkins A., Mobasher B., Rowan-Robinson M., 1998, ApJ, 507, 155
- English et al. (2003) English J., Norris R. P., Freeman K. C., Booth R. S., 2003, AJ, 125, 1134
- Haarsma et al. (2000) Haarsma D. B., Partridge R. B., Windhorst R. A., Richards E. A., 2000, ApJ, 544, 641
- Haynes & Giovanelli (1984) Haynes M. P., Giovanelli R., 1984, AJ, 89, 758
- Hibbard et al. (1994) Hibbard J. E., Guhathakurta P., van Gorkom J. H., Schweizer F., 1994, AJ, 107, 67
- Hibbard & Mihos (1995) Hibbard J. E., Mihos J. C., 1995, AJ, 110, 140
- Hibbard & van Gorkom (1996) Hibbard J. E., van Gorkom J. H., 1996, AJ, 111, 655
- Hickson (1982) Hickson P., 1982, ApJ, 255, 382
- Jones et al. (2003) Jones L. R., Ponman T. J., Horton A., Babul A., Ebeling H., Burke D. J., 2003, MNRAS, 343, 627
- Kauffmann & Charlot (1998) Kauffmann G., Charlot S., 1998, MNRAS, 294, 705
- Kennicutt (1998) Kennicutt Jr., R. C., 1998, ApJ, 498, 541
- Knierman et al. (2003) Knierman K. A., Gallagher S. C., Charlton J. C., Hunsberger S. D., Whitmore B., Kundu A., Hibbard J. E., Zaritsky, D. , 2003, AJ, 126, 1227
- Leitherer et al. (1999) Leitherer C. et al., 1999, ApJS, 123, 3
- López-Sánchez, Esteban, & Rodríguez (2004) López-Sánchez A. R., Esteban C., Rodríguez M., 2004, ApJS, 153, 243
- Mendes de Oliveira et al. (2001) Mendes de Oliveira C., Plana H., Amram P., Balkowski C., Bolte M., 2001, AJ, 121, 2524
- Mihos (2004) Mihos J. C., 2004, in Mulchaey J.S., Dressler A., Oemler A., eds., Clusters of Galaxies: Probes of Cosmological Structure and Galaxy Evolution, Cambridge University Press, p. 278
- Mihos & Bothun (1998) Mihos J. C., Bothun G. D., 1998, ApJ, 500, 619
- Mihos, Bothun, & Richstone (1993) Mihos J. C., Bothun G. D., Richstone D. O., 1993, ApJ, 418, 82
- Mihos & Hernquist (1994) Mihos J. C., Hernquist L., 1994, ApJ, 431, L9
- Mihos, Richstone, & Bothun (1992) Mihos J. C., Richstone D. O., Bothun G. D., 1992, ApJ, 400, 153
- Nishiura et al. (2000) Nishiura S., Murayama T., Shimada M., Sato Y., Nagao T., Molikawa K., Taniguchi Y., Sanders D. B., 2000, AJ, 120, 2355
- Noguchi (1988) Noguchi M., 1988, A&A, 203, 259
- Rubin, Hunter, & Ford (1990) Rubin V. C., Hunter D. A., Ford W. K. J., 1990, ApJ, 365, 86
- Stetson & Harris (1988) Stetson P. B., Harris W. E., 1988, AJ, 96, 909
- Sun et al. (2004) Sun M., Forman W., Vikhlinin A., Hornstrup A., Jones C., Murray S. S., 2004, ApJ, in press (preprint, astro-ph/0405511)
- Temporin & Fritze-v. Alvensleben (2003) Temporin S., Fritze-v. Alvensleben U., 2003, A&A, submitted
- Temporin et al. (2003a) Temporin S., Weinberger R., Galaz G., Kerber F., 2003a, ApJ, 584, 239
- Temporin et al. (2003b) Temporin S., Weinberger R., Galaz G., Kerber F., 2003b, ApJ, 587, 660
- Toomre (1977) Toomre A., 1977, in Tinsley B.M., Larson R.B., eds, The Evolution of Galaxies and Stellar Populations, New Haven: Yale Univ. Press, p. 401
- Toomre & Toomre (1972) Toomre A., Toomre J., 1972, ApJ, 178, 623
- van Dokkum (2001) van Dokkum P. G., 2001, PASP, 113, 1420
- (42) Verdes-Montenegro L., Yun S., Williams B. A., Huchtmeier W. K., Del Olmo A., Perea J., 2001 , A&A, 377, 812
- Weinberger, Temporin, & Kerber (1999) Weinberger R., Temporin S., Kerber F., 1999, ApJ, 522, L17
- Tully (1987) Tully R. B., 1987, ApJ, 321, 280
- White (1979) White S. D. M., 1979, MNRAS, 189, 831


| Object | F(H) | log(N ii/H) | log(S ii/H) | EW(H) |
|---|---|---|---|---|
| G1 | 243.3 2.5 | -0.75 0.03 | -0.66 0.05 | 141 |
| G2 | 75.2 11.3 | -0.38 0.26 | -0.23 0.25 | 9 |
| G4 | 248.5 4.1 | -0.43 0.03 | -0.34 0.05 | 52 |
| TDG3+9 | 38.9 2.7 | -0.51 0.14 | -0.55 0.27 | 40 |
| TDG7+8 | 89.8 3.3 | -0.79 0.10 | -0.57 0.12 | 275 |
| TDG 10 | 30.7 1.7 | -0.55 0.09 | -0.45 0.17 | 47 |
| TDG 12 | 13.3 2.7 | … | … | 14 |
-
a
All fluxes are in units of 10-16 ergs s-1 cm-2. Equivalent widths (EW) are in Å. A correction for Galactic extinction has been applied.
| Date | 2002 Jan 17 | 2002 Feb 25 | 2003 Aug 4 | 2003 Aug 5 |
|---|---|---|---|---|
| Array | 750A | 1.5A | 6D | 6D |
| HI Observations | ||||
| Frequency (MHz) | 1359 | 1359 | ||
| Bandwidth (MHz) | 8 | 8 | ||
| No. channels | 512 | 512 | ||
| Observing time (hrs) | 12 | 12 | ||
| (at each frequency) | ||||
| Continuum observations | ||||
| Frequency | 1384 | 1384 | 4800 | 1384 |
| 8640 | 2368 | |||
| 5184 | ||||
| 5952 | ||||
| Bandwidth | 128 | 128 | 128 | 128 |
| No. channels | 32 | 32 | 32 | 32 |
| Observing time (hrs) | 12 | 12 | 12 | 5.5 |
| (at each frequency) | ||||
| Weighting | Natural |
|---|---|
| Beam FWHP | 44′′x39′′ |
| RMS (mJy/beam) | 1.5 |
| Velocity range (cz) (km s-1) | 12800 - 13800 |
| Flux upper limit (Jy km s-1) | 0.3 |
| (3-; 200 km s-1) | |
| HI mass (M⊙) |
| Frequency (MHz) | 1384 | 2368 | 5312a | 8640 |
|---|---|---|---|---|
| Weighting | Uniform | Natural | Natural | Natural |
| Beam FWHP | 6563 | 7054 | 2925 | 1714 |
| RMS (Jy/beam) | 42 | 75 | 26 | 40 |
| Peak flux density (mJy/beam) | 1.5 | 0.71 | 0.43 | 0.20 |
| RA(J2000) at peak | 17 20 28.8 | 17 20 28.7 | 17 20 28.8 | 17 20 28.9 |
| Dec(J2000) at peak | -67 46 31 | -67 46 32 | -67 46 31 | -67 46 31 |
| Position error | 10 | 10 | 05 | 10 |
| Total flux densityb (mJy) | 4.2 | … | 1.1 | … |
-
a
Mean of the three observing frequencies 4800, 5192 and 5952 MHz.
The frequencies were chosen to maximise coverage in the uv-plane. -
b
Object too extended for accurate total flux measurement above 1384 MHz.
| Object | F(H) | L(H) | EW(H)a |
|---|---|---|---|
| (ergs s-1 cm-2) | (ergs s-1) | Å | |
| G1 | 2.82 10-14 | 1.10 1041 | … |
| G2 | 4.04 10-15 | 1.60 1040 | … |
| G4 | 2.59 10-14 | 1.01 1041 | … |
| Main tail | 2.93 10-14 | 1.14 1041 | 28.2 |
| Secondary tail | 4.11 10-15 | 1.60 1040 | 15.9 |
| TDG7+8 | 1.10 10-14 | 4.3 1040 | … |
-
a
For the EW of individual galaxies see Table 1.
| Object | LB | LV | LR | |||
| (mag) | (mag) | (mag) | (L⊙,B) | (L⊙,V) | (L⊙,R) | |
| Main tail | 16.9 | 16.4 | 16.1 | 8.8 109 | 7.7 109 | 6.3 109 |
| Percentage of total luminosity | 25.5 | 21.3 | 18.9 | … | … | … |
| Faint tail | 19.0 | 18.5 | 18.3 | 1.3 109 | 1.1 109 | 8.2 108 |
| Percentage of total luminosity | 3.6 | 3.2 | 2.7 | … | … | … |
| Cone-like feature | 19.4 | 18.6 | 18.0 | 8.8 108 | 1.0 109 | 1.1 109 |
| Percentage of total luminosity | 2.3 | 2.9 | 3.4 | … | … | … |
| Combined tidal features | 16.6 | 16.1 | 15.8 | 1.2 1010 | 1.0 1010 | 8.2 109 |
| Percentage of total luminosity | 31 | 27 | 25 | … | … | … |
-
a
As solar values we used B⊙ = 5.48 mag, V⊙ = 4.83 mag, and R⊙ = 4.31 mag.