The relation between black hole mass and velocity dispersion at
Abstract
The velocity dispersion of 7 Seyfert 1 galaxies at is measured using high signal-to-noise Keck spectra. Black hole (BH) mass estimates are obtained via an empirically calibrated photoionization method. We derive the BH mass velocity dispersion relationship at . We find an offset with respect to the local relationship, in the sense of somewhat lower velocity dispersion at a fixed BH mass at than today, significant at the 97% level. The offset corresponds to = with rms scatter of 0.13 dex. If confirmed by larger samples and independent checks on systematic uncertainties and selection effects, this result would be consistent with spheroids evolving faster than BHs in the past 4 Gyrs and inconsistent with pure luminosity evolution.
1 Introduction
The correlation of the mass of the central black hole (MBH) with the spheroid velocity dispersion (Ferrarese & Merritt 2000; Gebhardt et al. 2000; hereafter BHS) links phenomena at widely different scales (from the pcs of the BH sphere of influence to the kpcs of the bulge). This demonstrates that galaxy formation and AGN activity are connected and several physical explanations have been proposed (e.g. Kauffmann & Haenhelt 2000; Monaco et al. 2000; Volonteri et al. 2003; Haiman, Ciotti & Ostriker 2004).
Interesting clues can be obtained from the cosmic evolution of empirical relations. Different scenarios – all reproducing the local BHS relation – predict different evolution. For example, in a pure luminosity evolution scenario of spheroids, would not change with time, while MBH would increase as a result of accretion. A typical BH accreting at an average rate (e.g., Sun & Malkan 1989), would double its mass in a Gyr. This would predict the MBH at given to increase with time, possibly changing the slope of the BHS relation if the accretion rate is a function of MBH (e.g. Small & Blandford 1992). In contrast, if spheroids grew faster than BH, at fixed MBH could increase with time.
In this Letter we present the first results from an observational program aimed at measuring the cosmic evolution of the BHS relation. We measure the BHS relation for a sample of 7 Seyfert 1s at . This redshift is high enough to provide a time baseline over which we might expect evolution, yet low enough to be observationally practical.
2 Observations and analysis
2.1 Experiment Design and Sample Selection
The sphere of influence of supermassive BHs in galaxies at cosmological distances cannot be resolved even with the Hubble Space Telescope (HST). Therefore we target active galaxies, where MBH can be obtained from the integrated properties of the broad emission-line region. In this paper, we will combine an empirically calibrated photo-ionization estimate of the size of the broad line region (hereafter ECPI; Wandel et al. 1999) with its kinematics measured from the rms width of H, to deduce the central BH mass. To measure simultaneously the stellar velocity dispersion from absorption lines, requires nuclei of relatively low luminosity, so that the fraction of stellar light in the integrated spectrum is substantial. Seyfert 1s provide the right balance between the two components: absorption features typical of old stellar populations such as Mg5175 and Fe5270 are clearly visible in their high signal-to-noise integrated spectra. In order to minimize the uncertainties from sky subtraction and atmospheric absorption corrections, it is convenient to select specific redshift windows where the relevant emission and absorption lines fall in clean regions of the atmosphere. Accordingly, we selected the “clean window” , which corresponds to a look-back time of Gyrs, for H km s-1 Mpc-1, , and .
A first object (MS1558+453; hereafter S99; Stocke et al. 1991) was selected for a pilot study. When the Sloan Digital Sky Survey (SDSS) became available, a larger sample of objects was selected according to the following criteria: , H equivalent width and rms width greater than 5 Å. These are sufficient to select only broad H galaxies, but are loose enough that they should not introduce significant bias in MBH. The relevant properties of the observed objects are listed in Table 1.
2.2 Observations and data reduction
High signal-to-noise (Table 1) spectra were obtained using the Low Resolution Imaging Spectrograph (Oke et al. 1995) at the Keck-I telescope on 2003 March 6 (S99) and 2003 Sep 3. Two exposures were obtained for each object, with total exposure times ranging between 1200s and 5280s. The 900/5500 grating with a slit provided a resolution of kms-1 around Mg5175 and Fe5270, as measured from sky lines and arc lamps. Internal flat fields were obtained after each object exposure, to correct the fringing pattern of the red CCD. A set of A0V stars from the Hipparcos catalog111URL http://www.gemini.edu/sciops/instruments/niri/NIRISpecStdSearch.html to be 15 degrees from each target was observed during the night as flux calibrators, and to measure the B-band atmospheric absorption. Spectrophotometric standards were observed during twilights. Internal tests, and comparison with SDSS spectra, show that this procedure corrects the B-band absorption to a level of a few parts in a thousand and relative flux calibration to a few percent. The data reduction was similar to that in Treu et al. (2001).
2.3 Bulge Kinematics
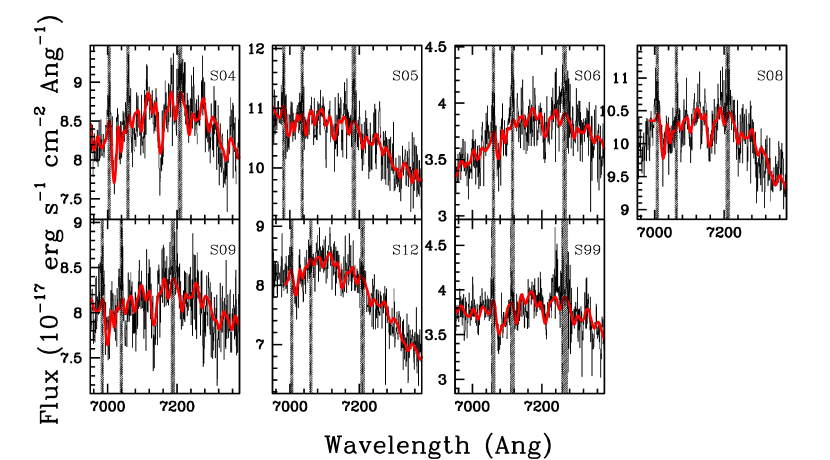
The stellar velocity dispersion of the bulge was obtained by comparing the spectral region corresponding to 5100-5300 Å with spectra of G-K giants as described in Treu et al. (2001). Briefly, the high resolution template stars were redshifted and smoothed to match the resolution of the instrumental setup, and convolved with gaussians in space to reproduce the kinematic broadening. Then a low order polynomial representing the featureless continuum was added (using the pixel fitting code by van der Marel 1994). Small AGN emission features at vacuum wavelengths 5160.33, 5200.53, and 5310.34 Å (van den Berk et al. 2001) were masked out during the fit. This procedure yields a velocity dispersion , a line strength , with uncertainties (Tab. 1). For each object, we performed a number of tests, varying the spectral range and the order of the polynomial used for continuum fitting. The results were found to be sensitive to these changes for 6/13 objects (the ones with shallower stellar absorption features and typically with stronger FeII AGN emission). The other 7 objects (Fig. 2) yielded stable – changes much smaller than estimated errors – and were therefore considered reliable. We note that excluding the Mg region changes the velocity dispersion by less than the estimated errors (c.f. Barth, Ho & Sargent 2003). For simplicity and consistency with previous work we assume that the central velocity dispersion (i.e. within a circular aperture of radius 1/8 of the effective radius; Ferrarese & Merritt 2000) can be obtained as = , with =. This assumes that the spheroids have an effective radius of , are non rotating, their velocity dispersion profile is similar to that of early-type galaxies, and the disk contamination to the line profile is negligible.
2.4 Black hole mass determination
Black hole masses were determined using the empirical correlation between continuum luminosity and size of the broad line region (Wandel et al. 1999; Kaspi et al. 2000, Vestergaard 2002) and the width of the broad component of H, summarized by: (Shields et al. 2003), where is the luminosity of the continuum at 5100 Å in units of erg s-1 and is the FWHM of the broad component H in units of 3000 km (Note that adopting a different slope for , e.g. 0.66 in eq A5 in Vestergaard 2002, does not change our result because of the luminosity range spanned by our sample). This formula assumes that the regions emitting broad H in all AGN are photoionized under the same conditions, by a UV continuum of the same shape. The bulk velocities of the emitting gas clouds are presumed to be dominated by gravity, an assumption for which there is currently moderate observational support (Peterson & Wandel 1999).
Absolute calibration of was obtained by normalizing the LRIS spectra to the model SDSS magnitude. Since SDSS photometry and LRIS spectra are obtained at different epochs, the flux normalization is uncertain by % due to AGN variability Webb & Malkan (2000). This introduces a random error component of % on MBH, which is negligible with respect to the intrinsic scatter of the ECPI method (a factor of , Vestergaard 2002). The flux was then corrected for Galactic extinction (Schlegel et al. 1998) and subtracted the portion produced by starlight, by comparing the measured line strength of the stellar features with an assumed standard intrinsic value of (van der Marel 1994). The starlight falling outside the slit, but included in the photometry, was estimated from the measured seeing () and a profile for the host galaxy with effective radius . The estimated fractions of AGN-to-total light are listed in Tab. 1.
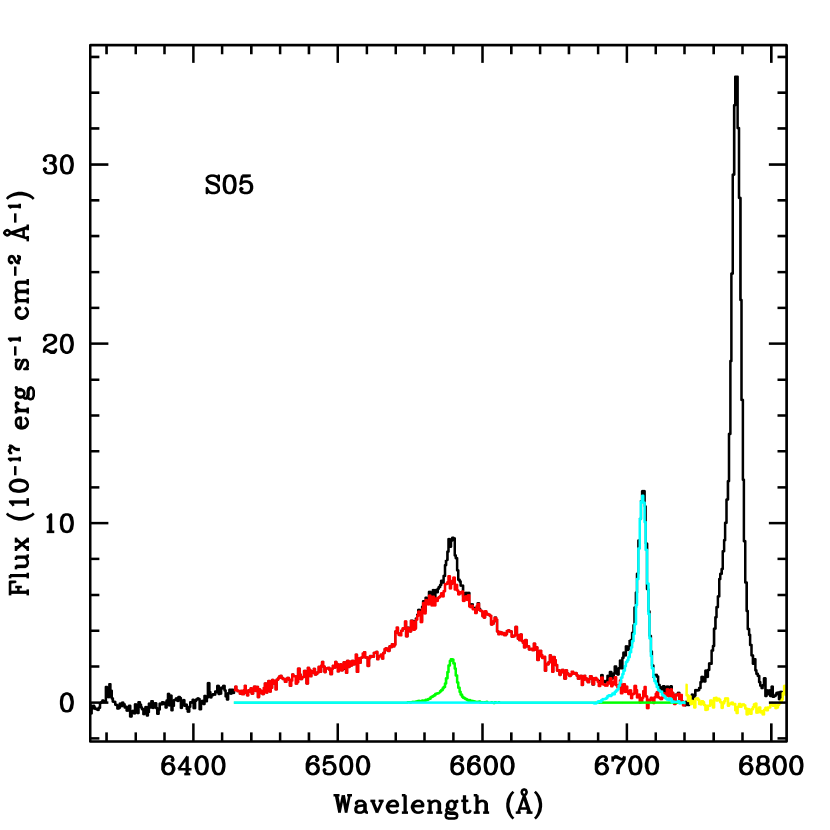
The high signal-to-noise and resolution of the spectra allowed us to determine the width of the broad component of H using the following procedure (Fig. 2): i) the continuum was subtracted by fitting a straight line between the continua at 4700 Å and 5100 Å rest frame. ii) The [O III] line at 5007Å was divided by 3 and blueshifted to remove the 4959Å line. iii) The [O III] line at 5007Å was blueshifted and rescaled to remove the narrow component of H. The line ratio H / [O III]5007 was allowed to range between 1/20 and the maximum value consistent with the absence of “dips” in the broad component (typically 1/10-1/7; e.g. Marziani et al. 2003). iv) The second moment of the residual broad H component was computed for the minimum and maximum narrow H. The average and semidifference of the two values were taken as best estimate and uncertainty of the broad H rms. The rms was confirmed to be much more insensitive than the FWHM to continuum and narrow component subtraction (see also Peterson et al. 2004). v) The rms was transformed into FWHM assuming FWHM = 2.35 rms, consistent with the observed values (Peterson et al. 2004 report . Their value would lower MBH by %).
3 The Black Hole mass velocity dispersion relation at
The BHS relation is shown in Figure 3 and compared to the local relations (Merritt & Ferrarese 2001; Tremaine et al. 2002). Local AGN with reliable and MBH from Ferrarese et al. (2001) are also shown for comparison. We stress that the plot should be interpreted with caution, since MBH obtained with the ECPI method is uncertain by a factor of , as opposed to the more precise estimates available for nearby objects. Furthermore, the distribution of errors is non-gaussian and estimates for individual objects may be significantly off, especially when based on single epoch measurements (Vestergaard 2002). Given the relatively large and non-gaussian uncertainties, selection effects could be playing an important, and hard to quantify, role. Selection effects enter in both quantities: of bulges smaller or close to the instrumental resolution () cannot be reliably measured, while very large tend to dilute the absorption features and therefore are harder to measure at a given S/N. Our observational biases also limit the observable MBH range. When we are signal-to-noise limited, and therefore flux limited, we might exclude objects with the smallest MBH for a given . In contrast, by requiring detectable stellar features in the integrated spectrum we are excluding the brightest AGNs.
At face value, this result indicates that 4 Gyrs ago BHs lived in bulges with lower . The of the 7 points with respect to the local relationship is 15.7, including errors on both quantities, i.e. the probability that they are drawn from the local relationship is 3%. Assuming that BH growth was negligible and adopting the local BHS slope, the average difference and scatter in the intercepts corresponds to dex in at fixed MBH. Most of the offset and scatter is given by the galaxy with the smallest and largest fractional uncertainty (S05). Discarding that point, the offset and scatter are dex in . In terms of MBH, the scatter around the relation is 0.6 dex, or 0.3 dex excluding S05. Since the estimated uncertainty on MBH alone is dex, the intrinsic component of the scatter did not increase dramatically. Our result appears to be at variance with that by Shields et al. (2003), who combined ECPI MBH with [O III] emission line width, to measure the BHS relation out to . Their result is consistent with no evolution, albeit with large scatter. More data are needed to understand the origin and significance of this discrepancy. Possible explanations include the different velocity dispersions adopted (stellar features vs [O III]) and the different range in MBH. At this stage we refrain from quantifying the slope.
In order to confirm this tantalizing and perhaps surprising result, data for a larger and more complete sample will be needed, also to address two important systematic effects that could conspire to simulate the observed evolution. First, the local calibration of the ECPI method might not be appropriate for the distant universe. Reverberation mapping studies of distant galaxies could verify this. Second, the assumed relationship between and should be checked independently. For example the contribution from a face-on cold disk could lower requiring a higher value for , reducing the apparent evolution: =1.59 would be required to bring the and relationships in agreement. HST imaging is needed to determine the inclination and relative luminosity of the disk within the spectroscopic aperture, while higher signal-to-noise ratio and spatially resolved spectroscopy are needed to study departures from gaussianity of the line profile and rotational support.
4 Conclusions
We have measured the velocity dispersion of the hosts of distant active nuclei. In combination with MBH estimates using the ECPI method, we have obtained a first estimate of the BHS relation at . Since MBH cannot decrease, this measurement, taken at face value, suggests the of bulges of Sy1s increased by roughly 40% in the past 4 Gyrs. Having provided a first illustration of the method, it is now necessary to collect data for a large sample of objects spanning a larger range of MBH and , and to test systematic uncertainties by obtaining independent measures of MBH and spatially resolved information on the bulge and disk morphology and kinematics.
References
- Barth, Ho & Sargent (2003) Barth, A.J., Ho, L. C., Sargent, W.L.W. 2003, ApJ, 583, 134
- Ferrarese & Merritt (2000) Ferrarese, L. & Merritt, D. 2000, ApJ, 539, L9
- Ferrarese et al. (2001) Ferrarese, L., Pogge, R.W., Peterson, B.M., Merritt, D., Wandel, A. & Joseph, C.L. 2001, ApJ, 555, L79
- Gebhardt et al. (2000) Gebhardt, K. et al. 2000 ApJ, 539, L13
- Haiman, Ciotti & Ostriker (2004) Haiman, Z., Ciotti, L., Ostriker, J.P. 2004, ApJ, 606, 763
- Kaspi et al. (2000) Kaspi, S. et al. 2000 ApJ, 533, 631
- Kauffmann & Haenhelt (2000) Kauffmann, G. & Haenhelt, M. 2000, MNRAS, 311, 576
- Marziani et al. (2003) Marziani, P., Sulentic, J. W., Zamanov, R., Calvani, M., Dultzin-Hacyan, D., Bachev, R., Zwitter, T. 2003, ApJS, 145, 199
- Merritt & Ferrarese (2001) Merritt, D. & Ferrarese L. 2001, ApJ, 547, 140
- Monaco et al. (2000) Monaco, P. , Salucci, P. & Danese, L. 2000, MNRAS, 311, 279
- Oke et al. (1995) Oke, B. et al. 1995, PASP, 107, 375
- (12) Peterson, B.M. & Wandel, A. 1999, ApJ, 521, L95
- Peterson et al. (2004) Peterson, B.M. et al. 2004, preprint, astro-ph/0407299
- Schlegel et al. (1998) Schlegel, D.J., Finkbeiner, D.P., Davis, M. 1998, ApJ, 500, 525
- Shields et al. (2003) Shields, G.A., Gebhardt, K., Salviander, S., Wills, B.J., Xie, B., Brotherton, M.S., Yuan, J. & Dietrich, M. 2003, ApJ, 583, 124
- Small & Blandford (1992) Small, T. & Blandford, R.D. 1992, MNRAS, 259, 725
- Stocke et al. (1991) Stocke, J. T., Morris, S.L., Goia, I.M., Maccacaro, T., Schild, R., Wolter, A., Fleming, T.A., Henry, J.P. 2001, ApJS, 76, 813
- Sun & Malkan (1989) Sun & Malkan 1989, ApJ, 346, 58
- Tremaine et al. (2002) Tremaine, S. et al. 2002, ApJ, 574, 740
- Treu et al. (2001) Treu, T., Stiavelli, M., Møller, P., Casertano, S., Bertin, G., 2001, MNRAS, 326, 221
- vanden Berk et al. (2001) vanden Berk, D.E. et al. 2001, AJ, 122, 549
- van der Marel (1994) van der Marel, R. P. 1994, MNRAS, 270, 271
- Vestergaard (2002) Vestergaard, M. 2002, ApJ, 571, 733
- Volonteri et al. (2003) Volonteri, M. Haardt F., & Madau P. 2003, ApJ, 582, 559
- Wandel Peterson & Malkan (1999) Wandel, A., Peterson, B. & Malkan, M. 1999, ApJ, 526, 579
- Webb & Malkan (2000) Webb, W. & Malkan, M.A. 2000, ApJ, 540, 652
| ID | S/N | f5100 | rms(H) | fAGN | (MBH/M⊙) | |||||
|---|---|---|---|---|---|---|---|---|---|---|
| S01 | 15:39:16.23 | 03:23:22.06 | 36 | 0.3593 | - | - | 6.000.01 | 50.00.4 | - | - |
| S02 | 16:11:11.67 | 51:31:31.12 | 51 | 0.3543 | - | - | 5.240.01 | 41.81.1 | - | - |
| S03 | 17:32:03.11 | 61:17:51.95 | 65 | 0.3583 | - | - | 10.720.02 | 35.70.2 | - | - |
| S04 | 21:02:11.51 | 06:46:45.03 | 53 | 0.3577 | 14017 | 0.340.13 | 7.770.01 | 50.21.1 | 0.44 | 8.18 |
| S05 | 21:04:51.84 | 07:12:09.45 | 54 | 0.3533 | 8132 | 0.180.05 | 9.440.02 | 62.21.6 | 0.68 | 8.52 |
| S06 | 21:20:34.18 | 06:41:22.24 | 36 | 0.3686 | 12331 | 0.240.09 | 8.850.02 | 45.60.6 | 0.58 | 8.21 |
| S07 | 23:09:46.14 | 00:00:48.91 | 65 | 0.3517 | - | - | 11.690.02 | 53.50.3 | - | - |
| S08 | 23:59:53.44 | 09:36:55.53 | 62 | 0.3583 | 13923 | 0.210.08 | 8.620.01 | 27.20.5 | 0.63 | 7.77 |
| S09 | 00:59:16.11 | 15:38:16.08 | 46 | 0.3539 | 13730 | 0.220.08 | 10.800.02 | 41.51.1 | 0.62 | 8.17 |
| S10 | 01:01:12.07 | 09:45:00.76 | 61 | 0.3509 | - | - | 14.460.02 | 42.10.8 | - | - |
| S11 | 01:07:15.97 | 08:34:29.40 | 55 | 0.3555 | - | - | 9.070.02 | 32.80.1 | - | - |
| S12 | 02:13:40.60 | 13:47:56.06 | 46 | 0.3579 | 16136 | 0.260.07 | 13.700.03 | 72.00.7 | 0.55 | 8.66 |
| S99 | 16:00:02.80 | 41:30:27.00 | 49 | 0.3676 | 18218 | 0.430.10 | 5.830.01 | 72.22.6 | 0.31 | 8.33 |
Note. — For each object we list coordinates, average signal-to-noise ratio per Å of the region used for the kinematic fit, redshift, velocity dispersion (in km s-1), line strength, total flux at 5100 Å (rest frame; in 10-17 erg s-1cm-2Å-1; corrected as described in Section 3; absolute flux calibration uncertainties are not included), rms width of the broad component of H (in Å, observed frame), estimated fraction of AGN contribution to the flux at 5100Å, estimated MBH(the related uncertainty is dex).