A new Böhm-Vitense gap in the temperature range 5560 to 5610 K in the Main Sequence ††thanks: Based on spectra collected with the ELODIE spectrograph at the 1.93-m telescope of the Observatoire de Haute Provence (France). ††thanks: Full Table 1 is only available in electronic form at http://www.edpsciences.org
Highly precise temperatures ( K) have been determined from line depth ratios for a set of 248 F-K field dwarfs of about solar metallicity (–0.5 [Fe/H] +0.4), based on high resolution (=42 000), high echelle spectra. A new gap has been discovered in the distribution of stars on the Main Sequence in the temperature range 5560 to 5610 K. This gap coincides with a jump in the microturbulent velocity and the well-known Li depression near 5600 K in field dwarfs and open clusters. As the principal cause of the observed discontinuities in stellar properties we propose the penetration of the convective zone into the inner layers of stars slightly less massive than the Sun and related to it, a change in the temperature gradient.
Key Words.:
Stars: fundamental parameters – stars: convection – H-R diagrame-mail: val@deneb.odessa.ua
1 Introduction
Of the fundamental stellar parameters, effective temperature ( ) is the most crucial to obtain accurate abundances. There exists a multitude of methods to determine , among which we have chosen the line depth ratios. This method has the advantage of being independant of interstellar reddening, spectral resolution and rotational and microturbulence broadening. In a previous paper (Kovtyukh et al. kovtet03 (2003)) we presented high precision temperatures for 181 F-K dwarfs by this method. We have noticed a gap in the temperature range 5560 to 5610 K (0.70 for about solar metallicity) that we investigate in this paper.
Color gaps are known to exist in open clusters. For example, high-precision astrometry and photometry of the Hyades reveal two gaps along the clusters Main Sequence (MS), near 0.38 and 0.48 mag (de Bruijne, Hoogerwerf & de Zeeuw dBHZ00 (2000); dBHZ01 (2001)). Rachford & Canterna (rachcan00 (2000)) describe them in several other clusters. Among field stars, the existence of such gaps is still matter of debate (e.g., Böhm-Vitense & Canterna bohm74 (1974); Mazzei & Pigatto MP88 (1988); Simon & Landsman SL97 (1997)). Newberg & Yanny (NY98 (1998)) have used high-precision parallaxes, and , to construct the H-R diagram of nearby stars (primarily field stars, although their sample may contain cluster stars). They only found evidence for a gap at 0.25 in the MS.
The explanations for gaps range from the onset of convection in the stellar envelope (Böhm-Vitense & Canterna 1974) to peculiarities in the Balmer jump and Balmer lines as suggested by Mermilliod (mer76 (1976)). Ulrich (1971a ; 1971b ) speculated that gaps in young clusters might be produced by the presence of 3He isotopes that halt gravitational contraction 1…2 mag above the MS. While Mermilliod’s gaps occur among B stars, Böhm-Vitense & Canterna’s (and also Ulrich’s) gaps are found among less massive stars. Note that the standard stellar models do not show any peculiar change of slope in the versus mass relation along the MS. Böhm-Vitense (BV70 (1970)) was the first to realize that a gap in the distribution of colors may develop when the atmosphere changes from purely radiative to convective in the deep layers at cooler of 7500 K. There are two possible ways in which convection might alter : (a) either because the convective temperature gradient is steeper than radiative (Böhm-Vitense BV70 (1970)); or (b) because convection causes photospheric granulation with associated temperature inhomogeneities (Nelson Nelson80 (1980); Böhm-Vitense BV82 (1982)).
In order to investigate the existence of gap in the MS, we have increased our initial sample to 248 stars, with ranging from 4000 to 6150 K and absolute magnitudes from 3.02 to 7.41. In Sect. 2, we briefly describe our dataset and the method of line depth ratios. In Sect. 3, we confirm the existence of a gap in the temperature range 5560 to 5610 K and we show that it is not correlated with [Fe/H] but with the microturbulence velocity . Also we discuss the possible coincidence of this gap with the Li depression observed in field stars and open clusters.
2 Data reduction and the derivation of atmospheric parameters
The spectra used in this paper were extracted from the most recent version of the library of stellar spectra collected with the ELODIE echelle spectrograph at the Observatoire de Haute-Provence by Soubiran et al. (soubet98 (1998)) and Prugniel & Soubiran (prusou01 (2001)). The description of the instrument mounted on the 1.93 m telescope can be found in Baranne et al (baran96 (1996)).
Most of the stars have accurate parallaxes enabling as to determine their absolute magnitudes MV that range from 3.016 (HD 209965, F8V) to 7.410 (HD 29697, K3V). HD 209965 however has the most uncertain absolute magnitude due to a relative error in parallax of 18% (all the others have relative errors lower than 11%). Two stars that are not part of the catalogue had their absolute magnitudes estimated by the TGMET method introduced by Katz et al. (katzet98 (1998)): HD 171304 (MV=4.238), HD 186039 (MV=4.026).
The spectral range of the spectra is 4400–6800 ÅÅ and the resolution is =42 000. The signal to noise ratio () of the spectra range from 40 to 680, with the large majority having 100. Spectrum extraction, wavelength calibration and radial velocity measurement were performed at the telescope with the on-line data reduction software while straightening of the orders, removing of cosmic ray hits, bad pixels and telluric lines were performed as described in Katz et al (katzet98 (1998)). Further processing of the spectra (continuum placement, measuring equivalent widths, etc.) was carried out by us using the DECH20 software (Galazutdinov gal92 (1992)). Equivalent widths and depths of lines were measured manually by means of a Gaussian fitting. The Gaussian height was taken as a measure of the line depth. This method produces line depth values that agree with the parabola technique used by Gray (gray94 (1994)).
The key to our analysis of the stellar spectra is the line-depth ratio technique, pioneered by Gray (1994) and successively improved by our group. This technique allows the determination of with an exceptional precision. It relies on the ratio of the central depths of two lines that have very different functional dependences on . The method is independent of the interstellar reddening and only marginally dependent on individual characteristics of stars, such as rotation, microturbulence and metallicity.
Briefly, a set of 105 line ratio – relations was obtained in Kovtyukh et al. (kovtet03 (2003)), with the mean random error of a single calibration being 60–70 K (40–45 K in most cases and 90–95 K in the least accurate cases). The use of 70–100 calibrations per spectrum reduces the uncertainty to 5–7 K. These 105 relations use 92 lines, 45 with low (2.77 eV) and 47 with high (4.08 eV) excitation potentials, and have been calibrated with the 45 reference stars in common with Alonso et al. (AAMR96 (1996)), Blackwell & Lynas-Gray (BLG98 (1998)) and di Benedetto (dB98 (1998)). The zero-point of the temperature scale was directly adjusted to the Sun ( =5777 K is adopted for the Sun), based on 11 solar reflection spectra taken with ELODIE, leading to an uncertainty in the zero-point of about 1 K. The application range for the calibrations is .
In the present study we add 82 new spectra to the 2003 sample, increasing the total number of dwarfs with precisely determined to 248 (see Table 1). In Table 1 we give the mean , the number of calibrations used (), the errors of the mean , , , [Fe/H], MV and from 2 (transformed into Johnson). For the majority of stars we get an error which is smaller than 10 K.
| Star | , K | , K | , | [Fe/H] | (B–V) | Remarks | |||
|---|---|---|---|---|---|---|---|---|---|
| HD 1562 | 5828 | 97 | 5.8 | 4.0 | 1.2 | –0.27 | 5.007 | 0.589 | |
| HD 1835 | 5790 | 68 | 5.5 | 4.4 | 0.9 | 0.20 | 4.843 | 0.644 | |
| HD 3765 | 5079 | 87 | 4.7 | 4.3 | 1.1 | 0.06 | 6.155 | 0.953 | |
| HD 4307 | 5889 | 91 | 5.0 | 4.0 | 1.1 | –0.13 | 3.637 | 0.583 | |
| HD 4614 | 5965 | 69 | 6.4 | 4.4 | 1.2 | –0.19 | 4.591 | 0.542 |
Accurate [Fe/H], and have been determined as well. The iron abundance was determined from an LTE analysis of equivalent widths of FeI and FeII lines using the WIDTH9 code and the atmosphere models by Kurucz (kur93 (1993)). Appropriate models for each star were derived by means of standard interpolation through and .
Microturbulent velocities were determined by forcing abundances obtained from individual FeI lines to be independent of equivalent width. The value of is very sensitive to the adopted . The small uncertainty of 0.1-0.2 is the result of our estimates being accurate to 10-20 K.
Surface gravities were derived from the ionization balance between FeI and FeII.
The abundance of iron relative to solar =log(Fe/H)∗ – log(Fe/H)⊙ was adopted as the metallicity parameter of a star and was obtained from FeI lines. Note that the solar metallicity from our analysis is [Fe/H]=0.05 (Table 1). This non-zero value results from the lower resolution of our spectra ( = 42 000) compared to the resolution of the Solar Spectrum Atlas (600 000) which is usually used for solar oscillator strengths and [Fe/H]⊙ determinations. For some stars the atmospheric parameters have been previously reported in Mishenina et al. (MSKK04 (2004)).
3 The gap
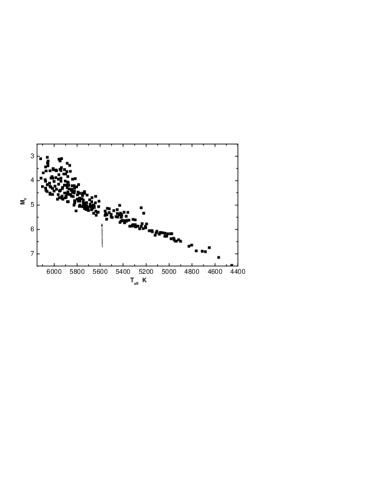
Fig. 1 shows the resulting temperature versus absolute magnitude for our 248 field dwarfs. A number of turn-offs and a well-defined MS can be seen. The latter shows a clear gap between =5560 and 5610 K (0.70 mag for about solar metallicity) and =5.0–5.5 mag, which corresponds to a mass of about 0.90–0.95 M⊙. This gap has been tentatively identified in Hyades by De Bruijne, Hoogerwerf & de Zeeuw (dBHZ00 (2000), dBHZ01 (2001)), although it is less prominent than the other two gaps in this cluster (since Hyades has [Fe/H] = +0.15, this leads to a shift of the to 0.75–0.80).
The gap (near 0.70) is not clearly seen in the diagram for our sample of field stars, because the parameter is very sensitive to interstellar reddening, metallicity and macroturbulence.
What is the probability that the gap is due to statistical uncertainty in the star counts ? The histogram appears to be a smoothly increasing function between =4900 and 5900 (Fig. 2a). Approximating by a quadratic polynomial, we get a dispersion in the distribution of about 3.2 (point (5585,0) included) or 2.0 (point (5585,0) excluded). This predicts 12 stars in the region of the gap (centered on =5585 K). No star in the gap requires a minimum of 4 deviation, which translates into the probability that the gap is real as high as 0.999.
Note that one star (excluded from Table 1) does fall into the gap. HD 13974 is a G0V spectroscopic binary, with =5590 12.9 and [Fe/H]=–0.46. The value of =3.9 for this star is more typical of a subgiant, as well as MV=4.697. We therefore conclude it is not a dwarf. Also quite possibly the spectrum of the secondary component distorts our measurements of the lines of the primary component and therefore affects the derived .
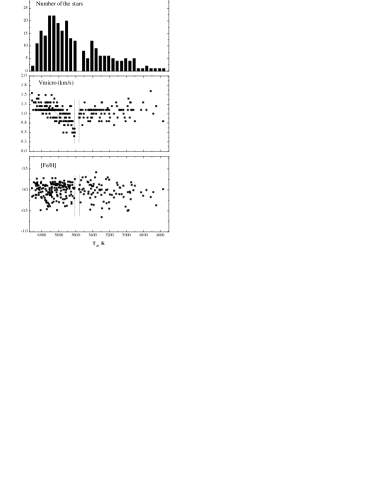
It is reasonable to assume that microturbulence is driven by convection and therefore one might expect a discontinuous behavior of across the gap. Indeed, as seen from Fig. 2b, experiences a jump at the position of the gap. On the hot side, declines from 1.3 at =6000 K to 0.6 at 5560 K. On the cool side, is nearly constant at 1.0 . This test has not been carried out before and may be an indirect confirmation of the convection hypothesis. It is very important to note that this jump remains even if we decrease Teff by 50 for the stars located near the hot boundary of the gap. Therefore we conclude that this jump is real.
To demonstrate that there is no systematic effect in our or determination, we plot the derived metallicities versus in Fig. 2c. There is no trend of [Fe/H] with which confirms the robustness of our atmospheric analysis. Also, it shows that our sample is very uniform in metallicity, [Fe/H] spanning the full interval at all temperatures.
The dwarfs in our sample have various ages, and they likely evolve within the MS. Why then the position of the gap does remain independent of the stars’ ages and their evolutionary stages? One possible solution is that. The structure of the outer parts of the convective zones is independent of small luminosity changes during the MS stage, but depends mainly upon the . Therefore, stars in the vicinity of the gap should experience the color and jumps, placing them outside the gap. Thus, we can consider these jumps as a result of the sudden rebuilding of the outer convective zone structure that change the color and of the stars.
3.1 The possible lithium – gap connection
The gap is located near the hot edge of the well-studied lithium depression in the field dwarfs at 5600, where lithium is depleted by 2 or more orders of magnitude (see, for example, Chen et al. chen01 (2001); Ryan Ryan00 (2000)). The dwarfs located on the left of the blue side of the gap show a large spread in lithium abundance, with values ALi ranging from less than 1.0 to 3.0 dex. In contrast, stars located on the right of red side show low values of ALi, reflecting the dilution effects in this spectral region.
The surface abundance of Li should in principle be a function of , age, metallicity and somewhat poorly explored physical processes like convection, rotation, stellar wind, etc. Thus, by measuring Li in stars with nearly solar metallicity, crucial information about the convection in stars of different ages can be obtained. The level of dilution of lithium depends on the level of convection in these stars.
Li depression is observed in field stars and old clusters such as Coma, Hyades, M 67 but not in the younger ones like Pleiades and Alpha Per. The location of Li depression is also age-dependent: in the Hyades (625 Myr) it occurs at 5400 K (Boesgaard & King BK02 (2002)), in NGC 752 (1.7 Gyr) at 5600 K, and in M 67 (5 Gyr) at 5700 K (Ryan 2000). Only stars that have shallow convection regions will show Li enrichment - when a star has a large convective region, the Li is diluted beyond detection. Cool dwarfs ( 5600 K) usually show lower Li abundance compared to hot ones. Only a few cool dwarfs are known to have a high Li content (Chen et al. 2001).
It is clear that the sudden decline in ALi near the temperature gap is directly associated with a rapid increase in thickness of the convective envelope in such regions (e.g. Cayrel, Cayrel de Strobel & Campbell cayrel84 (1984); Chen et al. 2001). Most of the stars with high Li abundance present an undeveloped convective zone, whereas stars with low Li abundance show a developed convective zone.
Israelian et al. (ISMR04 (2004)) find that lithium abundances of planet host stars with between 5850 and 6350 K are similar to those in the Chen et al. (chen01 (2001)) comparison sample, while at lower , in the range 5600 – 5850 K, the planet host stars show on average lower lithium abundances than stars in the comparison sample. This temperature range is where anomalous behavior of the microturbulence velocity is observed (Fig. 2b).
4 Summary
To investigate the fine structure in the distribution of stars on the MS, we have determined precise for a sample of 248 field F,G and K stars with accurate parallaxes and near-solar metallicity [Fe/H]0.4. We have identified a new Böhm-Vitense gap in the MS between 5560 and 5610 K, with a confidence better than 99.9%. This gap possibly coincides with the Li depression seen in open clusters and field stars. The most likely explanation for the gap is the sudden change in the properties of atmospheric convection.
Our analysis suggests that the theoretical models of convection in solar-type stars need to be improved.
Acknowledgements.
V.K. wants to thank the staff of Observatoire de Bordeaux for the kind hospitality during his stay there. In addition, V.K. would like to thank Prof. G.S. Bisnovatyi-Kogan and Dr. N.I. Gorlova for many useful discussions about stellar physics. The authors are grateful to the referee, Dr. B.A. Twarog, for helpful comments and suggestions which have certainly improved the final version of this paper.References
- (1) Alonso, A., Arribas, S., & Martínez-Roger, C. 1996, A&ASS 117, 227
- (2) Baranne, A., Queloz, D., Mayor, M., et al. 1996, A&AS, 119, 373
- (3) Blackwell, D.E. & Lynas–Gray, A.E. 1998, A&ASS 129, 505
- (4) Boesgaard, A.M. & King J.R., 2002, A&A, 565, 587
- (5) Böhm-Vitense, E. 1970, A&A, 8, 283
- (6) Böhm-Vitense, E. 1982, ApJ, 255, 191
- (7) Böhm-Vitense, E., & Canterna, R. 1974, ApJ, 194, 629
- (8) Cayrel, R., Cayrel de Strobel, G., & Campbell, B., 1984, ApJ, 283, 205
- (9) Chen Y.Q., Nissen P.E., Benoti T., Zhao G., 2001, A&A, 371, 943
- (10) de Bruijne, J.H.J., Hoogerwerf, R., & de Zeeuw, P.T. 2000, ApJ, 544, L65
- (11) de Bruijne, J.H.J., Hoogerwerf, R., & de Zeeuw, P.T. 2001, A&A 367, 111
- (12) di Benedetto, G.P. 1998, A&A 339, 858
- (13) Galazutdinov G.A., 1992, Preprint SAO RAS, n92
- (14) Gray D., 1994, PASP 106, 1248
- (15) Israelian, G., Santos, N.C., Mayor, M. & Rebolo, R. 2004, A&A, 414, 601
- (16) Katz, D., Soubiran, C., Cayrel, R., Adda, M. & Cautain, R. 1998, A&A, 338, 151
- (17) Kovtyukh, V.V., Soubiran, C., Belik, S.I., & Gorlova N.I. 2003, A&A, 411, 559
- (18) Kurucz R.L., 1993, CD ROM n13
- (19) Mazzei, P., & Pigatto, L. 1988, A&A, 193, 148
- (20) Mermilliod, J.-C. 1976, A&A, 53, 289
- (21) Mishenina, T.V., Soubiran, C., Kovtyukh, V.V., Korotin, S.A. 2004, A&A, 418, 551
- (22) Nelson, G.D. 1980, ApJ, 238, 659
- (23) Newberg, H.J. & Yanny, B. 1998, ApJ, 499, L57
- (24) Prugniel, P. & Soubiran, C., 2001, A&A 369, 1048
- (25) Rachford, B.J., & Canterna, R. 2000, AJ, 119, 1296
- (26) Ryan, S., 2000, MNRAS, 316, L35
- (27) Simon, T., & Landsman, W.B. 1997, ApJ, 484, 360
- (28) Soubiran, C., Katz, D. & Cayrel, R., 1998, A&AS, 133, 221
- (29) Ulrich, R.K. 1971a, ApJ, 165, L95
- (30) Ulrich, R.K. 1971b, ApJ, 168, 57