DDO 88: A Galaxy-Sized Hole in the Interstellar Medium
Abstract
We present an H i and optical study of the gas-rich dwarf irregular galaxy DDO 88. Although DDO 88’s global optical and H i parameters are normal for its morphological type, it hosts a large (3 kpc diameter) and unusually complete ring of enhanced H i emission. The normal appearance of this galaxy in the optical and the outer regions of the H i give no hint of the presence of the striking H i ring in the inner regions. The gas ring is located at approximately one-third of the total H i radius and one-half the optically-defined Holmberg radius, and contains 30% of the total H i of the galaxy. The ring surrounds a central depression in the H i distribution. If the H i ring and central depression in the gas were formed by the energy input from winds and supernova explosions of massive stars formed in a starburst, the star-forming event would have formed 0.1–1% of the total stellar mass of the galaxy. However, the UBV colors in the H i hole are not bluer than the rest of the galaxy as would be expected if an unusual star-forming event had taken place there recently, but there is an old ( 1–3 Gyr), red cluster near the center of the hole that is massive enough to have produced the hole in the H i. An age estimate for the ring, however, is uncertain because it is not observed to be expanding. An expansion model produces a lower estimate of 0.5 Gyr, but the presence of faint star formation regions associated with the ring indicate a much younger age. We also estimate that the ring could have dispersed by now if it is older than 0.5 Gyr. This implies that the ring is younger than 0.5 Gyr. A younger age would indicate that the red cluster did not produce the hole and ring. Therefore, uncertainties prevent us from concluding that the cluster and the H i hole are definitely related. If this ring and the depression in the gas which it surrounds were not formed by stellar winds and supernovae, this would indicate that some other, currently unidentified, mechanism is operating.
1 Introduction
DDO 88 (NGC 3377A; UGC 5889), is a gas-rich dwarf irregular galaxy located in the Leo I group (M96). It came to our attention when 21 cm observations taken with the Very Large Array (VLA) Radio Telescope111The VLA is a facility of the National Radio Astronomy Observatory, operated by Associated Universities, Inc., under cooperative agreement with the National Science Foundation. indicated the presence of an apparent ring of H i surrounding the optical body of the galaxy (Simpson & Gottesman 2000). Although these data suffered from a lack of sensitivity, the suggestion of a large hole ( 2–3 kpc; D = 7.4 Mpc) in the H i distribution was intriguing. There are examples of other large holes in similar galaxies (Walter & Brinks 1999; Wilcots & Miller 1998; Puche et al. 1992; Sargent et al. 1983), but this seemed extreme.
Star formation episodes are thought to more strongly affect the interstellar medium (ISM) in low mass galaxies and have been invoked to explain the presence of shells, holes, and filaments observed in small galaxies (e.g. Ott et al. 2001; Stewart et al. 2000; Walter & Brinks 1999; Martin 1998; Meurer et al. 1998; Young & Lo 1996; Meurer et al. 1992; Puche et al. 1992; but see Rhode et al. 1999). Star formation in low mass, slowly rotating galaxies appears to be regulated by the feedback between the energy deposited in the ISM by massive star formation and the ISM itself. Energy transferred from stellar winds and supernovae events both heats up and disperses the ISM surrounding the star formation area (e.g. Scalo & Chappell 1999). It is thought that as the H i column density drops below a critical threshold neccessary for star formation to occur, the star formation episode will switch off. Meanwhile, cold, dense material is swept up and compressed around the edges of the region, triggering further star formation. This effect should be particularly strong on low-mass systems such as dwarfs (Mac Low & Ferrara 1999; de Young & Heckman 1994).
To further investigate the interplay between star formation and the H i reservoir in irregular galaxies, we have obtained additional radio and optical observations of DDO 88. High sensitivity VLA D-array and high resolution CS-array 21 cm observations have been taken, along with U, B, V, R, H, and H images, as well as long slit spectra. We present here the results from this new H i and optical study.
2 Observations
2.1 HI
DDO 88 was observed using the D-array configuration of the VLA for a total of approximately 7.5 hours over two days and for approximately 2.5 hours using the CS-array configuration. Table 1 lists all the observational parameters for each data set. The D-array provides numerous short spacings resulting in high sensitivity but low (nominally 45″) resolution, while the CS-array provides longer baselines and therefore higher resolution (nominally 12.5″), but with some loss in sensitivity.222The CS-array was a modified version of the C-array, with one antenna moved from the middle of the north arm to a central pad to provide some short spacings. It has since replaced the original C-array. All observations were made using a 128 channel spectrometer with a channel separation of 12.2 kHz (2.6 km s-1) resulting in a total bandwidth of 1.56 MHz. The 2IF mode was used with on-line Hanning smoothing. The nearby continuum source 1117+146 was used as a phase calibrator, with 1328+307 (B1950) used as a flux and bandpass calibrator for the D-array observations, and 0538+498 (J2000) used for the CS-array observations.
The observations were edited and calibrated using the standard routines in aips. There was solar interference present in all the data sets, primarily affecting the short baselines. The D array observations were the most affected, with up to 20% of the data contaminated. For both the D and CS data the contaminated visibilities were flagged, and satisfactory solutions were subsequently obtained. The continuum emission was removed in the u-v plane using an average of emission-free channels on both sides of the galaxy spectrum.
The D-array data sets from each day were edited and calibrated separately, then combined in the u-v plane and ourier-transformed using the aips task imagr to make a cube of images; one image for each frequency channel observed. Natural weighting was used to produce images with the greatest sensitivity to low-level emission. This image cube has a spatial resolution of , with a single channel r.m.s. () of 0.7 mJy/B. During imaging, each channel was cleaned (Clark 1980) to this level to remove the effects of the dirty beam. Channels containing signal in the resulting data cube were then integrated in velocity using the AIPS task momnt, which smooths the data spatially and in velocity before applying a conditional blanking to each channel. Pixels in the original (unsmoothed) cube that correspond to pixels in the smoothed cube with values below a designated level (in this case ) are blanked. The blanked cube, now containing only significant emission, is then integrated to produce three moment maps: the first is the integrated H i flux, the second is the temperature-weighted velocity field, and the third is a map of the velocity dispersions associated with each pixel.
When imaging the CS-array data, various weighting schemes were tested to find the optimal combination of resolution (beam size) and sensitivity (single-channel r.m.s.). Uniform weighting with a robust factor of produced images with the least degradation in sensitivity (single-channel noise increased by 1.5) for the best increase in resolution (beam size decreased by 1.6). This high resolution cube has a spatial resolution of ″ and a single-channel r.m.s. of 1.26 mJy/B. As with the D-array data, the CS-array data were cleaned to this level, and momnt was used to apply a conditional blanking (using a value of as a cutoff) and to integrate the cube to produce moment maps.
Finally, the edited, calibrated, and continuum-subtracted D and CS-array data sets were combined in the u-v plane to produce a data set with both good resolution (″) and sensitivity (0.98 mJy/B). This “CD”-array data set was then fourier-transformed and cleaned to the level using imagr. Uniform weighting with a robust factor of was used. Tests were run to determine the optimum value for the integration flux cutoff in momnt, and moment maps were produced using a cut-off value of .
The flux of the CD-array data cube was integrated in each channel containing signal over a square 184″ on a side, encompassing the area over which H i is detected in the integrated moment map. The velocity profile is shown and compared to the single-dish observation of Schneider et al. (1990) in Figure 1. The single-dish observation was made with the Arecibo telescope and a 3.3′ beam. Thus, the Arecibo beam is comparable to the size of the H i distribution that we detect. Our VLA flux profile has a peak that is 15% higher than the peak from the single-dish data. However, the total integrated flux is actually 5% lower than the corrected flux quoted by Schneider et al. The integrated flux from our D-array data alone, which is more sensitive to lower column density emission, is 6.04 Jy km s-1, which is 16% higher than the flux given by Schneider et al.. Therefore, it seems that we have recovered all of the flux detected by Arecibo, and perhaps a bit more.
2.2 Optical images
We obtained UBV images of DDO 88 using the Lowell Observatory 1.1 m Hall telescope March 1999 and April 2000. The detector was a SITe 20482048 CCD. The telescope position was offset 20″ between the three images taken in each filter in order to improve the final flat-fielding. Exposure times of 1800 s, 1800 s, and 1200 s for UBV, respectively, were used. The electronic pedestal was subtracted using the overscan strip, and the images were flat-fielded using sky flats. Landolt (1992) standard stars were used to calibrate the photometry. The pixel scale was 1.13″; the seeing was 3″. For doing surface photometry on the DDO 88 images, foreground stars and background galaxies were edited out of the images and the background sky was fit with a two-dimensional Legendre function and subtracted.
We also obtained H images of DDO 88 during April 1995 with the Perkins 1.8 m telescope at Lowell Observatory. The observations used an 800800 TI CCD provided to Lowell Observatory by the National Science Foundation, the Ohio State University Fabry-Perot that was used simply as a 3:1 focal reducer, an H filter with a FWHM of 32 Å, and an off-band filter centered at 6440 Å with a FWHM of 95 Å. The off-band filter was used to subtract stellar continuum from the H filter to leave only H nebular emission. The H exposure was 1800 s. The pixel scale was 0.49″, and the seeing was 2.3″. The H emission was calibrated using five spectrophotometric standard stars with minimal H absorption features (Stone 1977; Oke & Gunn 1983). The H filter was also calibrated on other observing runs with spectrophotometry of the H ii regions NGC 2363 (Kennicutt, Balick, & Heckman 1980) and NGC 604 (Hunter & Elmegreen 2004), and the H ii region calibration agreed with the spectrophotometric standard star calibration to 4%. The H photometry was corrected for the change in band-pass with temperature and [NII] contamination, although these corrections were small. A standard Anderson Mesa atmospheric extinction coefficient was assumed for H.
The H band data were taken on February 28, 2003 at the WIYN Observatory 3.5 m telescope at Kitt Peak National Observatory. The Near-Infrared Imager (NIRIM) was used (Mexiner, Young Owl, & Leach 1999) with a plate scale of 0.69″/pixel, and a field of view of 2.9″2.9″. The data were dark-subtracted and flat-fielded (using dome flats). Source and sky images were taken in an off-on-on-off repeating pattern to enable the removal of atmospheric background emission. The median of the three or four sky images closest in time was subtracted from each on-source image. The individual on-source frames were shifted to align to the nearest half pixel, and combined. This resulted in a total of 15 minutes on-source integration. The data were calibrated using the only two stars on the image bright enough to be present in the 2MASS catalog333http://www.ipac.caltech.edu/2mass, and thus we estimate that the magnitudes are accurate to only 30%.
In addition to the UBVH and H images presented here, B, R, and H images of DDO 88 obtained with the Michigan-Dartmouth-MIT Observatory 1.3 m telescope were discussed by Knezek, Sembach, & Gallagher (1999). We employ those data here as well. See Knezek et al. for details on the reduction of those data.
2.3 Optical spectroscopy
Long-slit spectra were obtained of DDO 88 along three position angles with the Double-Imaging Spectrograph on the 3.5 m telescope at Apache Point Observatory 20-22 1998 March. The spectrograph uses a dichroic and two independent collimators and cameras to allow one to obtain a blue and a red spectrum simultaneously. There were 4 grating setups used to observe DDO 88, and they have the following wavelength coverages and dispersions: 1) blue: 4360–5090 Å, 1.55 Å/pixel; red: 5890–6915 Å, 1.3 Å/pixel; 2) blue: 3800–4680 Å, 1.55 Å/pixel; red: 4500–6230 Å, 1.3 Å/pixel; 3) blue: 3600–6420 Å, 6.3 Å/pixel; red: 3600–8470 Å, 7.2 Å/pixel; and 4) blue: 3600–6420 Å, 6.3 Å/pixel; red: 4300–9800 Å, 7.2 Å/pixel. A 1.5″ slit was used at position angles of 155.5°, 51.5°, and 124°. Spectrophotometric standard stars were observed to determine the response function, and HeNeAr arc lamps were used to set the wavelength scale.
The blue camera used a 512512 SITe CCD with a scale of 1.1″/pixel and the red camera used an 800800 TI CCD with a scale of 0.6″/pixel. The electronic pedestal was subtracted from the two-dimensional images, a bias frame was subtracted, and pixel-to-pixel sensitivity variations were removed using observations of internal continuum lamps. The arc lamps were traced along the slit to map spatial distortions and the images were linearly repixelized in wavelength. The two-dimensional images were corrected for extinction using the standard extinction function from Kitt Peak National Observatory, they were fluxed using the sensitivity function determined from the standard stars, multiple images were combined to remove cosmic rays, and background sky was fit and subtracted using the part of the slit beyond emission from DDO 88. Finally, the H ii regions along the slit were identified, and one-dimensional spectra were extracted.
The emission lines in each one-dimensional spectrum were fit with Gaussians to determine the flux. The signal-to-noise of a line was taken as the rms of the continuum surrounding the emission line times the FWHM of the line. Several spectra were smoothed to increase the signal to noise. Since there is more than one grating setting for each slit position, there are often multiple measurements of a line. In addition, two H ii regions were captured on two slit positions. Therefore, the emission-line flux ratios were taken as the average.
Emission-line ratios are given in Table 2. The ratio of [OIII]5007/[OIII]4959 is one diagnostic of the quality of the data. For a nebula with an electron density of 100 cm-2 and a nebular temperature of 104 K, this ratio should be 2.9. For our H ii regions, the ratio is within 1 of the expected value. For these same nebular parameters, we determine the E(BV) from the ratio of H to H, using the Cardelli, Clayton, & Mathis (1989) reddening function. These values range from 0.030.08 to 0.160.10, where foreground E(BV)f is 0.01. [OII]3727 was measured only for one H ii region. The method by McGaugh (1991) for determining the oxygen abundance from [OIII]5007,4959 and [OII]3727 yields a value of 7.9 for 12log(O/H) if we assume the lower abundance branch and 8.8 if we assume the higher abundance branch. A value of 7.9 would place DDO 88 at the low abundance end of the range for Im galaxies, and a value of 8.8 would be higher than most Im galaxies (Hunter & Hoffman 1999).
3 Results: Optical
3.1 General morphology
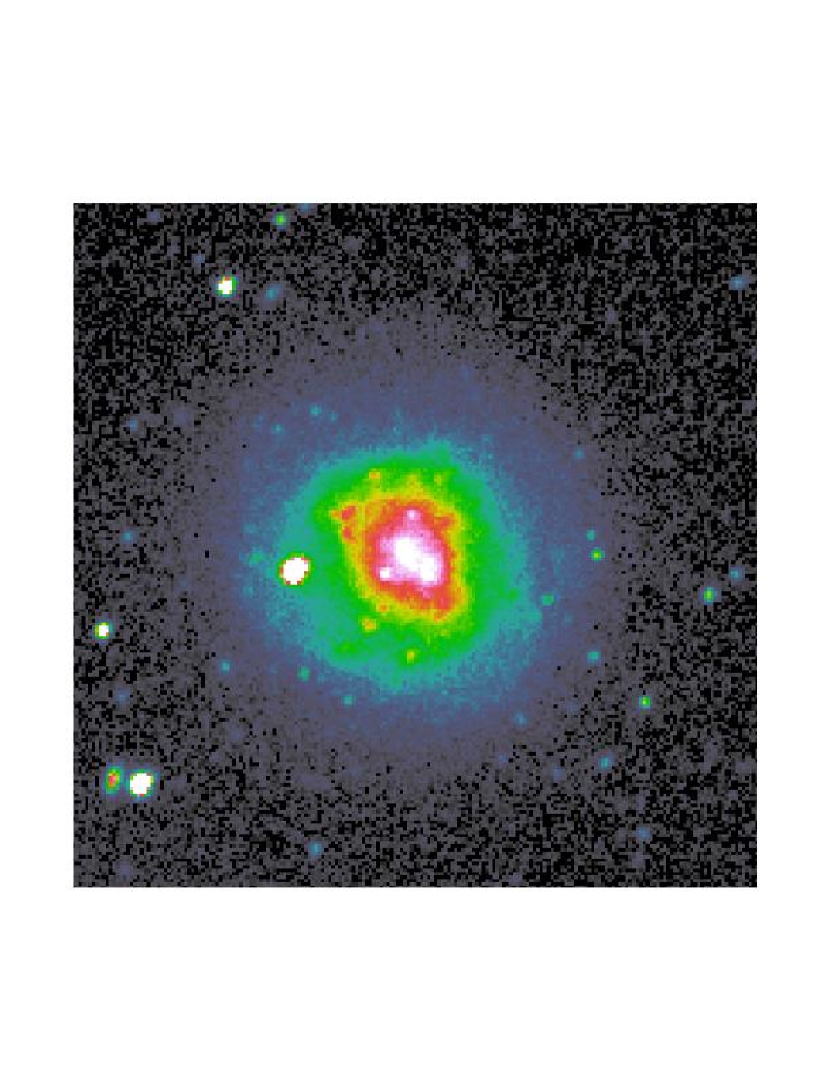
Our V-band image of DDO 88 is shown in Figure 2. We display the logarithm of the image in a false-color representation so that the reader can see the bright inner parts and the fainter outer parts in one image. We see that DDO 88 changes its shape slightly as it goes from the inner to the outer galaxy, becoming more round in the outer parts. Specifically, we find an ellipticity () from the minor-to-major axis ratio of 0.13 in the inner galaxy at a V-band surface brightness corrected for reddening of 23.7 mag to 24.7 mag and an ellipticity of 0.03 in the outer parts at a of 26.2 mag. If the intrinsic is 0.3 (Hodge & Hitchcock 1966), as is often taken for irregulars, the observed outer implies an inclination of 16°. Thus, the galaxy is observed close to face-on.
In the V-band image we can also see an asymmetry at low surface brightness levels. The galaxy appears to be slightly more extended to the north and northwest than to the south and southeast. However, this kind of optical asymmetry is seen in other irregular galaxies (see, for example, NGC 2366; Hunter, Elmegreen, & van Woerden 2001). DDO 88 is located only 15 kpc on the plane of the sky and 93 km s-1 radially from the giant elliptical galaxy NGC 3377 (hence, DDO 88’s alternate name of NGC 3377A). However, except for this small optical asymmetry, we see no signs of disturbance in DDO 88 that could be ascribed to an interaction with this much larger galaxy (NGC 3377 is about 3 mag brighter in B than DDO 88).
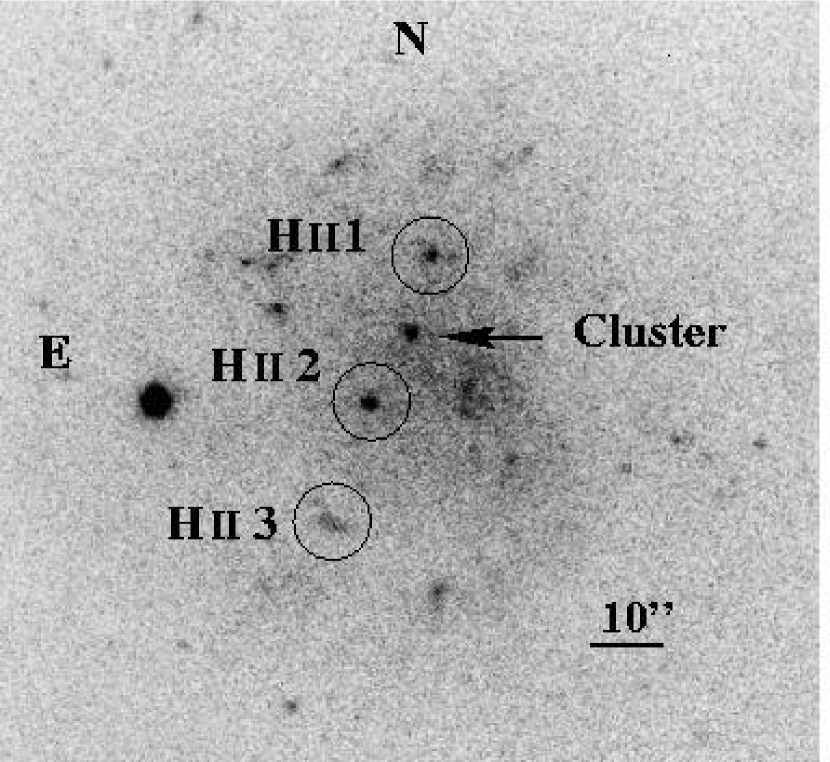
There is a red object located in the center of the galaxy that is visible in the H-band image. Radial profiles on both the V and H images show that it is extended, so it is probably a star cluster. It is the center of the three bright regions extending from the northwest to the southeast in Figure 3444Digitized image obtained from NED. http://nedwww.ipac.caltech.edu.. The other two bright regions bracketing the cluster are H ii regions 1 and 2 in Table 2. Region 2, just to the southeast of the cluster, also shows up in the H image; it is the only H ii region detected in H. We have performed multi-aperture photometry of both the cluster and the southeast H ii region which is discussed below.
3.2 Surface Photometry
UBV and H surface photometry are shown in Figure 4. Because the galaxy is nearly face-on, we used circular apertures increasing in radius from 11.3″ to 79.4″ in steps of 11.3″. All photometry has been corrected for reddening using a total E(BV)t=E(BV)f0.05, where the foreground reddening E(BV)f is 0.01 (Burstein & Heiles 1984). We use the reddening law of Cardelli et al. (1989) and AV/E(BV)3.1.
Integrated magnitudes and colors are given in Table 3. We measured an integrated B magnitude of 14.000.02. This can be compared to a value of 13.97 given by de Vaucouleurs et al. (1991) and 13.95 measured by Knezek et al. (1999), both corrected for extinction using our values. Thus, MB,0 is to a radius of 79″. The integrated (UB)0 is and (BV)0 is . These are within 0.05 mag and 0.03 mag, respectively, of the values given by de Vaucouleurs et al. (1991). The integrated (VH)0 is , which is similar to NGC 1156 (2.1; Hunter & Gallagher 1985), but redder than NGC 4449 (1.9; Hunter, van Woerden, & Gallagher 1999) and NGC 2366 (1.3; Hunter, Elmegreen & van Woerden 2001) when measured to comparable radii. The agreement of the integrated colors and magnitudes with other values in the literature gives us confidence in our calibration and photometry. The integrated colors show that DDO 88 lies at the red end of the distribution of a large sample of Im and Sm galaxies in a UBV color-color plot (see Figure 2 of Hunter 1997).
From as a function of radius, we measured R25 to be 0.83′ (1.8 kpc). Our radius is 26% smaller than that given by de Vaucouleurs et al. (1991), but 11% larger than the radius measured by Knezek et al. (1999). The Holmberg radius, RH, originally defined to a photographic surface brightness, is measured at an equivalent B-band surface brightness . For a (BV)0 of 0.5, the Holmberg radius is determined at a of 26.6 magnitudes arcsec-2. We are able to measure only just to the Holmberg radius. We find that RH is 1.2′ (2.6 kpc).
We fit a line to in the inner 17″–62″, and the fit is shown as the solid line in Figure 4. DDO 88 is fit well with an exponential disk profile having a central V-band surface brightness of 21.970.04 magnitudes arcsec-2. If , is ′ or kpc. Our value is low compared to the and of 50″ and 48″ measured by Knezek et al. (1999). De Jong (1996) has determined disk characteristics of a large sample of galaxies spanning a wide range in type. DDO 88 has a central surface brightness, corrected to the B passband, that is a little high and a disk scale length that is a little low compared to what de Jong finds for late-type galaxies.
As in most irregulars, colors in DDO 88 are quite constant. Figure 4 indicates that DDO 88 does not exhibit any major color gradient with radius. The slopes of the V and H surface photometry plots are and , respectively. In addition two-dimensional ratio images confirm what is seen in the azimuthally-averaged colors: that there are no regions other than the central cluster and star-forming regions associated with H ii regions that are significantly different in color from the rest of the galaxy.
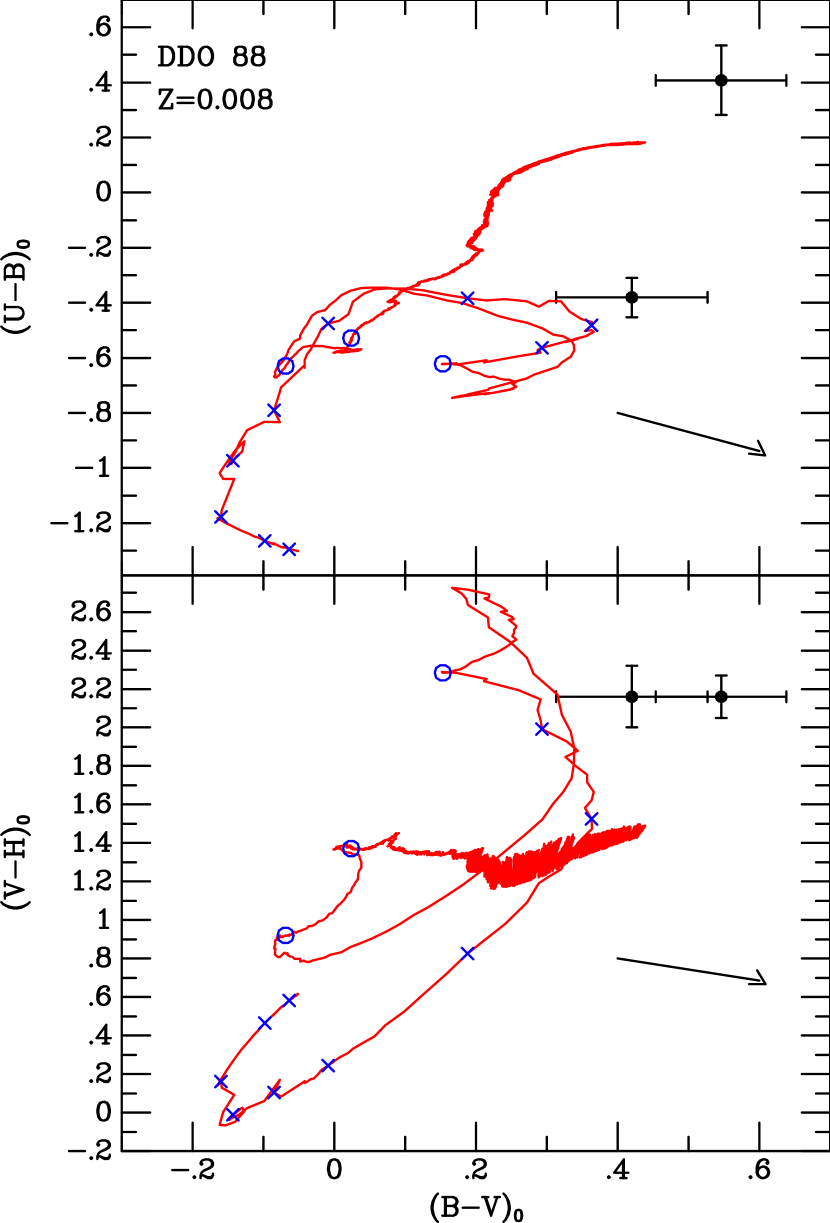
The integrated colors of the central cluster are (UB) and (BV), which are red. This could indicate either that the cluster is old, or heavily reddened. Photometry of the nearby H ii region (region 2), however, shows no excessive reddening ((UB) and (BV)), which is confirmed by the spectroscopy. Reddening in the center of the galaxy near the cluster is therefore modest, so it is likely that the cluster’s colors are due to age. We have used the Leitherer et al. (1999) cluster evolutionary models to compute evolutionary tracks for both the cluster and the nearby H ii region (region 2) (Figure 5). The H ii region colors are consistent with an age of 7–10 Myr, as expected. The red central cluster colors agree with an age of 1–3 Gyr. This will be discussed further in Section 5.3.
3.3 Star-Forming Regions
Figure 1b of Knezek et al. (1999) displays a nice color-composite image that shows their H image of DDO 88 on broad-band B and R images. One can see a modest number of H ii regions spread over the galaxy. The furthest distinct H ii region is found at a radius of 2.0 kpc from the center of the galaxy. This radius is 1.1R25 or 0.8RH. The H ii regions are quite modest in luminosity. If we take the H luminosity of the Orion nebula as ergs s-1, the four brightest H ii regions are only 2–6 Orions in luminosity.
The integrated H luminosity and inferred star formation rate are given in Table 3. We have corrected the H fluxes for reddening assuming an internal E(BV) of 0.1 mag and an external reddening of 0.01 mag. The total H luminosity for the galaxy represents about 80 times that of the Orion nebula. The star formation rate (SFR) is determined from the H luminosity using the formula of Hunter & Gallagher (1986) which assumes a Salpeter (1955) stellar initial mass function from 0.1 M☉ to 100 M☉. In order to compare to other galaxies, we normalize the SFR to the size of the galaxy. Here we use the size as defined by R25. The normalized SFR is quite normal compared to other Im and Sm galaxies (see Figure 7 of Hunter 1997). At its current rate of consumption, the galaxy can turn gas into stars for another 19 Gyr if all of the gas (H iHe) associated with the galaxy can be used. The timescale to run out of gas becomes even longer if recycling of gas from dying stars is also considered (Kennicutt, Tamblyn, & Congdon 1994). As Knezek et al. (1999) point out, this galaxy can form stars at this rate for a very long time yet to come. We note that the LHα given by Knezek et al. is a factor of 5 higher than what we measure here. We have not been able to determine the cause of this difference.
In Figure 6 we show the azimuthally-averaged H surface brightness and compare it to . Outside of the center which is depressed in H emission, the H surface brightness drops at a rate comparable to that of the starlight. As in most Im and Sm galaxies, the current star formation activity ends before the detected starlight ends. The outer 36% of the galaxy by area in which we detect starlight, as defined by the Holmberg radius, contains no detectable H ii region.
4 Results: H i
4.1 H i Morphology
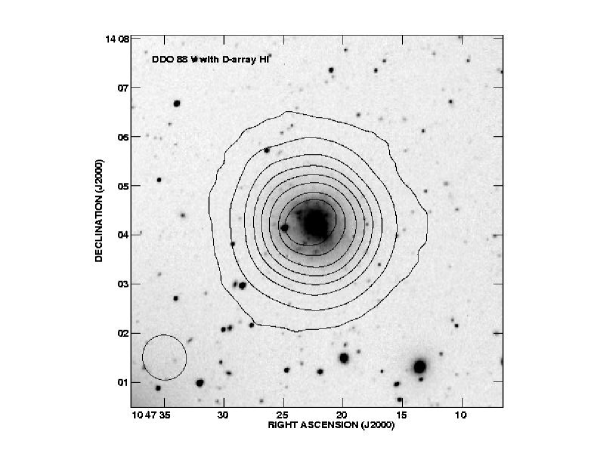
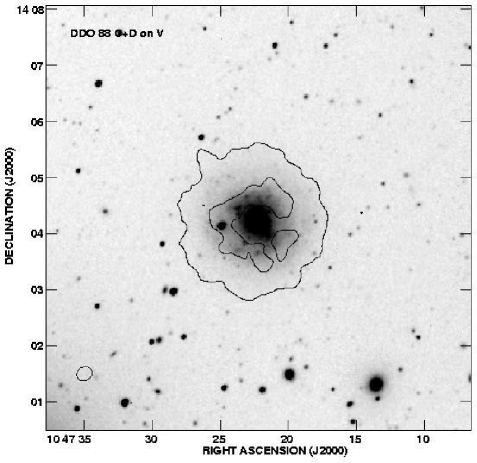
Measured H i parameters are shown in Table 4. In the high sensitivity D-array integrated flux map the diameter of the H i at a column density of atoms cm-2 is 4.1′ (8.8 kpc). The total H i mass detected in the system is M☉. These data lack the resolution to detect any structure in the H i distribution, however, and the map shows essentially circular contours of smoothly increasing density towards the center of the system. The H i contours on the V band image are shown in Figure 7.
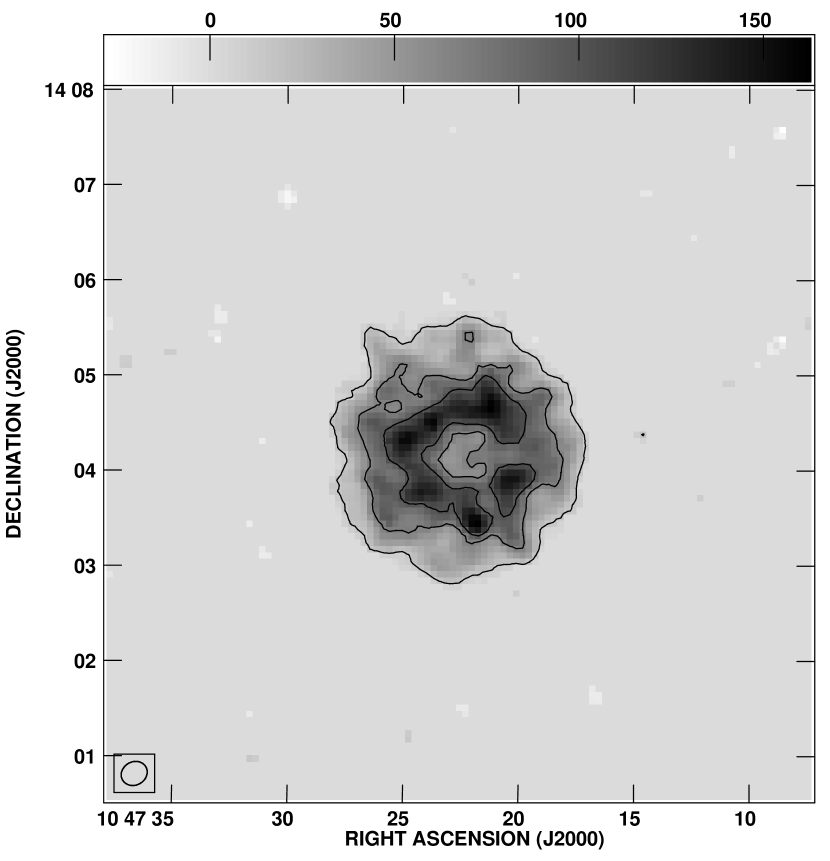
The CD array flux map (Figure 8), with its decreased sensitivity to low-level emission, can only be measured out to atoms cm-2. The diameter at the atoms cm-2 level, 2.8′ (5.9 kpc), is 32% smaller than that detected in the D-array data, as it misses the low-level outer envelope. The higher resolution in this data set is better able to resolve the structure in the higher density H i gas, however. The most striking feature in this flux map is a high density ring in the H i distribution. Defining the H i ring as the region containing emission at levels greater than atoms cm-2, it has an outer diameter of 3.4 kpc with an average radial thickness of 0.8 kpc and and average column density of atoms cm-2. The ring contains M☉ of H i which is 30% of the total H i mass as measured from the D-array data. This ring surrounds a central depression or hole in the H i which has a diameter of 49″ (1.8 kpc), and apparently surrounds the highest surface brightness region of the optical (V band) emission, as demonstrated in Figure 9. The star cluster is located near the center of the hole, but is not visible in this image.
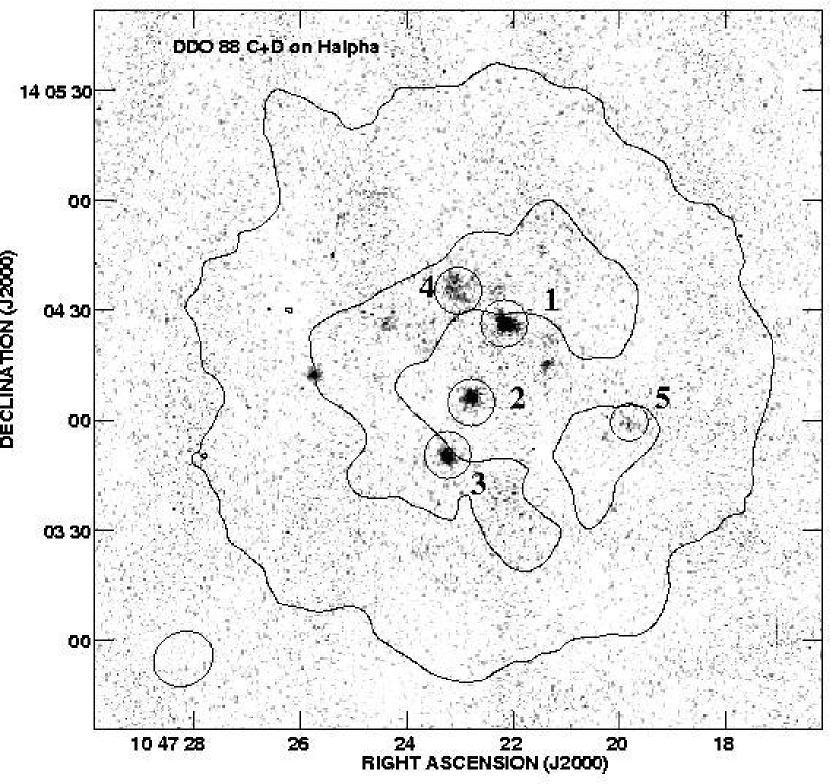
There are several discrete clumps of H i embedded in the ring which are not resolved. The average column density in these knots is about atoms cm-2, with peak column densities ranging from 6.6– atoms cm-2. The largest knot, in the south part of the ring, contains about M☉. These knots do not appear to coincide with any noticeable optical features in either the V or H images. Instead, two of the bright H regions (regions 1 and 3) are located on either inside edge of the ring in the southeast and the northwest, and the third (region 2) is inside the hole in the H i ring (Figure 10).
4.1.1 Surface density profile
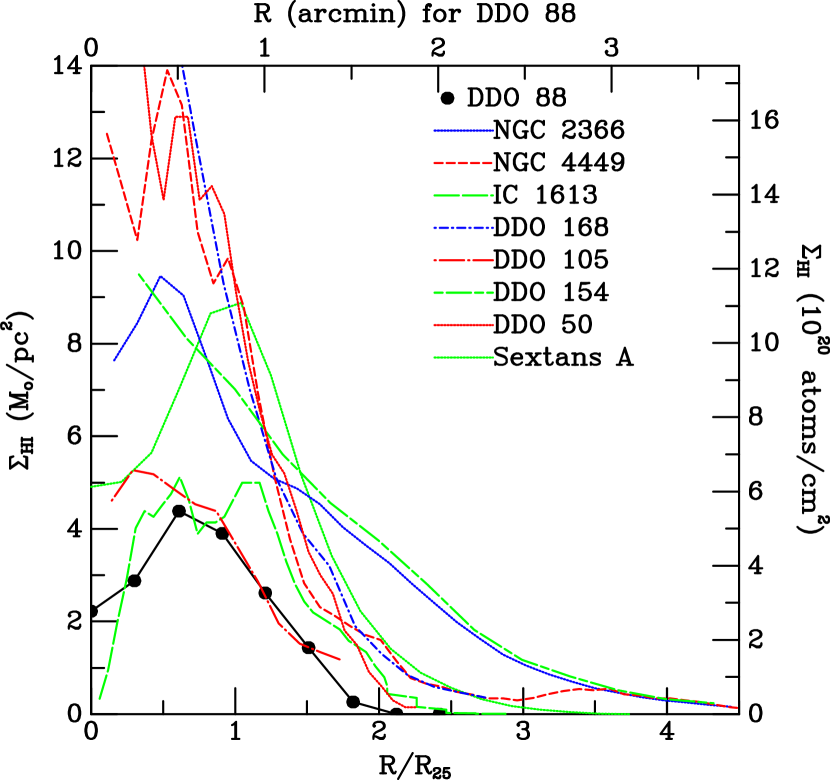
In Figure 11 we show the azimuthally-averaged surface density of the H i gas in DDO 88. We have integrated the H i in 15″ radial steps using a position angle of 215° and inclination of 28° as determined from the H i kinematics. Along with DDO 88, we plot other irregular galaxies for comparison. From the Figure we see that, outside the center (30″), the gas surface density drops off fairly smoothly. The rate at which the H i drops off with radius is similar to that of other irregulars such as DDO 105 and IC 1613. However, the drop-off is somewhat shallower than DDO 50’s, Sextans A’s, and DDO 168’s, but steeper than NGC 2366’s and DDO 154’s. In all, the azimuthally-averaged drop-off of the H i surface density with radius appears to be well within the range of what is observed in other irregular galaxies. A central depression in the H i surface density is seen in other galaxies as well, such as IC 1613, Sextans A, NGC 2366, NGC 4449, and possibly DDO 105.
The extent of the H i relative to the optical as measured by R25 is a little low compared to the collection of irregulars in Figure 11, but is nevertheless the same as that of DDO 105 and cannot be considered too unusual. In addition the ratio of RHI/RH in DDO 88 is 1.7 where RHI is measured to a column density of atoms cm-2. Figure 13 of Hunter (1997) collects RHI/RH for various irregulars from data in the literature. DDO 88 is seen to lie at the peak in the number distribution.
The overall level of the H i surface density is low compared to that seen in other Im galaxies in Figure 11; DDO 88 is seen at the low end of the range in peak . This may explain why the star formation activity in this galaxy is so modest, although generally there is no correlation between maximum gas surface density and integrated star formation activity in irregulars (Hunter, Elmegreen, & Baker 1998). Furthermore, it is interesting and puzzling that we see H ii regions in DDO 88 in the central part of the galaxy where the H i surface density is even lower. Generally in Im galaxies the star-forming regions are found where the gas surface density is locally higher than the azimuthally-averaged surface density (van der Hulst et al. 1993; van Zee et al. 1997; Meurer et al. 1998; Hunter, Elmegreen, & van Woerden 2001).
4.2 Kinematics
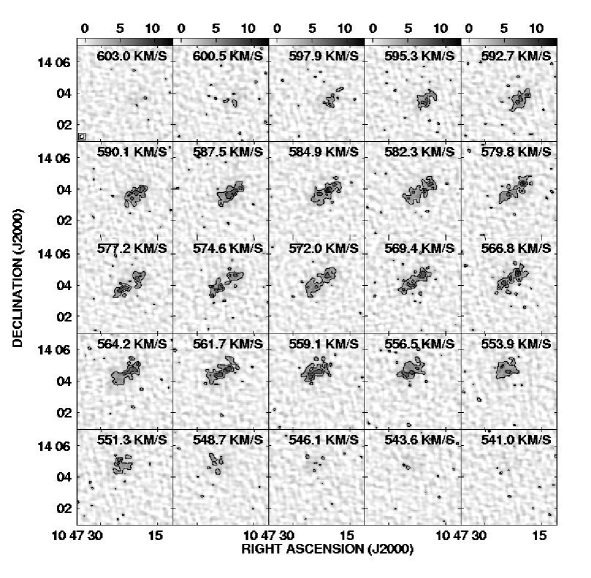
The CD-array channel maps (Figure 12) show H i emission between 541 km s-1 and 606 km s-1. One can see mostly ordered, largely solid body rotation, with “clumps” of H i embedded in low level gas apparent in each channel. Many dwarf galaxies exhibit solid body rotation over much of their areas (Swaters 1999), and DDO 88 would seem to be no exception.
4.2.1 Rotation curve
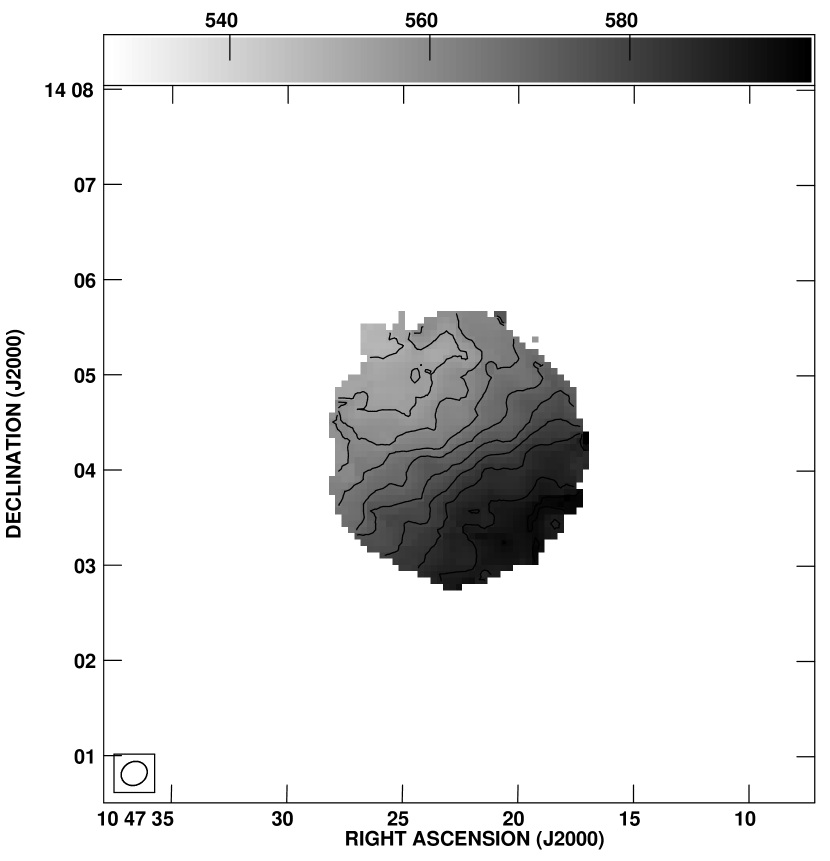
The velocity field of DDO 88 (Figure 13) clearly shows ordered rotation, so we have fit a rotation curve to the velocity field. We began by fitting the first moment map of the CD array data with a Brandt function and allowing all parameters to vary. The fit was reasonable, and from this we fixed the center at 10h 47m 22.52s 0.02s, 14° 04′ 10.5″ 0.3″. With the center fixed, we fit a solid body rotation law to the inner 40″ radius and determined a systemic velocity Vsys of 573.20.1 km s-1. Then fixing the center and central velocity, we fit concentric rings 10″ wide and in 10″ steps. First, we allowed the position angle, inclination, and radial velocity to vary. We found that the position angle and inclination were fairly constant with radius beyond the inner 20″ radius, so we determined an average position angle of 215.4°3.5° and an average inclination of 28°8°. With all but the rotation velocity fixed, we then reran the fits to the velocity field in concentric annuli. We also fit the velocity field of the D-array data alone. The D-array data are of lower resolution but sensitive to more extended H i emission. To fit the D-array data we assumed and fixed the center, Vsys, PA, and determined from the CD array data and solved for the rotation velocity in annuli of 25″ width.
The final rotation curves for the CD array data and for the D-array data alone are shown in Figure 14. One can see that the rotation curve from the CD array data rises steeply to a radius of about 20″ and then rises more shallowly, possibly leveling off at a radius of about 65″. The maximum rotation speed is 45 km s-1 at a radius of 65″. The rotation curve from the D-array data alone rises more gradually and appears to level off around a radius of 90″ with a maximum rotation speed of 41 km s-1. The shallower rise in the D-array rotation curve is undoubtedly due to the large beam size (55″) compared to that of the CD array data (beam size of 17″).
The rotation curve and maximum rotation speed observed in DDO 88 are normal for its luminosity. Figure 1 of Hunter, Hunsberger, & Roye (2000) plots the maximum rotation speed against MB for a sample of Im and Blue Compact Dwarf galaxies. With an MB of and a maximum rotation speed of 45 km s-1, DDO 88 lies very close to the ridgeline of the sample. Figure 4:5 of Swaters (1999) shows that the shape of the rotation curve is also fairly normal.
4.2.2 Velocity dispersion
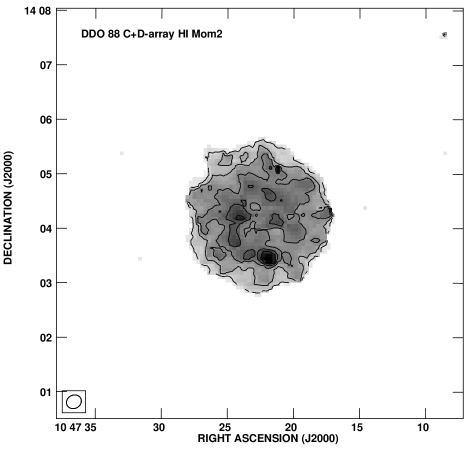
The average velocity dispersion in the second moment map is on the order of 5 km s-1. On average, the gas dispersions are slightly higher in the area of the ring: 7–9 km s-1 vs. 4–5 km s-1 in the outer regions. There is one notable higher dispersion knot (up to 12 km s-1) located in the southwest (Figure 15). This high dispersion region is associated with the brightest H i knot in the ring, but interestingly, it is not associated with any significant optical feature in either the V or H images. We have fit Gaussians to the spectra of pixels within the knot; the spectra are shown in Figure 16. Most of the spectra, particularly those located within roughly a beam-width of the center of the knot, exhibit a central peak with two smaller peaks on either side. Our gaussian fits indicate that these side components occur at approximately km s-1 of the central components. The central components have amplitudes of about 6 mJy/B, and the side components are roughly half that. The width of the central components average about 13 km s-1, while the side components average 8 km s-1.
The presence of three components could be interpreted as a primary central cloud of gas that contains a shell of gas that is expanding at 20 km s-1. The presence of an expanding shell at that velocity wouldn’t be unusual in a star-forming region, nor should it require large numbers of stars to form such a shell. However, we would expect to see H emission associated with this kind of star-forming event, which we clearly don’t, so this is puzzling. Because we are unable to distinguish whether the shell is expanding or contracting, perhaps instead we are seeing the collapse of what will become a star-formation region in the future.
5 Discussion
5.1 Comparison to other holes
The 3.4 kpc hole in the center of the integrated H i in DDO 88 is what intrigued us about this galaxy. Other irregulars do have holes in their ISM created by the winds and supernova explosions of concentrations of massive stars or by instabilities in the multi-phase ISM (Wada, Spaans, & Kim 2000). DDO 81 (M) has 6 holes with diameters greater than 1 kpc, and the largest hole has a diameter of 1.9 kpc (Walter & Brinks 1999). IC 10 (M) has no holes as large as 1 kpc; all are 100–200 pc in diameter (Wilcots & Miller 1998). Holmberg II (M) has 13 giant ( kpc) holes and the largest is 1.9 kpc in diameter (Puche et al. 1992). Holmberg I (M) has a large hole just south of the center of the galaxy that is 1.2 kpc across (Ott et al. 2001). The tiny M81dwA (M) has a central minimum in its H i that is 960 pc in diameter (Sargent et al. 1983). Thus, DDO 88 is not alone in having such a gas hole. However, holes this large are rare and may be especially unusual in a galaxy of this luminosity.
5.2 The Central H i Minimum
Here we consider the possibility that the central H i minimum is not a minimum in the gas, but rather that the H i has been replaced with molecular gas there. If this were the case, we can estimate the amount of H i that is “missing” and therefore in the form of H2. Assuming the average surface density of H i in the center before any conversion to molecular gas would have been equivalent to that in the ring, we calculated the total H i mass expected before conversion, then subtracted out the amount of H i currently in the minimum. The mass of the “missing” gas is then M☉. This mass would correspond to 10 giant molecular clouds (GMC) in the Milky Way where a typical GMC has a mass of M☉ (HHe) (Scoville & Sanders 1987). To see if this is possible, we consider the consequences of such a large molecular complex: the ratio of molecular-to-atomic material, embedded star formation, and optical extinction.
Molecular clouds in irregular galaxies are usually part of larger H i complexes (Rubio et al. 1991, Ohta et al. 1993). In the irregular NGC 4449, Hunter, Walker, & Wilcots (2000) found M/MHI is of order 0.1–1.8 in the star-forming regions of the galaxy. In DDO 88, if the central region is filled with M☉ of molecular gas, for the measured H i mass of M☉ in the center of the ring, the ratio of M/MHI is 0.5. If we consider the H i ring to be part of the H i complex that hosts the central molecular complex, the ratio is 0.1. These values are within the range of ratios observed in other irregulars.
If the central region is filled with a large molecular cloud complex, we would reasonably expect it to be forming stars unless it is caught in a very special time. We do see a few small H ii regions there, but not at a level that would indicate massive amounts of molecular gas. However, there could be embedded star formation that is not optically visible. If so, such star formation would be detectable in the far-infrared. DDO 88 was not detected by IRAS, but observations by IRAS do provide upper limits on the FIR fluxes. These are given by Melisse & Israel (1994) as 90 mJy for the flux at 60 m and 130 mJy for the flux at 100 m. Thus, the FIR luminosity L ergs s-1, and LFIR/L and LFIR/L. Figure 2 of Hunter et al. (1989) shows a histogram of LFIR/LHα for a collection of Im and Sm galaxies detected by IRAS. We see that DDO 88’s upper limit of LFIR/LHα is normal among irregular galaxies and, because this is an upper limit for DDO 88, the real value could be low compared to these other galaxies. LFIR/LB for DDO 88 is already at the low end for irregulars. The values of LFIR/LHα observed for this sample of Im galaxies were interpreted by Hunter et al. as consistent with very little embedded star formation not detected by H. Thus, it is unlikely that there is extensive star formation optically shrouded in a central molecular complex in DDO 88.
If the central region is filled with molecular gas, we would also expect the extinction in this region to be much higher than elsewhere in the galaxy. As seen in our Figure 4 and Figure 2a of Knezek et al. (1999), the UBVR colors in the center of the galaxy are only slightly redder than most of the rest of the galaxy: UB, BV, and BR are 0.1 mag redder than the bluest annulus in the galaxy. Furthermore, the surface photometry in V is also only slightly (0.2 mag) dimmed in the center relative to the projected fit to the rest of the photometry. Thus, the azimuthally-averaged surface photometry of the galaxy does not indicate significant extinction in the center of the galaxy. This is in agreement with the reddening (E(BV)) determined for H ii regions in DDO 88 using long-slit spectroscopy; these are given in Table 2. H ii region number 2 in the Table is near the middle of the H i hole. It has an E(BV) of 0.130.05 mag. Foreground reddening is 0.01 mag, so the reddening internal to the HII region is 0.120.05 mag. This is quite modest, typical of an H ii region in an Im galaxy (Hunter & Hoffman 1999), and shows that the H i hole is not heavily reddened.
Thus, we conclude that the central depression in the H i is unlikely to be filled with gas in molecular form. Although the M/MHI ratio would not be unusual, the lack of star formation and of significant extinction are not consistent with the presence of a large molecular complex.
5.3 Formation of the Hole
If the hole was formed by the action of winds and supernova explosions, what sort of star formation event would be required? The H i ring contains 2 M☉ and the hole has an inner radius of 880 pc. We do not detect expansion in the ring, but the background velocity dispersion is 6 km s-1. We will assume that the ring attained its final size when its expansion velocity slowed to the background velocity dispersion. The models of Chevalier (1974) for expansion into a uniform medium give the total energy as ergs for our ring velocity and radius.
From the surface density profile in Figure 11 we see that the surface density of the H i surrounding the hole is of order cm-2 and we assume this as the pre-hole surface density. The thickness of the galaxy is a harder quantity to estimate. The diameter of the hole, 1.8 kpc, provides a limit. With this thickness, we have is 0.1 cm-3. This is probably a lower limit, and we will take an of 1 cm-3 as an upper limit. For 0.1 cm-3, is ergs, and for 1 cm-3 it is 10 times higher.
With an estimate of we then turn to the shell models of McCray & Kafatos (1987) to solve for N⋆, the number of stars with mass greater than 7 M☉ that formed the shell. If is 0.1 cm-3, N⋆ is 1500. For a Salpeter (1955) stellar initial mass function extending from 0.1 M☉ to 100 M☉, the number of O stars (18–100 M☉) would be 390 and the total mass in stars formed in this event would be M☉. If is 1 cm-3, these numbers would be 10 times higher.
A sanity check is given by NGC 206, a double OB association in M31 which is sitting in an 800 pc diameter H i hole (Brinks 1981). The mass in stars of the OB associations that presumably made the hole is M☉ (van den Bergh 1966). Thus, the hole in DDO 88, which is twice the size, would require 1–10 times more mass in stars to form. So, this rough estimate seems reasonable.
What would such a star-forming event mean to the galaxy? We can estimate the total mass in stars in the galaxy from the V-band luminosity (M) if we assume an average mass-to-light ratio. From the models of Larson & Tinsley (1978), the integrated UBV colors of the galaxy are consistent with constant star formation over the past 10 Gyr or a burst 500 Myr ago. Even if the central star-forming event represents a recent burst of star formation, this event is unlikely to have made the bulk of the stars in the galaxy. Therefore, we assume the constant star formation model for which the mass-to-light ratio is 1 M☉/L. Thus, the total mass of stars in the galaxy is of order M☉. This means the star-forming event required to make the central hole in the H i would have produced of order 0.1%–1% of the total mass of the galaxy, the range representing the two limiting . By comparison, the current star-forming activity is contributing 0.03% of the galactic mass in stars. Therefore, the star-forming event needed to make the H i hole is 4–40 times higher than the current rate and would represent a modest to vigorous star-forming event in the life of the galaxy.
If the hole was not formed by the action of newly formed massive stars, how then did it form? Wada, Spaans, & Kim (2000) have suggested that holes can form in the ISM of galaxies by the nonlinear development of the combined thermal and gravitational instabilities in the disk gas. This does not require the immediate presence of a starburst. This model is used to explain the multitude of holes and filaments found in Im galaxies like the LMC and DDO 50. In their model a spectrum of sizes of holes is formed, with the typical holes being 500 pc in diameter or less. A few holes of kpc size are formed, but rarely. Thus, the hole in DDO 88 would be an extraordinary event even in their model. Furthermore, there are no other holes in DDO 88—just one big one. This does not really make sense in the context of the Wada et al. models.
Thus, we return to the injection of energy by massive stars longer ago than 0.5 Gyr as the only mechanism for forming the hole in DDO 88 that makes sense. Is the age of the ring consistent with this? Could the red cluster in the center be the remnant of such an event? As we don’t detect expansion in our H i data, the ring has apparently stalled. If we assume that expansion stopped when the expansion velocity equalled the dispersion velocity in the gas, this method provides an upper limit to the time it took to form the ring. Using a dispersion velocity of 6 km s-1 and a size of 880 pc (the inner radius of the hole), this gives us an upper limit of approximately 145 Myr during which the hole and ring were formed. If we use the distance from the center of the hole to the midpoint of the H i ring (1.28 kpc) as our size instead, the maximum expansion time becomes 210 Myr. Note that this does not tell us how long ago the expansion stopped, so in that sense it serves as a rough lower limit to the age of the ring; with the caveat that the ring could also have formed somewhat faster than we have calculated here.
Ott et al. (2001) use a variety of methods to estimate the age of the large stalled H i shell they observed in the low mass dwarf Holmberg I (Ho I). This shell, which surrounds a depression in the H i just south of the center of the galaxy, dominates the appearance of the galaxy. It extends to approximately half the optical size of the galaxy, similar to what we see in DDO 88. The size of this shell (center to point of maximum H i emission) is 850 pc, which is smaller than the 1.28 kpc for DDO 88’s ring, but is similar to the inner radius of the ring surrounding the hole in DDO 88. Using their shell radius and a background dispersion of 9 km s-1, they estimate a maximum duration of expansion of 90 Myr. This agrees with the total age they find from the central colors using the Leitherer et al. (1999) models, as well as the ages of stars observed in the H i shell itself. They also calculate the age of the shell using a Sedov expansion model (Sedov 1959; Mac Low & McCray 1988; Ehlerová et al. 1997) for the time prior to “break out,” when the shell expands out of the disk of the galaxy as defined by the scale height. After this, the expansion enters a “snowplow” phase (McCray & Kafatos 1987). From this combined shell evolution model, they again come up with an age estimate of approximately 100 Myr.
We also tried applying this shell evolution model to DDO 88. However, there are large uncertainties in calculating or estimating several of the quantities that are used in these equations (equations 7 and 8 in Ott et al. 2001). Among these are an estimate of the scale height, which is used as the “critical radius” at which breakout occurs and the time until break out, which depends on this radius as . Other parameters used to calculate this “critical time” include the number of supernovae per Myr, , which depends on the energy required to create the shell and the average energy per supernova, the particle volume density , and the mean molecular mass . Both the critical time and the critical radius are then used to estimate the duration of the snowplow phase, with the result depending on .
Depending on the method we use, we find a scale height for DDO 88 of between 100–300 pc. For , if we assume (as Ott et al. did) ergs per supernova, and that they all go off within 40 Myr, then the number of supernova per Myr = /40. For our – ergs (corresponding to cm-3) this is 100-1000 supernovae, so –25 Myr-1. As we have used the radius of the hole (not the midpoint of the ring) to calculate , we continue to do so. Thus, for a radius of 880 pc, we find a ring age of 0.5–6.5 Gyr. If instead we use the midpoint of the ring as our ring size, we find a range of 1.4–20 Gyr. Clearly, the upper bound here is unphysical. The lower bounds are in line with the central colors in the hole that indicate no vigorous star formation in the past 0.5 Gyr. The red central cluster colors agree with an age of 1–3 Gyr, so it is old enough to have formed the hole.
Could the ring survive as long as a Gyr though? The rotation curve indicates that DDO 88 is undergoing primarily solid-body rotation, especially in the inner regions where the ring is located (approximately 30–50″). Thus the ring would not be subject to the shearing forces produced by differential rotation. But what about dispersion due to the random motions in the gas? Recall that we have an upper limit for the expansion time of the hole of about 150–200 Myr, so if the ring is more than 0.5 Gyr old, it has been stalled for over 300 Myr. The H i ring has a width of 0.8 kpc. With a dispersion velocity of 6 km s-1, it would take 270 Myr for material to travel twice the width of the ring. This is close to our lowest estimate for the time since the ring stopped expanding. Thus, it would seem that the ring should have undergone at least some dispersion, if not total, if it is much older than 0.5 Gyr. This argues for a younger age for the ring, and against the ring being as old as the red cluster.
The next question is whether the cluster could have produced the required energy. Currently, the cluster has an M. Using the lower age limit of 1 Gyr, we find, according to the Leitherer et al. models, it would have had an M at 10 Myr and a mass of M☉. This is consistent with the 2–20 M☉ of stars that we estimated would have formed in the event that made the hole, and is similar to the mass estimate for the association in NGC 206 (Brinks 1981). This places it in the realm of super star clusters, so it very well could have produced the H i hole from an energy standpoint.
5.4 Propagating Star Formation?
Star formation regions have been found at the edges of some H i shells (e.g. Brinks 1981, Walter & Brinks 1999), presumably as a result of instabilities that begin to occur in the swept-up gas from the shell formation (McCray & Kafatos 1987, Elmegreen 1994). Although there is no evidence of increased star formation activity seen from the azimuthally-averaged H profile (Figure 6), four of the five H regions are associated with the H i ring (Figure 10). Here, however, we run into an inconsistency if our ring is indeed older than 0.5 Gyr and has been stalled for over 300 Myr. The H ii region colors indicate ages of 7–10 Myr, so there would have been a considerable delay between the formation of the ring and the onset of secondary star formation. Would star formation continue to occur in the ring so long after it formed?
There is evidence that secondary star formation resulting from the formation of an H i shell can occur relatively quickly, but how long it continues is much less clear. Walter et al. (1998) observed a still-expanding supershell in IC 2574 with an age of approximately 14 Myr. There are massive H ii regions coincident with the rim of this shell, so presumably secondary star formation is occurring now. Constellation III in the LMC has an H i hole 1.4 kpc in diameter that formed about 20 Myr ago, and H ii regions with ages of approximately 5 Myr are observed in the shell (Dolphin & Hunter 1998), indicating that it took less than 15 Myr for them to form.
Looking at an older, stalled shell, we turn again to the supershell in Ho I with an age of –100 Myr (Ott et al. 2001). Inside the rim, they observe stars 15–30 Myr old, with younger regions of star formation located on the rim of the hole, so it appears that secondary star formation is occurring some 50–60 Myr after the hole began to form. However, the upper limit on the age of this shell is 90 Myr, so it has been stalled for less than 10 Myr.
Therefore, observed cases of induced star formation give timescales for secondary star formation in the shells of order 60 Myr or less. This leaves us with the problem that the one stellar remnant that we find in the hole is too old, and we cannot identify any younger entity. At this point we see no way around this inconsistency and cannot clearly point to what has formed a galaxy-sized hole in the gas of this tiny galaxy.
6 Summary
DDO 88 appears to be a fairly normal low-luminosity dwarf galaxy in the optical, with only modest on-going star formation. There is a slight asymmetry in the outer low-level V-band isophotes, but this is not unusual among Im-type galaxies. Its integrated UBVH colors put it at the red end of the distribution for Im/Sm galaxies, consistent with the current low level of star formation and suggesting that star formation has been roughly constant over the lifetime of the galaxy. Any significant star formation event would have had to occur more than 0.5 Gyr ago. The azimuthally-averaged surface photometry is well fit by an exponential disk, and there are no major color gradients detected across the disk. These features are typical of Im/Sm galaxies.
In H i, DDO 88’s outer regions and global characteristics also appear quite normal. The ratio of H i-to-optical radius is typical of Im and spiral galaxies. The azimuthally-averaged H i surface density is a bit low compared to other irregular galaxies but it drops off at an average rate.
The normal appearance of the optical and outer regions of the H i gas in DDO 88 give no hint that the center of the galaxy hosts a large (1.8 kpc diameter) H i depression. The H i surrounding the hole is distributed in a high column density ring with an outer diameter of 3.4 kpc. The hole is unusually large for a galaxy of this size, and does not appear to be expanding. If the hole was produced by the energy injection from winds and supernova explosions of massive stars formed in a starburst, the star formation event would have produced – M☉ of stars, which is 0.1–1% of the total mass of the galaxy.
There is a red star cluster near the center of the H i hole. Corrected for reddening, evolutionary models give an age of 1–3 Gyr and an initial mass of M☉. Both the age and mass are consistent with the cluster being the remnant of a star formation event old enough and energetic enough to have created the H i hole in the center of the galaxy. If this is the case, it is possible that the higher density H i ring surrounding the hole is from gas being swept up and pushed outward by the stellar winds and supernovae that accompanied the cluster formation.
Age estimates for the H i ring indicate that is it likely older than 0.5 Gyr, which might agree with the age of the red cluster, but this is uncertain as the ring is stalled. An upper limit for the time needed to form the ring is 150–200 Myr. Dispersal time for the ring from random motions in the gas is on the order of 300 Myr however, which would indicate that this large feature should have mostly disappeared by now if it is indeed older than 0.5 Gyr. Additionally, there are faint H ii regions in and on the rim of the ring that are 7–10 Myr old. If they are secondary star formation regions caused by the ring, this also points to a younger ring age. With conflicting evidence regarding how long ago the hole and resultant ring formed, we cannot state that the red central cluster is the causative agent; nor can we rule it out. We have been unable to identify any other mechanism that could be responsible for a such a dramatic feature in this small galaxy.
References
- (1)
- (2) Brinks, E. 1981, A&A, 95, L1
- (3) Broeils, A. 1992, Ph.D. thesis, Rijksuniversiteit Groningen
- (4) Burstein, D., & Heiles, C. 1984, ApJS, 54, 33
- (5) Cardelli, J. A., Clayton, G. C., & Mathis, J. S. 1989, ApJ, 345, 245
- (6) Carignan, C., & Beaulieu, S. 1989, ApJ, 347, 760
- (7) Chevalier, R. A. 1974, ApJ, 188, 501
- (8) Clark, B. G. 1980, A&A, 89, 377
- (9) de Jong, R. S. 1996, A&A, 313, 45
- (10) de Vaucouleurs, G., de Vaucouleurs, A., Corwin, H., Buta, R., Paturel, G., & Fouqué, P. 1991, Third Reference Catalogue of Bright Galaxies (New York, Springer-Verlag) (RC3)
- (11) De Young, D. S., & Heckman, T. M. 1994, ApJ, 431, 598
- (12) Dolphin, A. E., & Hunter, D. A. 1998, AJ, 116, 1275
- (13) Ehlerová, S., Palous̆, J., Theis, C., & Hensler, G. 1997, A&A, 329, L49
- (14) Elmegreen, B. 1994, ApJ, 427, 384
- (15) Hodge, P. W., & Hitchcock, J. L. 1966, PASP, 78, 79
- (16) Hunter, D. A. 1997, PASP, 109, 937
- (17) Hunter, D. A., & Elmegreen, B. G. 2004, AJ, submitted
- (18) Hunter, D. A., Elmegreen, B. G., & Baker, A. L. 1998, ApJ, 493, 595
- (19) Hunter, D. A., Elmegreen, B. G., & van Woerden, H. 2001, ApJ, 556, 773
- (20) Hunter, D. A., & Gallagher, J. S. 1985, AJ, 90, 1457
- (21) Hunter, D. A., & Gallagher, J. S. 1986, PASP, 98, 5
- (22) Hunter, D. A., Gallagher, J. S., III, Rice, W. L., & Gillett, F. C. 1989, ApJ, 336, 152
- (23) Hunter, D. A., & Hoffman, L. 1999, AJ, 117, 2789
- (24) Hunter, D. A., Hunsberger, S. D., & Roye, E. W. 2000, ApJ, 542, 137
- (25) Hunter, D. A., van Woerden, H., & Gallagher, J. S. 1999, AJ, 118, 2184
- (26) Hunter, D. A., Walker, C. E., & Wilcots, E. M. 2000, AJ, 119, 668
- (27) Kennicutt, R. C., Balick, B., & Heckman, T. 1980, PASP, 92, 134
- (28) Kennicutt, R. C., Tamblyn, P., & Congdon, C. W. 1994, ApJ, 435, 22
- (29) Knezek, P. M., Sembach, K. R., & Gallagher, J. S., III 1999, ApJ, 514, 119
- (30) Landolt, A. U. 1992, AJ, 104, 340
- (31) Larson, R. B., & Tinsley, B. M. 1978, ApJ, 219, 46
- (32) Leitherer, C., Schaerer, D., Goldader, J. D., González Delgado, R. M., Robert, C., Kune, D. F., de Mello, D. F., Devost, D., & Heckman, T. M. 1999, ApJS, 123, 3
- (33) Mac Low, M.-M., & Ferrara, A. 1999, ApJ, 513, 142
- (34) Mac Low, M.-M., & McCray, R. 1988, ApJ, 324, 776
- (35) Martin, C. L. 1998, ApJ, 506, 222
- (36) McCray, R., & Kafatos, M. 1987, ApJ, 317, 190
- (37) McGaugh, S. S. 1991, ApJ, 380, 140
- (38) Melisse, J. P. M., & Israel, F. P. 1994, A&AS, 103, 391
- (39) Meurer, G. R., Freeman, K. C., & Dopita, M. A. 1992, AJ, 103, 60
- (40) Meurer, G. R., Staveley-Smith, L, & Killeen, N. E. B. 1998, MNRAS, 300, 705
- (41) Mexiner, Young Owl, & Leach 1999, PASP, 111, 997
- (42) Ohta, K., Tomita, A., Saitō, M., Sasaki, M., & Nakai, N. 1993, PASJ, 45, L21
- (43) Oke, J. B., & Gunn, J. E. 1983, ApJ, 266, 713
- (44) Ott, J., Walter, F., Brinks, E., Van Dyk, S. D., Dirsch, B., & Klein, U. 2001, AJ, 122, 3070
- (45) Puche, D., Westpfahl, D., Brinks, E., & Roy, J.-R. 1992, AJ, 103, 1841
- (46) Rhode, K. L., Salzer, J. J., Westpfahl, D. J., & Radice, L. A. 1999, AJ, 118, 323
- (47) Rubio, M., Garay, G., Montani, J., & Thaddeus, P. 1991, ApJ, 368, 173
- (48) Salpeter, E. E. 1955, ApJ, 121, 161
- (49) Sandage, A., & Bedke, J. 1994, The Carnegie Atlas of Galaxies, Vol. II (Carnegie Institute of Washington)
- (50) Sargent, W. L. W., Sancisi, R., & Lo, K. Y. 1983, ApJ, 265, 711
- (51) Scalo J., & Chappell, D. 1999, MNRAS, 310, 1
- (52) Schneider, S., Thuan, T. X., Magri, C., & Wadiak, J. E. 1990, ApJS, 72, 245
- (53) Scoville, N. Z., & Sanders, D. B. 1987, in Interstellar Processes, ed D. J. Hollenbach and H. A. Thronson (Dordrecht: Reidel), p 21
- (54) Sedov, L. 1959, Similarity and Dimensional Methods in Mechanics (New York: Academic Press)
- (55) Simpson, C. E., & Gottesman, S. T. 2000, AJ, 120, 2975
- (56) Stewart, S. G., et al. 2000, ApJ, 529, 201
- (57) Stone, R. P. S. 1977, ApJ, 218, 767
- (58) Swaters, R. 1999, PhD thesis, Rijksuniversiteit Groningen
- (59) van den Bergh, S. 1966, AJ, 71, 219
- (60) van der Hulst, J. M., Skillman, E. D., Smith, T. R., Bothun, G. D., McGaugh, S. S., & de Blok, W. J. G. 1993, AJ, 106, 548
- (61) van Zee, L., Haynes, M. P., Salzer, J. J., & Broeils, A. H. 1997, AJ, 113, 1618
- (62) Wada, K., Spaans, M., & Kim, S. 2000, ApJ, 540, 797
- (63) Walter, F., & Brinks, E. 1999, AJ, 118, 2734
- (64) Walter, F., Kerp, J., Duric, N., Brinks, E., & Klein, U. 1998, ApJ, 502, L143
- (65) Wilcots, E. M., 2001, private communication
- (66) Wilcots, E. M., & Hunter, D. A. 2002, AJ, 123 1476
- (67) Wilcots, E. M., & Miller, B. W. 1998, AJ, 116, 2363
- (68) Young, L. M., & Lo, K. Y. 1996, ApJ, 462, 203
- (69)
| D-array | CS-array | CDaaCombined data set from both arrays | |
|---|---|---|---|
| Observation Date | 1996 Sept. 20 & 24 | 1997 Sept. 19 | |
| Time on Source (min) | 449 | 161 | |
| Bandwidth (MHz) | 1.56 | 1.56 | 1.56 |
| No. of Channels | 128 | 128 | 128 |
| Velocity Resolution (km s-1) | 2.6 | 2.6 | 2.6 |
| BeamsizebbNatural weighting for D; Uniform weighting with robust factor of for CS and CD (″) | |||
| Single channel r.m.s. (mJy/B) | 0.71 | 1.26 | 0.98 |
| HII Region | |||||
|---|---|---|---|---|---|
| QuantityaaLine ratios are not corrected for reddening. | 1 | 2 | 3 | 4 | 5 |
| RAbbRA are in hours, minutes, seconds of time. (2000) | 10:47:22.1 | 10:47:22.8 | 10:47:23.2 | 10:47:23.1 | 10:47:19.8 |
| DECccDEC are in degrees, arcminutes, arcseconds. (2000) | 14:04:26 | 14:04:06 | 14:03:50 | 14:04:36 | 14:03:59 |
| H/H | 2.970.55 | 3.270.15 | 3.000.13 | 2.960.22 | 3.350.36 |
| [OIII]5007/[OIII]4959 | 2.810.08 | 3.230.57 | 2.900.34 | 2.840.08 | |
| [OII]3727/H | 2.870.93 | ||||
| [OIII]5007/H | 1.220.06 | 0.640.04 | 0.600.03 | 1.790.08 | 0.260.10 |
| [NII]6584/H | 0.150.03 | 0.140.02 | 0.160.04 | 0.180.05 | 0.150.07 |
| [SII]67176731/H | 0.130.09 | 0.250.07 | 0.270.05 | 0.530.14 | 0.430.30 |
| E(BV)ddThis assumes an electron density of 100 cm-2, a nebular temperature of 104 K, and the Cardelli et al. (1989) reddening law. | 0.040.17 | 0.130.05 | 0.050.04 | 0.030.08 | 0.160.10 |
| Parameter | Value |
|---|---|
| D (Mpc)aaVGSR = 481 km s-1; H0 = 65 km s-1 Mpc-1. | 7.4 |
| E(BV)fbbE(BV)f is foreground reddening due to the Milky Way (Burstein & Heiles 1984). For the broad-band stellar photometry in DDO 88, we assume an additional internal reddening of 0.05 magnitude; for the H ii regions we assume an additional internal reddening 0.1 magnitude. | 0.01 |
| R25 (arcmin) | 0.83 |
| R25 (kpc) | 1.8 |
| RH (arcmin) | 1.2 |
| RH (kpc) | 2.6 |
| (V-band, magnitudes arcsec-2) | 21.970.04 |
| (kpc) | 0.700.01 |
| (kpc) | 0.780.02 |
| MB,0 (r79″) | |
| (UB)0 (r79″) | |
| (BV)0 (r79″) | 0.520.02 |
| (VH)0 (r79″) | 2.300.03 |
| log LHα,0 (ergs s-1) | 38.89 |
| SFRccStar formation rate derived from LHα using the formula of Hunter & Gallagher (1986) that integrates from 0.1 M☉ to 100 M☉ with a Salpeter (1955) stellar initial mass function. The area is R. (M☉ yr-1) | 0.0055 |
| log SFR/areaccStar formation rate derived from LHα using the formula of Hunter & Gallagher (1986) that integrates from 0.1 M☉ to 100 M☉ with a Salpeter (1955) stellar initial mass function. The area is R. (M☉ yr-1 kpc-2) | 3.26 |
| Parameter | Value |
|---|---|
| MHIaaFrom D array; D = 7.4 Mpc. | M☉ |
| RHIaaFrom D array; D = 7.4 Mpc. (arcmin) | 2.1 |
| RHIaaFrom D array; D = 7.4 Mpc. (kpc) | 4.4 |
| MHIbbFrom C+D array in the ring | M☉ |
| MHIbbFrom C+D array in the hole | M☉ |
| RholebbFrom C+D array (arcsec) | 25 |
| RholebbFrom C+D array (kpc) | 0.9 |
| Width of ringbbFrom C+D array (arcmin) | 22 |
| Width of ringbbFrom C+D array (kpc) | 0.8 |
| RringbbFrom C+D array (arcsec) | 47 |
| RringbbFrom C+D array (kpc) | 1.7 |