11email: ventura@mporzio.astro.it, m.castellani@mporzio.astro.it
Time dependent mixing in He-burning cores: the case of NGC1866
We examine the convective core helium burning phase of intermediate mass stars, and investigate the role of coupling of nuclear burning and mixing on the extension and duration of the blue loop phase. We compare the theoretical scenario with the distribution of stars in the colour-magnitude (CM) diagram of the Large Magellanic Cloud (LMC) cluster NGC1866, whose largely populated clump of He-burning stars is equally populated in the blue and red side. We compare the distributions expected by adopting either a diffusive scheme within the instability regions, in which nuclear burning and mixing are self-consistently coupled, or the traditional instantaneous mixing approximation. We analyze with particular care the sensitivity of the results to: a) the e-folding distance with which the velocity of convective eddies decays outside the formal border of the convective regions fixed by the Schwarzschild criterion; b) the convective model adopted to evaluate the temperature gradient; c) the rate of reaction . Models not including convective overshoot are also commented.
Key Words.:
Stars: evolution – Stars: interiors – Stars: Hertzprung Russell and C-M diagrams1 Introduction
The young stellar cluster NGC1866 in the Large Magellanic Cloud has been extensively studied in the last decades because it provides a unique opportunity to study the physics of the interiors of intermediate mass stars, particularly for what concerns the extension of the convective cores during the phases of both hydrogen and helium burning. It is young enough (Age Myr) to have turn-off masses of approximately , which are well known to develop extensive convective cores during their main sequence phase. At the same time the data available show an extraordinarily well populated clump region (Testa et al. 1999; Brocato et al. 2003), with He-burning stars, and allow to compare the relative duration of the permanence of He-burning stars in the red and blue parts of the CM diagram.
The observational data have been used up to now primarily to find out informations regarding the convective central regions during the phases of central burning (Becker & Mathews 1983; Brocato & Castellani 1988; Chiosi et al. 1989; Brocato et al. 1994; Barmina et al. 2002; Brocato et al. 2003), and particularly on the extension of the so-called overshooting region, i.e. the zone behind the formal border fixed by the Schwarzschild criterion in which the convective eddies are allowed to travel due to inertia despite the opposition of the buoyancy forces (Cloutman & Whitaker 1980; Xiong 1980; Canuto et al. 1996; Bressan et al. 1981).
The computations of detailed luminosity functions have provided a powerful tool to infer the relative duration of the phases of helium and hydrogen burning, which is directly correlated to the extension of the convective core during the MS phase, and the amount of extra-mixing which must be taken into account. Unfortunately, at the moment no common agreement has yet been reached, and the photometric study of NGC1866 has been presented by different groups either as a clue of a considerable amount of extra-mixing beyond the border of the instability regions (Barmina et al. 2002), or as a clear evidence that such a region is so narrow that overshooting can be completely neglected in the evolutionary calculations (Testa et al. 1999; Brocato et al. 2003). To understand the level of uncertainty, suffice it to say that the differences in the ages of the cluster quoted in the literature amount to , ranging from Myr up to Myr.
The idea behind this paper is not to provide another estimate of the age of the cluster through a comparison either between the theoretical isochrones and the observed CM diagram or between the luminosity functions; rather, we focus our attention on the observed distribution of He burning stars in the CM diagram, in an attempt to reproduce the observed ratio between blue and red clump stars (). We also discuss and compare the results obtained by varying the micro and macro-physics inputs adopted to calculate the evolutionary sequences.
Our main goal is to check the sensitivity of the global duration of the helium burning phase and of the time spent in the blue region of the CM diagram on the way nuclear burning and mixing of chemicals are coupled in the central convective regions during the two major phases of nuclear burning. We compare the results obtained by assuming a diffusive approach, in which the two processes are self-consistently coupled, with the instantaneous mixing approximation, still largely adopted in most of evolutionary codes.
We use the observed distribution of clump stars in NGC1866 as a test of the diffusive scheme for the masses involved; we postpone to a forthcoming paper a more general discussion concerning a more extended mass range.
We complete our study by testing the sensitivity of the results also on the convective model adopted, our code allowing to calculate the temperature gradient within convectively unstable regions through the FST or the MLT models (see Sect.2.1), the rate of the reaction and the e-folding distance of the convective velocity from the formal border of the convective core, fixed by the Schwarzschild criterion.
A general description of the code ATON used to compute the evolutionary sequences is given in Sect.2. In Sect.3 we describe the main evolutionary phases of the typical intermediate mass star which is likely to populate the clump of NGC1866. A comparison between the results obtained by varying the scheme for mixing is presented in Sect.4. Sects.5 to 7 are focused on the effects of changing, respectively, the e-folding distance of convective velocities decay within radiatively stable regions, the convective model, and the cross-section of the reaction .
2 The evolutionary models
The stellar models calculated in this paper have been obtained by using the ATON2.0 code described by Ventura et al. (1998). The interested reader may find on the afore mentioned paper a detailed description of the numerical structure of the code, and of the macro and micro-physics which is used to simulate the stellar evolutions. Here we briefly recall the most important inputs adopted.
2.1 The treatment of convection
The calculation of the temperature gradient in stellar regions unstable to convection has been traditionally performed by adopting the Mixing Length Theory (MLT) (Vitense 1953; Böhm-Vitense 1958), which is based on the simplified assumption that the convective flux is carried by eddies which first form and travel for an assumed distance (the mixing length), then lose their identity, transferring to the surrounding layers their energy content. Both the dimension of the afore mentioned eddies and the mixing length are assumed to be directly proportional to the distance of exponential decay of pressure (), with a constant of proportionality which is commonly calculated in order to reproduce the evolution of the Sun, i.e. to fit the solar radius and luminosity at the present age of the Sun: we find .
Alternatively, still in the framework of local convective models, in the last decade a new prescription was presented: the Full Spectrum of Turbulence (FST) model (Canuto & Mazzitelli 1991; Canuto et al. 1996). The main differences with respect to MLT are that all the spectrum of eddies’ dimensions is taken into account, and the mixing length is assumed to be simply the distance to the closest convective border (). This latter model provides convective fluxes which are approximately times larger than the MLT ones in regions of high convective efficiency, and sensibly lower in stellar zones where the efficiency of convection is very poor, i.e. in proximity of the formal border or in the sub atmospheric layers.
The code ATON2.0 can be easily managed in order to use either of the convective models.
2.2 Nuclear network
With respect to Ventura et al. (1998) the nuclear network has been extended and now includes 30 chemicals:,,,,, ,,,,,,, ,,,,, ,,,,,, ,,,,,,.
All the main reactions of the proton-proton chain, CNO, Ne-Na and Mg-Al cycles, and of He burning have been considered, for a total of 64 reactions. The relevant cross-sections are taken either by Caughlan & Fowler (1988) or by Angulo et al (1999).
2.3 Convective mixing and nuclear burning
The extension and the borders of all the convective regions are established by the Schwartzschild criterion.
The treatment of nuclear burning within convective regions is based traditionally on the instantaneous mixing approximation: it is assumed that convection is so fast in mixing the chemical species within the whole instability region that this latter can be assumed to be always homogenized. From a numerical point of view this latter assumption provides a great simplification, because it is possible to calculate average chemical abundances and nuclear cross-sections, which are used for all the mesh points included in the convective region.
Alternatively, it is necessary to solve for each element the diffusion equation (Cloutman & Eoll 1976):
| (1) |
stating mass conservation of element . The diffusion coefficient is
| (2) |
The turbulent diffusion time scale, , is related to the correlation between density and velocity according to:
| (3) |
The knowledge of the second order momentum in eq.(3) requires the solution of the Navier-Stokes equations, which is not available. Thus, it is customary to rely on a local approximation for D, that is
| (4) |
where is the convective velocity and is the convective scale length.
Careful details of the way of solving eq. (1) can be found in Ventura et al. (1998) (see, in particular, the Appendix and Sect. 2.3).
A diffusive approach was used by Deng et al.(1996a;b) and Salasnich et al.(1999) to study the evolution of massive stars of solar and LMC metallicity during their phases of hydrogen and helium burning.
The two schemes to treat nuclear burning within convective regions need also two different approaches to deal with overshooting. In the instantaneous mixing approximation it is simply assumed, for the purpose of mixing, that the convective eddies travel up to a distance which is some fractions of away from the formal convective border. The numerical treatment is unchanged, the only difference being the larger extension of the fully homogenized region.
We thus have . According to Maeder & Meynet (1991), a value of is needed to fit the main sequences of young clusters; for older clusters the observed data are hardly fit with values of exceeding 0.2 (Stothers & Chin 1992).
Within the diffusive framework it is necessary to specify the way with which convective velocities decay outside the convective boundaries (Deng at al. 1996a,b; Herwig et al. 1997; Ventura et al. 1998). In agreement with Xiong (1985), Grossman (1996) and on the basis of numerical simulations by Freytag et al. (1996), we assume that convective velocities decay exponentially out of the formal convective boundary as:
| (5) |
where and are, respectively, turbulent velocity and pressure at the convective boundary, P is the local pressure, a free parameter connected with the e-folding distance of the decay, and is the thickness of the convective regions in fractions of . The chemical abundances are still calculated by eq.(1), which is applied in a slightly more extended region with respect to the borders fixed by the Schwarzschild criterion.
and are the two parameters connected with the extra-mixing in both schemes, though their physical meaning is completely different. In terms of duration of the main sequence phase for intermediate mass stars, we may say that leads to results similar to , and to .
2.4 Chemical composition
We calculated several sets of stellar tracks by varying the scheme adopted for chemical mixing (instantaneous or diffusive), the convective model (FST and MLT), the parameter for the exponential decay of velocities ( and ) and the rate of the reaction . Both for the instantaneous and the diffusive case a set of evolutionary sequences where the extension of the mixed region is tightly fixed according to the Schwarzschild criterion was calculated. The adopted chemical composition for all the tracks discussed here is and (Brocato et al. 2003; Barmina et al. 2002).
3 Some evolutionary remarks
For all the sets of tracks considered we calculated theoretical isochrones for ages in the range Myr following the scheme suggested by Pols et al.(1998). The conversions from the theoretical to the observational plane have been performed by means of the transformations by Castelli et al.(1997). We first tried to select for each set of tracks the most appropriate parameters (age, distance modulus, reddening) allowing a decent fit of the observed CM diagram. First, we checked the possibility of discriminating between the two schemes for mixing, looking for differences in the quality of fitting obtained with both prescriptions.
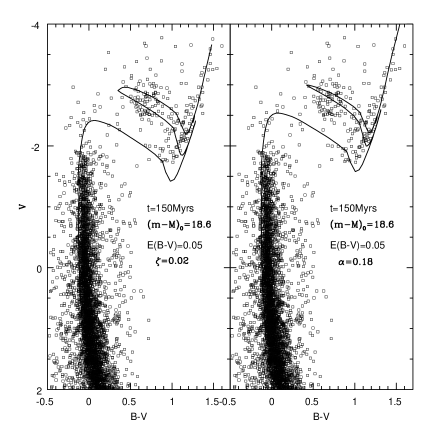
Fig. 1 shows the comparison between the observed CM diagram (Testa et al. 1999) with the theoretical isochrones obtained by assuming a diffusive scheme for mixing with (diff02 models), or an instantaneous prescription with an overshooting distance of (ist18 models). The convective model adopted is FST, and the nuclear network is from Caughlan & Fowler (1988).
In both cases we see that a decent fit of both the extension of the main sequence and the luminosity and extension of the clump is obtained with an age of 150Myr, a distance modulus of and a reddening .

This preliminary approach seems to rule out the possibility of selecting different mixing modalities simply on the basis of CM fitting. A deeper analysis is needed. Before entering into the details of this comparison, we briefly examine the physical properties of the stars which are supposed to populate both the turn-off and the clump region within the context of our simulations. This will help us to better understand the results we obtain.
The typical mass belonging to the clump of fig. 1 is . The track on the HR diagram is shown in fig. 2; the bottom panel shows in more details the clump region. In the early phases of hydrogen-burning the star develops a central convective region of with a radial extension of . As CNO burning proceeds, the central regions contract and heat, the convective core shrinks in mass (it drops to when the abundance of hydrogen is 0.25 in the centre) while its radius decreases slowly. Consequently, the pressure scale height at the border of the central convective region diminishes, and the extension of the extra-mixing region, directly connected to , is also reduced. The whole phase of H-burning lasts Myr, after which the star expands. Due to the lower and lower effective temperatures convection penetrates deeply towards internal regions which were previously touched by nuclear burning, in what is commonly known as the first dredge-up. The base of the external envelope reaches a layer which is in mass away from the centre, while the stellar luminosity, due essentially to CNO burning in a shell, rises up to , until reactions start in the centre of the star (point A in the bottom panel of fig. 2). At the ignition of helium in the centre the energy release is in excess with respect to the rate of energy which can be carried outwards. This triggers a rapid expansion of the central core, which has the effect of diminishing the strength of the CNO shell burning, so that the luminosity decreases. The stellar layers from the shell to the surface contract, convection recedes, the track moves downwards in the HR diagram until the CNO shell, after yrs since the beginning of helium burning, meets the chemical discontinuity left behind by the first dredge-up (point B). This determines a rapid increase of the CNO (and global) luminosity, so that the star continues to burn helium in the red part of the HR diagram until surface convection disappears (point C). Then a readjustment of the structure causes a rapid contraction, and the tracks moves to the blue part of the diagram until the CNO shell evolves through the discontinuity (point D). The star remains in the blue part of the clump region until the helium abundance in the central regions drops to , after which the rate of nuclear energy release drops and the core starts contracting; the layers from the CNO shell to the surface expand, and the tracks moves to the red. In the diff02 model the track stays in the bluest region of the clump for Myr. The whole phase of helium burning lasts approximately Myr.
Fig. 3 shows the variation with time of the coefficient of generation of nuclear energy (top panel) and the hydrogen profile (bottom) at some stages intermediate between points B and D of fig. 2. We note a rapid decrease of the energy release until the outer part of the shell reaches the chemical discontinuity (evidentiated by the sudden increase of the hydrogen abundance at ) (point B); point D corresponds to the phase when the peak of the shell reaches the quoted discontinuity.

We stress here the different behavior of the convective central regions of the star with respect to the preceding phases of hydrogen burning. During H-burning, the extension in mass of the core tends to increase as nuclear burning proceeds. The second important difference is that the ignition of reactions provokes a rapid expansion of the central regions, so that while the temperature increases, pressure and density decrease: this has the effect of increasing the value of at the border of this region, with the consequence that more material external to the formal convective region is carried inwards.
This picture outlines which are the main factors driving the evolution of the star during the He-burning phase:
-
•
The excursion of the track to the blue is connected to the disappearance of the convective envelope.
-
•
The bluest point of the track is reached when the whole CNO shell has evolved through the chemical discontinuity left behind by the first dredge-up: we may thus expect that the extension and the morphology of the blue loop depend on the mass coordinate of the innermost point reached by external convection during the dredge-up and on the chemical stratification left.
-
•
The return of the track to the red is connected with the contraction of the internal region just before helium exhaustion. The duration of the permanence of the star in the blue is therefore directly dependent on the amount of helium still present in the core when the star reaches the bluest point of the loop. The way with which central regions are refurbished of helium are expected to play a fundamental role in determining the time spent in the blue.
4 Instantaneous vs. diffusive mixing
Fig. 1 shows that a decent fit of the HR diagram can be easily obtained both with an instantaneous and a diffusive approach to deal with burning of chemicals in the regions unstable to convection, because no clear difference can be seen in the theoretical isochrones built with the diff02 and ist18 models.
To be able to distinguish between the results of the two schemes we have to build a synthetic CM diagram, and to compare it with the observed CM diagram by Testa et al. (1999). Our main goal is to reproduce the distribution of stars in the clump, i.e. to obtain the observed ratio of between the blue and the red stars of this region.
To build the synthetics, we developed a simple algorithm which populates a given isochrone with a random distribution of masses, chosen to be available for the isochrone of that given age. For each extracted mass, values of LogL and LogTe, as well as magnitudes and colours in the observational planes, were obtained by means of linear interpolation from the points of the same isochrone. This simple way of populating an isochrone gives us important indications regarding the relative populations of the various evolutive phases, allowing us to derive the expected B/R ratio for each of our tests.
This ratio was calculated by counting the number of stars within appropriate boxes in the CM diagram chosen on the basis of the observational distribution of He-burning stars in NGC1866. Specifically, we retained as blue stars those whose and fall within the range, respectively, of and ; we considered as red stars, those with and . We deliberately chose not overlapping boxes in order to prevent small fluctuations in colour to substantially affect our statistics.
Statistical fluctuations related to the random distribution of star masses are taken in account in the following way: for each choice of parameters, we performed ten simulations varying only the seeds for random number generation: after that, the computation of B/R ratio is made on the averaged numbers of blue and red, according to the definition given above.
Note that we did not include the age spread in the following simulations. However, preliminary computations show that a reasonable age spread ( of the age of the cluster) cannot alter significantly the derived B/R ratio (in agreement with Barmina et al. 2002, see their Fig.15).
Fig. 4 shows the numerical simulations obtained for the two sets of models: we can see that in the diff02 case the blue part is much more populated, with a ratio , to be compared to the value corresponding to the ist18 models. This can be clearly seen in the corresponding histogram shown in the lower part of fig. 4. Such a steep dependence of the time spent in the blue and red side of the CM diagram of He-burning intermediate mass stars on the treatment of mixing within the convective core was already discussed in D’Antona (2002).

To understand the reason of this difference we compared carefully the evolutions of a model of the diff02 set with a ist18 model of , which are the typical masses staying in the clump at the age of Myr for the two sets of model discussed. The two tracks are very similar during the MS evolution (see fig. 5), and have approximately the same luminosity during the helium burning phase. The duration of the H-burning phase is the same (Myr) for both models.


A detailed comparison between the two evolutions can be seen in the three panels of fig. 6. In the abscissa we report the time starting from the beginning of hydrogen exhaustion in the centre; to have an idea of the extension of the loop and the duration of the blue phase, we show in the lower panel the variation of the effective temperature. We find in both cases a rapid increase of with time in conjunction with the disappearance of surface convection. The diffusive track stays in the blue longer (Myr), while the ist18 track, as soon as it reaches the bluest point, moves again to the red (Myr).
The reason of such a different behavior can be detected in the first and second panel of the same figure. In the upper panel we see that in the ist18 model helium is burnt faster, so that when the bluest point is reached the central helium abundance has dropped to ; with these low helium abundances the two nuclear reactions involved ( and ) cannot supply the whole energy demand, so that the contraction of the core, triggering the expansion of the external layers and the return of the track to the red, starts soon. In the diffusive model the helium burning is slower, so that at the bluest point there is still of helium in the core, thus delaying the beginning of core contraction. This allows the track to stay in the blue region for longer, and the relative duration of this phase is approximately doubled.
The results are in full agreement with the detailed comparison of the H and He-burning times obtained with the two schemes for mixing for the most massive intermediate mass stars presented in Salasnich et al.(1999) (see their fig.5).
These results indicate that the two schemes for mixing can lead to deeply different results, particularly in terms of the relative duration of the various evolutionary phases. The diffusive scheme allows an exponential decay of velocities beyond the border of convection, with the consequence that the zone which is mixed is larger: yet, we must consider that the time-scales for mixing in the most external layers are extremely large, so that the refurbishment of fresh helium into the hottest central layers is slow. On the contrary, in the instantaneous case a smaller region is involved in mixing, but the efficiency of convection in this latter case is assumed to be so high to homogenize it completely: the process of carrying helium to the centre is thus more efficient, the rates of both and reactions are increased, and the whole process of helium burning is faster.
It is not surprising that the differences between the results obtained with the two schemes for mixing are more evident during the He-burning phase, since in this case the size of the convective core tends to increase; during the H-burning phase the shrinking of the convective core, precedently discussed, makes the size of the extra-mixing regions to be progressively decreased, so that the differences between the two treatments are smaller.
The comparison between the results obtained with different schemes for mixing leads to the conclusion that intermediate mass models computed with the diffusive approach, provided the luminosity of turn-off and of the clump are the same, consume helium more slowly than the corresponding models computed with the instantaneous mixing approximation, with a consequent longer duration of the blue phase.
Applied to the study of NGC1866, the usage of the diffusive approach allows to shorten the gap between theory and observations, rising the predicted ratio to (to be compared to the expected value on the basis of the ist18 models).
4.1 The no extra-mixing case
The same analysis to test the influence of the time-dependent algorithm for mixing was applied to two sets of tracks calculated by assuming that no sort of extra-mixing takes place out of the border fixed by the Schwarzschild criterion (diff00 and ist00 models).

Fig. 7 shows the tracks followed in the HR diagram by models with masses in the range 3.5 - 5, calculated with the instantaneous mixing approximation. We note that the bluest point of the track gets hotter as the stellar mass increases, but for models more massive than the track substantially stays in the red during the whole He-burning phase; this behavior is found for all models less massive than . These results are in full agreement with the most recent findings concerning the evolution of intermediate mass stars of this metallicity by Pietrinferni et al. (2004).
This can be explained on the basis of the fact that in the more massive models helium consumption if faster (due to the higher temperatures) and convection is always well extended: when the abundance of helium drops to , and the core contraction begins, the surface convection is still alive, so that the star never begins the rapid excursion to the blue which is typical of models with radiative envelopes. Therefore, we find no blue clump stars for ages Myr.
Disregarding the presence or not of the blue loop, on the basis of the clump luminosity we obtain an age for NGC1866 of Myr with a distance modulus of , in agreement with Testa et al. (1999); for a lower distance modulus () we obtain a decent fit of the clump luminosity for an age of Myr (in agreement with Brocato et al. 2003).
The lack of stars burning helium in the blue seems to rule out ages Myr, and in any case does not allow us to perform the usual analysis based on the ratio. For an age Myr we cannot fully reproduce the extension of the clump both in temperature and luminosity; in any case, the percentage of blue stars compared to the red would be low () compared to the observed value of . This can be understood on the basis of the helium still present within the core when surface convection is extinguished. The lack of any extra-mixing out of the formal convective border triggers a rapid consumption of helium in the central region, so that when the excursion towards the blue begins the abundance of helium dropped to : soon after the contraction of the central layers forces a quick return of the track to the red.
It’s interesting to note that the B/R ratio expected on the basis of the instantaneous models calculated with no extra-mixing is the same as in the ist18 models, precedently discussed. Therefore, within the framework of instantaneous models, it is not possible to derive informations concerning the extension of the overshooting region on the basis of this kind of analysis only.
If we compare the results obtained with the two schemes for mixing (diff00 and ist00 models), we note that in these models calculated by assuming a complete absence of extra-mixing no meaningful differences have been found, both in the main sequence and in the helium burning phase. This can be explained on the basis of the fact that the time scale of convection is very short with respect to those typical of the various reactions involved within the formally unstable region. For example, within the ist00 model, which would populate the clump of NGC1866 if no extra-mixing is considered, the time-scale of convection is always shorter than month for the whole duration of the He-burning phase.
5 The role of
The discussions of the previous sections outlined the difference between the roles of the parameters and in determining the amount of matter which is mixed and carried to the central regions during the major phases of central burning.
is connected with the e-folding distance of the velocity decay from the border of the convective zone, but even in case of very large values of material far from the border is hardly mixed to the centre, because the time-scale for mixing in that region would be comparable or even longer than the evolutive times. Hence, we expect that even large percentage variations of don’t have dramatic consequences on the evolution of the star, unlike the effect of great changes of .

A preliminary study regarding the effects of varying the e-folding distance of the exponential decay of velocities outside the border of the convective core is found in Salasnich et al.(1999), but it is mainly focused on the evolution of massive stars (). A straight detailed comparison between our parameter and their quantity is made difficult by the different way of simulating the exponential decay: we use pressure as independent variable, while they use the radius.
We increased the value of up to 0.03, obtaining a nice fit of the CM diagram of NGC1866 with the same parameters holding for , but with a slightly larger age (Myr). In this latter case the mass evolving in the clump is . The numerical simulations run for this set of tracks show (see fig. 8) that the percentage of blue stars is increased up to , which is still lower than the observed value, but pointing in the right direction.


The increase of the time spent in the blue for larger values of can be understood again if we consider the fast consumption of helium within the central regions, and the quantity of helium still left when the track reaches the bluest point of the clump.
To understand the differences between the and sets we compare two models of masses (case ) and (). Such a choice stems from the small difference found between the masses populating the clump region in the best simulations obtained with the two sets of models.
In fig. 9 we compare the tracks on the HR diagram; we note that both the luminosity of the turn-off and of the bluest point of the clump are almost the same. In the 6 panels of fig. 10 we show in details the differences in terms of various chemical and physical quantities during the He-burning phase.
In the left panels we report the evolution with time of the CNO burning shell in terms of the mass coordinate of the layer corresponding to the maximum release of CNO nuclear output (left - upper panel) and of the maximum value of the coefficient for the generation of CNO nuclear energy (left - middle panel). The right panels shows the evolution of the central physical-chemical conditions, in terms of density, temperature, and helium abundance.
In the model the H-exhausted region is larger, and the CNO shell is more external (in mass); the difference is of the order of . The CNO burning shell in the model, before the ignition of process, is consequently hotter and more efficient, so that the energy release is larger, as we can see in the left - middle panel. The faster drop of CNO energy release which can be seen in the model, is related to the conditions in the core. The right-middle panel of fig. 10 evidentiates that the central regions of the model are slightly hotter, so that helium is consumed faster (right-lower panel); this, in turn, triggers a more rapid expansion of the central regions, which can be detected in the steeper drop of central density in the right-upper panel, and a more rapid decrease of the nuclear energetic output due to CNO burning shell (see the left-middle panel).
The evolution of the model, for what concerns the conditions of the external layers of the structure, is faster, so that the overall contraction leading the track to the blue in the HR diagram is anticipated by Myr with respect to the case.
The same difference in the velocity of the evolution is not found in the central regions, because the larger temperatures within the interior of the model (which would lead to a more efficient nuclear burning and thus to a faster helium consumption) are partly balanced by the larger value of , which allows to refurnish the core with more helium from the regions away from the formal border of the convective core to be transported in the hot central regions. The earlier excursion to the blue of the track is not followed by a quicker return to the red (see the left - lower panel of fig. 10) so the percentage of time spent in the blue increases (, to be compared to for ).
We also note that the bluest point of the model nicely fits the location on the HR diagram of the bluest Cepheid EV Sct found in the open cluster NGC 6664 (Schmidt 1984).
These results, together with the conclusions drawn at the end of the previous section, show that the diffusive model with leads to a better agreement between the theoretical framework and the observational scenario. Thus, we decided to adopt this set of models to perform the further analysis to test the influence of the convective model and of the relevant reaction rates.
6 Can the CM diagram of NGC1866 help in discriminating between convective models?
The determination of the temperature gradient (or, equivalently, of ) within convective regions is one of the most disputed issues in modern stellar astrophysics (Ulrich 1976; Grossman 1996; Grossman & Narayan 1993; Xiong et al. 1997; Canuto 1997; Canuto & Dubovikov 1998).
These difficulties stem from the absence of an adequate solution of the Navier – Stokes equations, so that the physical description of the instability regions still rely on local approximations, in which is calculated on the basis of the values which some physical quantities assume in the same point where we want to know .
This approximation neglects one of the most important features of turbulence, i.e. non locality, but still it is the only opportunity allowing the evaluation of .
Canuto & Mazzitelli (1991) constructed a local model for turbulent convection (FST model) which has been successfully employed in several astrophysical studies, like helioseismology (Basu & Antia 1994), red giant evolution (Stothers & Chin 1995; 1997), AGB evolution of intermediate mass stars (D’Antona & Mazzitelli 1996; Mazzitelli et al. 1999). Within this context we test the possibility of selecting between the two local convective models currently available, i.e. the Mixing Lenght Theory (MLT) and the FST model, on the basis of the comparison between the theoretical predictions and the observed distribution of NGC1866 stars in the CM diagram.
We therefore calculated a set of MLT models with a diffusive scheme for mixing; the parameter for the exponential decay of convective velocities was set to , on the basis of the discussion presented in the previous section.

In fig. 11 we compare the isochrone giving the best fit with the FST models with the corresponding isochrone built by using the MLT models. The two lines are almost perfectly superimposed during H-burning, while we note a different slope of the giant branch, the MLT line becoming progressively cooler for lower effective temperatures. The luminosity and the extension of the clump are very similar.
The numerical simulations (not shown here) show no meaningful differences in the distribution of stars in the clump, particularly in terms of the ratio; the only difference between the two sets of models is in the colour of the giant branch, which is redder in the MLT models. The sensitivity of the colors of giants to the convective model adopted has been explored by Stothers & Chin (1997) (see also the discussion in Asida 2000), who found that a further tuning of the mixing length parameter with mass and effective temperature is needed to fit the observed slopes of red giant branches. We recall that in the present MLT computations the solar calibrated mixing length parameter was used for all the evolutions.
On the theoretical point of view these results are indeed not surprising, if we consider the physical contexts where we expect the convective model used to have an impact on the results obtained, in terms of temperature stratifications. Actually, inside convective regions where the efficiency of convection is very large (i.e. almost all the energy flux is carried by convection), the gradient sticks to the adiabatic value, and this is almost independent of the description of convection adopted.
In the case of NGC1866, if we consider the evolution of the masses currently in the clump according to our simulations (i.e. ), we can select three different cases where the star develops wide convective regions:
-
•
The convective core during H-burning.
-
•
The convective central region which is formed along with the ignition of processes.
-
•
The convective envelope which forms following the expansion of the external layers after hydrogen exhaustion.
In the first case (core H-burning), the overadiabaticity is on the average within the whole convective core in both models; the only difference can be noticed just in the very proximities of the border, where the FST is seen to rise up to , while in the MLT case we find . This different behavior can be understood on the basis of the different mixing scales adopted in the two cases (Canuto & Mazzitelli 1991). In the FST model the choice , the distance from the border, leads to a lower convective efficiency, while the MLT, adopting a typical scale proportional to , simulates a much larger efficiency of convection in these regions. Even taking into account these differences, we still have a very small degree of overadiabaticity in a region where the pressure drop is approximately 2 dex ( in the centre, and at the border), so that in both cases the temperature gradient sticks to the adiabatic value. This can explain the similarity of the two isochrones in the MS region of the cluster.
In the second case (core He-burning) we expect the differences between the results provided by the two prescriptions for convection to be even less than during H-burning, because of the larger densities in the He-burning core, leading to a larger efficiency of convection. Indeed, we find in this case that along the whole convective core , with a maximum value of attained by the FST model in the regions next to the border. We may conclude that even during He-burning the temperature stratifications are very close, so that the differences in terms of duration of the whole He-burning phase are completely negligible.
The third point quoted above (convective envelope) deserves particular attention, because the outermost layers of the star, being cooler and less dense than the interiors, present values of which largely deviates from the adiabatic values.
Within the convective envelope of the two models precedently discussed we note a mean value of overadiabaticity which is in the FST case, and in the MLT model: this difference is due to the larger efficiency of convection of the FST model, which leads to larger convective fluxes for a given value of overadiabaticity (Canuto & Mazzitelli 1991). These values are considerable higher than those found within the central cores; this, together with the severe drop of pressure from the base of the external zone up to the surface ( dex) makes the differences in terms of temperature stratification more evident.
In the very proximities of the surface the FST model has an overadiabaticity peak which is higher and narrower than the MLT one: this is again due to the MLT choice of the scale of mixing, which acts to simulate a convective efficiency which keeps sufficiently large even in regions where in reality a very low percentage of energy is carried by convection. Yet, these differences involve only the outermost layers, therefore do not have any incidence on the results obtained.
We may conclude that in the MLT case the slope of the temperature drop from the base of convection to the surface is higher, so that the effective temperature is lower; this becomes more evident for deeper convective envelopes, so we may understand the different slope of the giant branches which can be seen in fig. 11.
On making the comparison with the observed CM diagram of NGC1866, we don’t find any appreciable difference in terms of the ratio, for two main reasons:
-
•
During the evolution in the blue the only convective zone within the star is the He-burning core, for which we already stressed that the gradient is almost adiabatic: the evolution of the star in terms of evolutive time and colour is therefore independent of the convective model.
-
•
In the red region of the clump, we saw that the convective model directly influences the values of , but not of the thermodynamical quantities of the CNO burning shell; the time spent in the red is therefore not influenced by the convective model.
This comparison between the observational scenario and the theoretical predictions for two convective models can only confirm the problems of fitting the colours of giants connected with the MLT model, but, since the influence upon the B/R ratio is very poor, it is not possible within this context to discriminate between convective models.
7 The reaction .
The evolution of a star in the early phases of He-burning is dominated by the reactions, but as helium is consumed in the central regions the reaction becomes more and more important, eventually determining the duration of the last phases of helium burning and the residual chemical abundances left in the central regions of the star after helium exhaustion.


The cross-section is uncertain by at least a factor 2, so we want to check the sensitivity of the expected distribution of He-burning stars in the CM diagram which may be due to changes in the adopted relationship .
The influence of the quoted reaction on the times spent by intermediate mass stars in the helium burning phase, and particularly on the blue region of the clump, has been explored by Imbriani et al.(2001), who compared the results obtained by adopted either the Caughlan & Fowler (1988, hereinafter CF88) or the Caughlan et al. (1985) rates, this latter release providing approximately rates larger by a factor of 2. Their main findings, essentially, were that the tracks in the HR diagram are not dramatically altered by the choice of , while the relative duration of the blue phase during helium burning is increased by . This result would thus increase the percentage of blue stars in the clump region, helping to reconciliate the observational scenario for NGC1866 with theoretical predictions.

Here we want to compare the results obtained by adopting the CF88, the NACRE (Angulo et al. 1999) and the Kunz et al. (2002) rates for the quoted reaction. We therefore calculated the same stellar models giving the best fit of the observational scenario (i.e. diffusive models with ) with the NACRE relationship, which provides values larger by a factor of over the whole range of temperatures of interest here (Angulo et al. 1999), and with the Kunz et al. (2002) prescription, which provides cross-sections sligtly lower than NACRE, and more sensitive to temperature changes in the range , which are those of interest here (see fig. 12).
Fig. 13 shows the comparison between three tracks of a model of mass , the typical mass populating the clump region (see Sect.5), calculated with the three different reaction rates. We focus only on the clump region, since no differences are found during the precedent phases. We see that the morphology and the extension of the loops are very similar, with the only difference that the NACRE model is slightly more luminous in the upper part, which corresponds to the phase of expansion of the star as the central helium abundance falls below .
To understand which results we might expect in terms of the relative duration of the blue phase, hence of the ratio, we compare in the panels of fig. 14 the main physical and chemical properties of the three models. In the left-bottom panel we report the variation with time of the effective temperature: we see that the drop of , indicating the return of the track towards the red, is postponed in the NACRE model, so that the blue phase lasts Myr, to be compared to the Myr duration of the corresponding phase in the CF88 model, and to the Myr of the Kunz model. The ratio between the times spent in the blue and the red region of the diagram is consequently increase to ( in the Kunz model).

The longer duration of the blue phase is also confirmed by the three panels on the right, which show that the drop of CNO luminosity which is due to the general expansion of the structure, the phase of the rapid increase of the central density following helium exhaustion, and the increase of the central temperature are all slightly delayed in the NACRE model. The upper and middle panels on the left show the evolution of the chemical abundances of helium and carbon in the centre of the star. We note that the rate with which helium is consumed is higher in the CF88 model, while the carbon residual, as expected is larger. The Kunz models has an intermediate behavior.
To understand the reason of these differences, we focused our attention on the physical conditions of the central regions, particularly for what concerns the thermodynamical properties and the contribution of the two main reactions to the global nuclear energy release.
First, we report in the two panels of fig. 15 the variation of central temperature and density in the very early phases of the He-burning phase (note the scale on the abscissa) as a function of the central abundance of helium. For clarity reasons, we limited our analysis to the NACRE and CF88 models, the Kunz model showing a behavior very similar to the NACRE. In both models we note a rapid increase of temperature followed by a temporary drop, which corresponds to a re-adjustment of the central regions following the rapid formation of a convective core of approximately . The larger values of the NACRE make the same demand for energy to be satisfied more easily, so that the temperature for a given helium abundance is slightly larger in the CF88 model: the differences in temperature in these early phases are very small, because the contribution of the quoted reaction to the global energy release is very poor, but they will increase as helium burning proceeds. The lower panel shows that no meaningfull differences are found in terms of density. On the basis of this, we expect a larger energy flux from reactions in the CF88 model for a fixed helium abundance.
In the upper panel of fig. 16 we show the variation with central temperature of the coefficient for nuclear energy generation , together with the separate contributions from the and the reactions; the lower panels shows the evolution of the chemical abundances of helium and carbon. To identify correctly the various phases, we marked with vertical lines the beginning of the excursion to the blue (which starts in both models when ), the bluest point (), and the return to the red, pointing the end of the blue phase (). We note that the values of corresponding to the main evolutive stages are approximately the same for both models; therefore, it is the temporal variation of which determines the relative duration of the various phases, and the differences between the two models which we examine here.
We see (fig. 16) that in both models reaches a maximum when , after which the helium depletion dominates on the temperature increase (we recall that ). We note a larger rate in the CF88 model which can be understood according to the results shown in the upper panel of fig. 15: the CF88 model needs larger temperatures for a given helium abundance or, equivalently, as we may also see in the bottom panel of fig. 16, the same temperature corresponds to larger helium abundances, thus to larger rates. The abundance of carbon, as expected, is seen in the lower panel to increase faster in the CF88 model, since less carbon is burnt via the reaction: yet, the energy release due to this latter reaction is larger (see the upper panel) in the NACRE model, because of the larger cross-section provided by the NACRE release. In both models the energy contribution due to burning is seen to increase for the whole duration of the He-burning phase, the temperature increase more than counterbalancing helium depletion (the dependence of on is weaker with respect to reactions, being ); when , the energy release due to reaction exceeds the contribution provided by reactions.
The comparison between the global energy release (see the upper panel of fig. 16) shows that for the same central temperature the CF88 model attains more nuclear energy by the two major reactions involving particles; this determines a more rapid increase of the central temperatures, speeding-up the whole evolution. This means that the same central temperature is attained in the NACRE model somewhat later, so that the permanence in the blue region, which is terminated for both models when , is slightly longer.
8 Conclusions
In this paper we present a detailed study of the helium burning phase within intermediate mass stars, and we apply our results to the LMC cluster NGC1866: we selected this cluster because it shows up a well populated clump region, allowing a statistically significant determination of the colour distribution of stars in the clump. The observational scenario indicates that the blue region of the clump is as much populated as the red, with an observed ratio which is approximately 1.
We tested the influence on the results obtained in terms of expected ratio of some macro and micro-physics inputs adopted to calculate the models, namely: the scheme adopted for mixing within nuclear burning regions, the e-folding decay distance of convective velocities out of the formal border fixed by the Schwarzschild criterion, the description of convection, and the rate of the reaction .
Our main findings are the followings:
-
1.
The way nuclear burning is coupled to convective mixing within the central regions during the major phases of nuclear burning has a strong influence on the results obtained, particularly in terms of the relative duration of the various evolutive phases. The models calculated with an instantaneous mixing approximation burn helium very rapidly, so that the permanence in the blue region following the overall contraction is shortened by the subsequent contraction of the nucleus, due to the lack of fuel; on the contrary, in the diffusive models helium burning is slower, so that a longer staying in the blue region of the clump is allowed, in better agreement with the observational scenario.
The differences in terms of the relative duration of the blue phase amount approximately to a factor of . Thus, our study of NGC1866 suggests that, during core He burning, mixing in a region of overshooting beyond the convective core boundary established by the Schwarzschild criterion should not be treated as instantaneous, but with some kind of decaying efficiency.
-
2.
The influence of , the parameter determining the e-folding distance of velocity decay within the radiatively stable regions, has been carefully tested. Larger values of allow longer blue phases; models calculated with a diffusive scheme for mixing and lead to an expected ratio of the order of .
-
3.
The cross-section of the reaction is the second major source of energy release during helium burning, so it may change the results obtained in terms of the duration of various evolutive phases during helium burning. We find that turning to the NACRE (Angulo et al. 1999) value (which is approximately double than the value given by the Caughlan & Fowler (1988) prescription) leads to increase the permanence in the blue region, so that the expected percentage of blue stars with respect to the red ones exceeds , which is in excellent agreement with the observational scenario. An analogous result is obtained by adopting the cross-sections for the quoted reaction given by Kunz et al. (2002) .
-
4.
The results obtained with the FST and MLT models for turbulent convection differ only in terms of the colour and the slope of the giant branch, but not for that concerning the expected ratio. No clear indication regarding convection can be got from this study.
References
- (1) Angulo, C., et al. 1999, Nucl. Phys. A, 656, 3
- (2) Asida, S.M. 2000, ApJ, 528, 896
- (3) Barmina, R., Girardi, L. & Chiosi, C. 2002, A&A, 385, 847
- (4) Basu, S. & Antia, H.M. 1994, Astrophys. Astron., 15, 143
- (5) Becker, S. & Mathews, J. 1983, ApJ, 270, 155
- (6) Böhm-Vitense, E. 1958, Z. Astroph., 46, 108
- (7) Bressan, A., Bertelli, G. & Chiosi, C. 1981, A&A, 102, 25
- (8) Brocato, E., & Castellani, V., 1988, A&A, 203, 293
- (9) Brocato, E., Castellani, V., Di Carlo, E., Raimondo, G., & Walker, A.R. 2003, ApJ, 125, 31111
- (10) Brocato, E., Castellani, V., & Piersimoni, A. 1994, A&A, 290, 59
- (11) Canuto, V.M. 1997, ApJ, 482, 827
- (12) Canuto, V.M., & Dubovikov, M. 1998, ApJ, 493, 834
- (13) Canuto, V.M., Goldman, I., & Mazzitelli, I. 1996, ApJ, 473, 570
- (14) Canuto, V.M., & Mazzitelli, I. 1991, ApJ, 370, 295
- (15) Castelli, F., Gratton, R.G., & Kurucz, R.L., 1997, A&A, 324, 432
- (16) Caughlan, G.R. & Fowler, W.A. 1988, Atomic Data Nucl. Tab. 40, 283
- (17) Caughlan, G.R., Fowler, W.A., Harris, M.J., & Zimmerman, B.A. 1985, Atomic Data Nucl. Tab. 32, 197
- (18) Chiosi, C., Bertelli, G., Meylan, G., & Ortolani, S. 1989, A&A, 219, 167
- (19) Cloutman, L. & Eoll, J.G. 1976, ApJ, 206, 548
- (20) Cloutman, L. & Whitaker, R.W. 1980, ApJ, 237, 900
- (21) D’Antona, F. 2002, in IAU Symposium Series, Vol.207, Extragalactic Star Clusters, eds. Geisler, D., Grebel, E.K., and Minniti, D.
- (22) D’Antona, F. & Mazzitelli, I. 1996, ApJ, 470, 1093
- (23) Deng, L., Bressan, A., & Chiosi, C. 1996a, A&A, 313, 145
- (24) Deng, L., Bressan, A., & Chiosi, C. 1996b, A&A, 313, 159
- (25) Freytag, B., Ludwig, H.G., & Steffen, M. 1996, A&A, 313, 497
- (26) Grossman, S.A. 1996, MNRAS, 279, 305
- (27) Grossman, S.A., & Narayan, R. 1993, ApJS, 89, 361
- (28) Herwig, F., Blöcker, T., Schönberner, D., & El Eid, M.F., 1997, A&A, 324, L81
- (29) Imbriani, G., Limongi, M., Gialanella, L., Terrasi, F., Straniero, O., & Chieffi, A. 2001, ApJ, 558, 9031
- (30) Kunz, R., Fey, M., Jaeger, M., Mayer, A., Hammer, J.W. 2002, ApJ, 567, 643
- (31) Maeder, A. & Meyner, G. 1991, A&AS, 89, 451
- (32) Mazzitelli, I., D’Antona, F., & Ventura, P. 1999, A&A, 348, 846
- (33) Pietrinferni, A., Cassisi, S., Salaris, M., & Castelli, F. 2004, ApJ, in press (astro-ph/0405193)
- (34) Pols, O.R., Schroder, K.P., Hurley, J.R., Tout, C.A., & Eggleton, P.P. 1998, MNRAS, 298, 505
- (35) Salasnich, B., Bressan, A., & Chiosi, C. 1999, A&A, 342, 131
- (36) Schmidt, E. G. 1984, ApJ, 356, 915
- (37) Stothers, R.B. & Chin, C.W. 1992, ApJ, 390, 136
- (38) Stothers, R.B. & Chin, C.W. 1995, ApJ, 440, 297
- (39) Stothers, R.B. & Chin, C.W. 1997, ApJ, 478, L103
- (40) Testa, V. Ferraro, F., Chieffi, A., Straniero, O., Limongi, M., & Fusi Pecci, F. 1999, AJ, 118, 2839
- (41) Ulrich, R.K. 1976, ApJ, 207, 564
- (42) Ventura, P., Zeppieri, A., D’Antona, F., & Mazzitelli, I. 1998, A&A, 334, 953
- (43) Vitense, E. 1953, Zs.Ap., 32, 135
- (44) Xiong, D.R. 1980, ChA, 4, 234
- (45) Xiong, D.R. 1985, A&A, 150, 133
- (46) Xiong, D.R., Cheng, Q.L., & Deng, L. 1997, ApJS, 108, 529