3C 223.1: A source with unusual spectral properties
Abstract
Analysis of Giant Metrewave Radio Telescope low frequency data for an -shaped source, 3C 223.1 has revealed an unusual result. The radio morphologies of it at 240 and 610 MHz show well defined -shape with a pair of active jets along the north-south axis and a pair of wings along the east-west axis, that pass symmetrically through the undetected radio core. The wings (or low surface brightness jets) have flatter spectral indices with respect to the high surface brightness jets, which confirms the earlier marginal result obtained at high frequency by Dennett-Thorpe et al. (2002). Although unusual, it is a valuable result which puts stringent constraints on the formation models and nature of these sources. This result clearly shows the value of mapping the sample of -shaped sources at low frequencies.
keywords:
galaxies: active – individual: 3C 223.1 – galaxies: formation – radio continuum: galaxies – spectral index1 Introduction
The -shaped or ‘winged’ sources form a peculiar class of extragalactic sources consisting of eleven sources compiled by Leahy & Parma (1992). These sources are characterised by two low surface brightness lobes (the ‘wings’) oriented at an angle to the ‘active’, or high surface brightness radio lobes, giving the total source an ‘’ shape; both sets of lobes usually pass symmetrically through the centre of the associated host galaxy. Recently (Merritt & Ekers, 2002) noted that seven out of eleven are of Fanaroff-Riley type II (FR II) (Fanaroff & Riley, 1974) and rest are either FR I or mixed.
Source 3C 223.1 ( = 0.1075) is a classical -shaped source, which does not reside in a rich cluster; instead it probably resides in an environment similar to ‘classical’ FR IIs of similar radio power. Although, the host galaxy seems to be a relatively undisturbed elliptical, its HST image shows a beautiful central bulge with a dusty disk (de Koff, 1996). Radio observations show a high degree of polarisation (15–30 per cent) in the wings, and an apparent magnetic field structure parallel to the edge of the source and along the length of the wings (Dennett-Thorpe et al., 2002). Further high frequency and high resolution radio polarisation images showed field lines wrapping around the edges, as well as complex internal structure (Black et al., 1992).
We have started a project to study the sample of -shaped radio sources at 240 and 610 MHz using the Giant Metrewave Radio Telescope (GMRT). In this paper we present results for 3C 223.1 and describe its morphological and spectral properties. We use the data to study the behaviour of the low frequency spectra at several locations (the north and south lobes and the east and west wings) across the source and compare it with the existing models. We would also discuss the implications of our results on the formation models of -shaped sources.
2 Observations
| 610 MHz | 240 MHz | |
|---|---|---|
| Observing date | 18 Dec 2003 | 18 Dec 2003 |
| Duration | 10.45 Hrs | 10.45 Hrs |
| Centre frequency | 606.68 MHz | 237.19 MHz |
| Nominal bandwidth | 16 MHz | 6 MHz |
| Effective bandwidth | 14.25 MHz | 5 MHz |
| Primary beam | 43′ | 108′ |
| Synthesized beam | 8′′.6 5′′.0 | 17′′.4 13′′.3 |
| (P.A.) | 80∘.4 | 80∘.3 |
| Sensitivity () | 0.4 mJy beam-1 | 3.0 mJy beam-1 |
| Dynamic range | 1700 | 900 |
| Calibrator | 3C 286 | 3C 286 |
| (3C 286) | 21.02 Jy | 28.07 Jy |
The 240 and 610 MHz feeds of GMRT (Ananthakrishnan & Rao, 2002) are coaxial feeds and therefore, simultaneous multi-frequency observations at these two frequencies are possible. We made full synthesis observations of 3C 223.1 at 240 and 610 MHz, in the dual frequency mode, using the GMRT on 18 Dec 2003 in the standard spectral line mode with a spectral resolution of 125 kHz. Table 1 gives the details of the observations. The visibility data were converted to FITS and analyzed using standard AIPS. The flux calibrator 3C 286 was observed in the end as an amplitude calibrator and to estimate and correct for the bandpass shape. We used the flux density scale which is an extension of the Baars et al. (1977) scale to low frequencies, using the coefficients in AIPS task ‘SETJY’. Source 0834555 was used as the phase calibrator and was observed once every 35 min. The error in the estimated flux density, both due to calibration and systematic, is 5%. The data suffered from scintillations and intermittent radio frequency interference (RFI). In addition to normal editing of the data, the scintillations affected data and channels affected due to RFI were identified and edited, after which the central channels were averaged using AIPS task ‘SPLAT’ to reduce the data volume. To avoid bandwidth smearing, 5.00 MHz of clean band at 240 MHz was reduced to 4 channels of 1.25 MHz each. At 610 MHz where there was little RFI, 14.25 MHz of clean band was averaged to give 3 channels of 4.75 MHz each.
While imaging, 55 facets (obtained using AIPS task ‘SETFC’), spread across a 2 field were used at 240 MHz and 12 facets covering slightly less than a 0. field, were used at 610 MHz to map each of the two fields using AIPS task ‘IMAGR’. We used ‘uniform’ weighting and the 3D option for W term correction throughout our analysis. The presence of a large number of point sources in the field allowed us to do phase self-calibration to improve the image. After 2–3 rounds of phase self-calibration, a final self-calibration of both amplitude and phase was made to get the final image. At each round of self-calibration, the image and the visibilities were compared to check for the improvement in the source model. The final maps were combined using AIPS task ‘FLATN’ and corrected for the primary beam of the GMRT antennas.
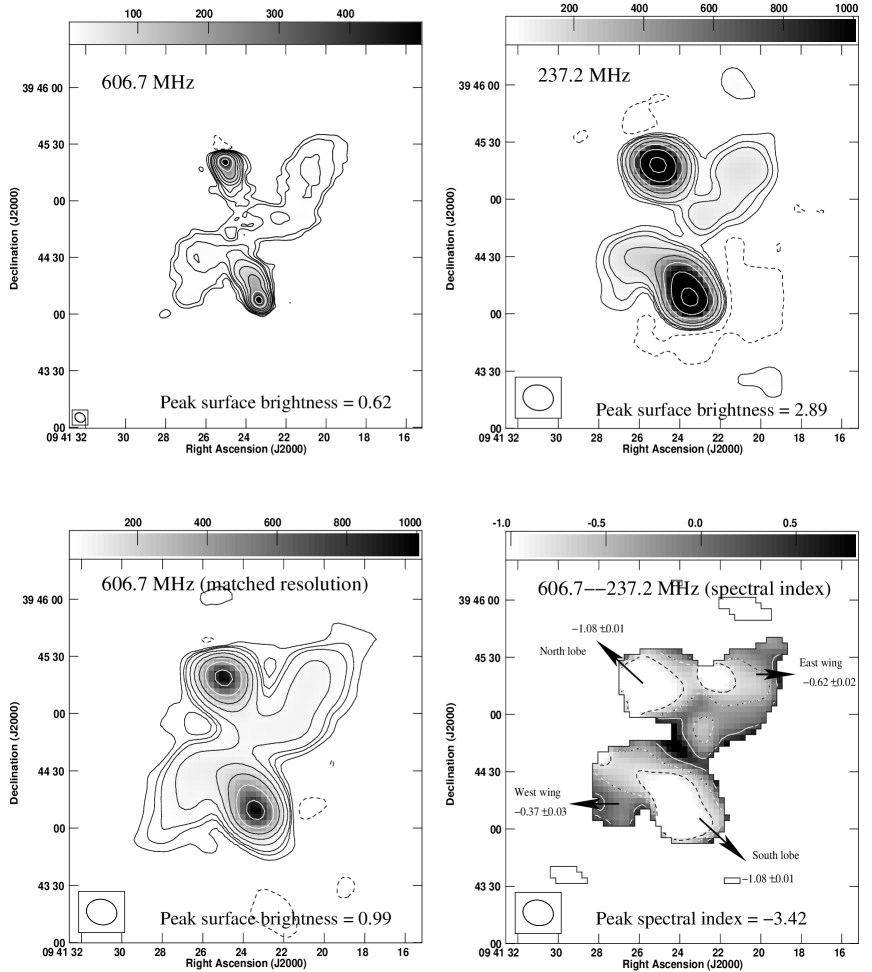
The full synthesis radio images shown in Fig. 1 have nearly complete UV coverage, an angular resolution 15′′ and 8′′ and the rms noise in the maps are 3.0 and 0.4 mJy beam-1 at 240 and 610 MHz, respectively. The dynamic ranges in the two maps are 900 and 1700 respectively at 240 and 610 MHz. The GMRT has a hybrid configuration (Swarup et al., 1991) with 14 of its 30 antennas located in a central compact array with size 1.1 km and the remaining antennas distributed in a roughly ‘Y’ shaped configuration, giving a maximum baseline length of 25 km. The baselines obtained from antennas in the central square are similar in length to those of the VLA -array, while the baselines between the arm antennas are comparable in length to the VLA -array. A single observation with the GMRT hence yields information on both small and large angular scales with reasonably good sensitivity.
 |
3 Radio morphology
The first high angular resolution, high sensitivity images of 3C 223.1 at the lowest frequencies of 240 MHz (upper right panel) and 610 MHz (upper left panel) are shown in Fig. 1. This complex radio source shows an -shaped morphology at both 240 and 610 MHz. The angular extent is 105 arcsec along the apparently active lobes (those with hot-spots) and 150 arcsec along the wings. The nuclear source of 3C 223.1 is invisible at both these frequencies and also in the radio maps of Dennett-Thorpe et al. (2002), but is detected and is unresolved at 8.4 GHz (Black et al., 1992). The weak jet detected mid-way between core and north lobe by Black et al. (1992) at 8.4 GHz is not seen in our low resolution maps, because of coarser resolution. Our low resolution maps also suggest of a sharp boundary at the farthest end of the north lobe and a likely ring-like feature in the south lobe, which is consistent with earlier results of Black et al. (1992).
The final calibrated UV data at 610 MHz was mapped using UV taper of 0–22 k, which is similar to that of 240 MHz data and then restored using the restoring beam corresponding to the 240 MHz map (Fig. 1, lower left panel). In Table 2, we show the integrated flux densities of 3C 223.1 along with previous measurements at other frequencies. Our estimates at both frequencies, 240 and 610 MHz agrees well with that of the measurements from other instruments. We therefore believe that we have not lost any flux density in our interferometric observations and there are no systematics introduced in our analysis.
| Freq | Flux density (Jy) | ||||
|---|---|---|---|---|---|
| (MHz) | Total | N lobe | W wing | S lobe | E wing |
| 178† | 8.7 | ||||
| 240∥ | 8.33 0.41 | 2.95 | 0.18 | 3.27 | 0.12 |
| 0.003 | 0.003 | 0.003 | 0.003 | ||
| 408‡ | 4.72 0.10 | ||||
| 610∥ | 3.56 0.17 | 1.07 | 0.10 | 1.20 | 0.09 |
| 0.001 | 0.001 | 0.001 | 0.001 | ||
| 1400∐ | 1.90 0.28 | 0.55 | 0.04 | 0.63 | 0.03 |
| 2695∪ | 1.23 0.61 | ||||
| 4850∩ | 0.78 0.11 | ||||
| 0.91 0.07 | 1.08 | 0.62 | 1.08 | 0.37 | |
| 0.01 | 0.02 | 0.01 | 0.03 | ||
| 0.75 0.02 | 0.75 | 0.66 | 0.77 | 0.70 | |
4 Low frequency radio spectra
The observations and morphology described above allow us to investigate in detail the spectral index distribution of 3C 223.1. The restored and matched maps at 240 and 610 MHz, were used further for the spectral analysis. We determine the spectral index distribution using the standard direct method of determining the spectral index between maps and at two frequencies and , given by
 |
The low frequency flux densities plotted in Fig. 2 are calculated using the images shown in Fig. 1 (upper right and lower left panels), which are matched to the same resolution, and these values are tabulated in Table 2. The flux densities at higher frequencies in this table are quoted using earlier observations in Dennett-Thorpe et al. (2002). The flux densities for the active lobes and the wings are integrated over the region, which is at least 4 times the beam size and above their 3 contour to reduce statistical errors. Analysis of the spectrum in different regions of the source shows remarkable variation across the source (Fig. 1, lower right panel).
We have obtained the best power-law fit (). The low frequency (240–610 MHz) fitted spectra have 0.37 1.08 for all regions across the source. The source also shows evidence for steeper spectra in the active lobes than in the wings. The east and west wings have low frequency (240–610 MHz) spectral indices, 0.37 0.03 and 0.62 0.02 respectively, whereas the north and south active lobes have 1.08 0.01 and 1.08 0.01 respectively (also see Fig. 1 caption). These results at low frequencies are consistent with those obtained at high frequency by Dennett-Thorpe et al. (2002), who found that the spectral indices between 1.4 and 32 GHz to be 0.70 0.03 and 0.66 0.03 for the east and west wings, and 0.75 0.02 and 0.77 0.02 for the north and south active lobes, respectively.
This result being unusual, we were worried about the possibility that the different UV coverages at 240 and 610 MHz could produce some systematic errors. While this is unlikely, since the source is only 3–4 arcmin across and is much smaller than the primary beam, we examined the effect of different UV coverages by Fourier transforming the 240 MHz clean map, sampling it with the UV coverage of 610 MHz and reimaging this visibility data set. The resultant map showed no systematic differences from the original 240 MHz map and the rms difference in the two maps was less than 4 %, corresponding to the rms error in the spectral index of 0.05. Furthermore, the 240 MHz contour plot of source (Fig. 1, upper right panel) shows some evidence that this image contains a negative depression around the source that is less prominent at 610 MHz. While imaging, we did not provide zero-spacing flux density, but we have done deep cleaning, so as not to make any deconvolution errors. Nevertheless, we look into the errors that would be introduced due to possible negative depression. The maximum possible depression close to the source at 240 and 610 MHz are 7.6 and 2.7 mJy beam-1 respectively. This worst case would introduce a maximum error of 0.14 in spectral indices for the wings and 0.01 for the active lobes. Since, the observed differences in spectral index at low frequencies are much more than any of these uncertainties for 3C 223.1, we believe that the observed spectral index features are real.
5 Discussion
Many authors have attempted to explain the unusual structure in -shaped sources. The first attempt was made by Rees (1978), who suggested that the jet direction precesses due to a realignment caused by the accretion of gas with respect to the central black hole axis. Dennett-Thorpe et al. (2002) discussed four possible scenarios for the formation of such radio morphology: (1) backflow from the active lobes into the wings (Leahy & Williams, 1984; Capetti et al., 2002); (2) slow conical precession of the jet axis (Parma et al., 1985; Mack et al., 1994); (3) reorientation of the jet axis during which flow continues; and (4) reorientation of the jet axis, but with the jet turned off or at greatly reduced power during the change of direction. Merritt & Ekers (2002) suggested another possible scenario, i.e. the reorientation of black holes’s spin axis due to a minor merger, leading to a sudden flip in the direction of any associated jet. A variant of Merritt & Ekers (2002) model was suggested by Gopal-Krishna et al. (2003), where the sources with morphology within their -shapes evolve along a - morphological sequence. Presently, most of the observational results seem to prefer possibilities 3, 4 of Dennett-Thorpe et al. (2002) or Merritt & Ekers (2002) or Gopal-Krishna et al. (2003). The key difference between Dennett-Thorpe et al. (2002) and Merritt & Ekers (2002) reorientation models is in terms of mechanism of reorientation; former favoured the disc instability mechanism because of little evidence for recent merger in their sample, while the latter preferred the coalescence scenario. Nevertheless, in these favoured scenarios (and also in other models), the wings are interpreted as relics of past radio jets and the active lobes as the newer ones.
Using these radio observations, the spectra at different locations in the source might be used to distinguish between some of the models suggested for these sources. In the simplest picture, the low surface brightness wings would have an older population of the electrons and therefore should have steeper spectral index as compared to the active high surface brightness radio lobes if the magnetic fields are uniform in the measured regions. But, the spectra of low surface brightness jet (or the wings) being flatter than the active high surface brightness jet, is opposite to this simple picture.
5.1 Interpretations based on spectral ageing
Below we present some of the assumptions used in the spectral ageing method for estimating the age and discuss what could be modified to explain the above result.
1. The injection spectral index is assumed to be constant during the active phase of the AGN and the evolution of the synchrotron spectrum is assumed to be due to the synchrotron losses. One of the favoured scenario for the formation of -shaped sources is the reorientation of the jet axis (Dennett-Thorpe et al., 2002). It is possible that along with the reorientation of the jet axis the injection spectral index also changed. It is then possible to have a flatter spectral index in the wings compared to the active lobes. A similar interpretation was also suggested by Palma et al. (2000), to explain the anomalous spectral index features seen in NVSS 214682.
2. In classical radio galaxies, it is the usually the high surface brightness hot-spots which consist of a young population of energetic electrons and they are the source of plasma for the low surface brightness lobes, which eventually consist of older population of electrons. In the case of -shaped sources, whose formation is yet to be understood, it is possible that this is not the case. Instead, it is possible that the wings are in the process of becoming new active jets, in which case it is not surprising that they have flatter spectral index compared to the active lobes.
3. Reacceleration mechanisms are mainly seen in hot-spots and sites undergoing interactions, which needs to be appropriately accounted for while interpreting evolution of synchrotron spectrum. The diffuse, low surface brightness regions are usually believed to be relaxed systems. It is hard to achieve reacceleration mechanisms in the low surface brightness lobes or wings, via. standard Alfven waves and Fermi mechanisms. Therefore, presently it is difficult to reconcile the observed spectral indices in the wings and the active lobes, unless there exists an additional exotic reacceleration mechanism.
4. Magnetic field strength does not evolve and its distribution is believed to be isotropic, and hence the synchrotron emission is isotropic. Blundell & Rawlings (2000) have questioned this assumption, and have provided an alternative physical picture which could mimic the observed spectral behaviour. They invoke a gradient in magnetic field across the source, together with a curved electron energy spectrum, which would result in spectral indices being different at distinct locations within the source and could possibly explain our observed results.
5.2 -shaped sources–Merger of two AGNs
We now discuss an alternative scenario, which is not addressed earlier, for the -shaped sources.
Although there are several examples of resolved binary AGN systems, examples of unresolved binary AGN systems are unknown. -shaped sources, could be of the latter kind, with two pairs of jets being associated with two unresolved AGNs. An indirect hint for the presence of binary AGNs is using HST to identify inwardly decreasing surface brightness profiles in the galaxy. This is also found to be so using N-body simulations, in which a coalescing binary black hole creates a ‘loss cone’ (displaced matter within a distance which is roughly the separation between the two black holes when they first form a bound pair) around it (Merritt, 2004). We have reanalyzed the archived HST data, and close inspection of the deconvolved brightness profile does not suggest a centrally depressed, nearly flat core. But this could be due to obscuration of the core by the dusty disk, as suggested by de Koff (1996), and therefore we could not see signature of the ejection of stars from the core during the hardening of the AGNs undergoing merger.
Future high resolution, phase-referencing very long baseline interferometry, radio imaging of 3C 223.1 could look for Keplerian orbital motion of some emission component close to black holes, and might be used to detect the presence of binary AGNs containing super massive black holes (e.g. 3C 66B, Sudou et al., 2003).
6 Conclusions
We have presented the lowest frequency image of 3C 223.1 at 240 MHz. The important consequences of these observations combined with our 610 MHz observations are as follows:
1. The low surface brightness lobes (or the ‘wings’) have flatter spectra as compared to the high surface brightness active radio lobes.
2. This result is not easily explained in most models of the formation of -shaped sources.
3. Low frequency, high resolution radio images for the entire sample of -shaped sources would be useful in understanding the formation models for these sources. A project using GMRT is in progress and the analysis is in advanced stage. Our subsequent papers would present the morphological and spectral radio results, and discuss the results statistically for the whole sample of -shaped sources.
Acknowledgments
We thank the staff of the GMRT who have made these observations possible. GMRT is run by the National Centre for Radio Astrophysics of the Tata Institute of Fundamental Research. We also thank the anonymous referee for his/her prompt review of the manuscript and for comments that lead to improvement of the paper. DVL thanks R Nityananda, K Subramanian and PJ Wiita for discussions and several useful comments and S Ravindranath for helping with HST data analysis. This research has made use of the NASA/IPAC Extragalactic Database which is operated by the Jet Propulsion Laboratory, Caltech, under contract with the NASA, and NASA’s Astrophysics Data System.
References
- Ananthakrishnan & Rao (2002) Ananthakrishnan, S., Rao, A.P., 2002, Proc. of a conf., Multi Colour Universe, eds Paul, B., Manchanda, R.K., TIFR, India, p. 233
- Baars et al. (1977) Baars, J.W.M., Genzel, R., Pauliny-Toth, I.I.K., Witzel, A., 1977, A&A, 61, 99
- Becker et al. (1995) Becker, R.H., White, R.L., Helfand D.J., 1995, ApJ, 450, 559
- Blundell & Rawlings (2000) Blundell, K.M., Rawlings, S., 2000, AJ, 119, 1111
- Black et al. (1992) Black, A.R.S., Baum, S.A., Leahy, J.P., Perley, R.A., Riley, J.M., Scheuer, P.A.G., 1992, MNRAS, 256, 186
- Capetti et al. (2002) Capetti, A., Zamfir, S., Rossi, P., Bodo, G., Zanni, C., Massaglia, S., 2002, A&A, 394, 39
- Dennett-Thorpe et al. (2002) Dennett-Thorpe, J., Scheuer, P.A.G., Laing, R.A., Bridle, A.H., Pooley, G.G., Reich, W., 2002, MNRAS, 330, 609
- Fanaroff & Riley (1974) Fanaroff, B.L., Riley J.M., 1974, MNRAS, 167, 31P
- Ficarra et al. (1985) Ficarra, A., Grueff, G., Tomassetti, G., 1985, A&AS, 59, 255
- Gopal-Krishna et al. (2003) Gopal-Krishna, Biermann, P.L., Wiita, P.J., 2003, ApJL, 594, 103
- Kellermann (1969) Kellermann K.I., Pauliny-Toth, I.I.K., Williams, P.J.S, 1969, ApJ, 157, 1
- de Koff (1996) de Koff, S., Baum, S.A., Sparks, W.B., Biretta, J., Golombek, D., Macchetto, F., McCarthy, P., Miley, G.K., 1996, ApJS, 107, 621
- Leahy & Parma (1992) Leahy, J.P., Parma, P., 1992 in Extragalactic Radio Sources. From Beams to Jets, Cambridge University Press, Roland, J., Sol, H., Pelletier, G, Eds., 1992, p. 307
- Leahy & Williams (1984) Leahy, J.P., Williams, A.G., 1984, MNRAS, 210, 929
- Mack et al. (1994) Mack, K.-H., Gregorini, L., Parma, P., Klein, U., 1994, A&AS, 103, 157
- Merritt (2004) Merritt, D., 2004, in Coevolution of black holes and Galaxies, ed L.C. Ho. (Cambridge Univ Press)
- Merritt & Ekers (2002) Merritt, D, Ekers, R.D., 2002, Sci, 297, 1310
- Palma et al. (2000) Palma, C., Bauer, F.E., Cotton, W.D., Bridle, A.H., Majewski, S.R., Sarazin, C.L. 2000, AJ, 119, 2068
- Parma et al. (1985) Parma, P., Ekers, R.D., Fanti, R. 1985, A&AS, 59, 511
- Rees (1978) Rees, M.J., 1978, Nat, 275, 516
- Ryle (1960) Ryle, M., 1960, J. Instn elect. Engrs, 6, 14
- Sudou et al. (2003) Sudou, H., Iguchi, S., Murata, Y., 2003, Sci, 300, 1263
- Swarup et al. (1991) Swarup, G., Ananthakrishnan, S., Kapahi, V.K., Rao, A.P., Subrahmanya, C.R., Kulkarni, V.K., 1991, Cu. Sc., 60, 95 2003, ApJ 126, 113
- White & Becker (1992) White, R.L., Becker, R.H., 1992, ApJS, 79, 331