The Origin and Distribution of Diffuse Hot Gas in Spiral Galaxy NGC 3184
Abstract
Deep Chandra exposures reveal the presence of diffuse X-ray emission with a luminosity of ergs s-1 from the spiral galaxy NGC 3184. This appears to be truly diffuse thermal emission distinct from the low-luminosity LMXB emission. While the unresolved emission from older LMXBs is more uniformly distributed across the galaxy, the diffuse X-ray emission is concentrated in areas of younger stellar populations and star forming regions. The surface brightness of the diffuse emission over the spiral arms is five times greater than in off-arm regions, and eight times brighter in H II regions than in non-H II regions. Spectral fits to the diffuse thermal emission are consistent with a low temperature component, T K, plus a higher temperature component, T K.
1 Introduction
Observations of the diffuse soft X-ray background (McCammon et al., 1983; McCammon & Sanders, 1990) reveal the presence of several large bubbles of hot few-million degree plasma within a few hundred parsecs, Sco-Cen and Orion-Eridanus, in addition to the local bubble of one-million degree plasma. How pervasive these bubbles and the hot phase of the interstellar medium (ISM) are within the Milky Way is not known, primarily because we cannot observe the hot gas in our Galaxy beyond a few hundred parsecs due to the large cross-section for soft X-ray absorption by the neutral interstellar material. Most models suggest that there are hot bubbles scattered throughout the disk, having a filling factor of order 10%, with the Sun by chance inside one (Slavin, 1989; Slavin & Cox, 1992, 1993; Ferriere, 1998).
In the usual model for a diffuse hot gas bubble, a combination of supernovae and stellar winds create shocks that force the ISM gas into a dense shell of neutral material surrounding the SNe and remaining hot stars (Smith & Cox, 2001). The diffuse gas that is left within the expanding bubble is heated by the shock to temperatures of several million degrees. The ultimate fate of the hot gas within the bubble is still not well understood. The bubble may break out of the disk, feeding the type of X-ray halos seen around NGC 891 and NGC 253 (Bregman & Irwin, 2002; Strickland et al., 2002), or it may be pressure-confined to the disk (Boulares & Cox, 1990). In either case, the defining morphological characteristic of a bubble of hot gas is a volume emptied of cool gas, but containing hot gas emitting thermal X-rays, and typically surrounded by a dense shell containing cooler shock-ionized and neutral gas. In this scenario diffuse X-ray emission in a galaxy will be associated with recent SNe and hot stars, both signatures of star-forming regions. The ultimate fate of the bubble depends on its energy (i. e. expansion velocity) and the conditions of its surrounding environment (i. e., density and pressure distributions).
The question of the pervasiveness of the diffuse hot gas within a galaxy cannot be well addressed by observations of our Galaxy, but can be addressed in nearby face-on galaxies. Absorption within our Galaxy requires that we observe other systems to gain an understanding of the distribution of the hot ISM on a galactic scale. Until recently, observations of diffuse X-ray emission in other spiral galaxies have been limited by instrument angular resolution, as with the Einstein and ROSAT observations. The IPC instrument on Einstein had an angular resolution of 1′ and the PSPC instrument on ROSAT had a 50% encircled energy radius averaged over the field of view of (Aschenbach, 1988). Without better angular resolution, point source emission can not be distinguished from regions of diffuse thermal emission. McCammon & Sanders (1984) used Einstein to observe M101, and Cui et al. (1996) looked at five face-on spiral galaxies, including M101, with ROSAT, but both were able to put only upper limits on the total flux coming from the diffuse emission. Now with the Chandra X-ray Observatory’s resolution of 1′′, point sources can be identified and removed, making observations of the diffuse emission from other galaxies feasible (Wang et al., 2001; Fraternali et al., 2002; Strickland et al., 2002; Swartz et al., 2003; Kuntz et al., 2003).
We obtained deep X-ray and optical observations of NGC 3184 to investigate the filling factor of the diffuse X-ray emission and to determine the spatial correlation between star forming regions and diffuse hot gas in a galaxy similar to the Milky Way. Particulars of NGC 3184 are given in Table 1. In §2 we present the data and details of the X-ray and optical imaging observations and reductions. Section 3 is devoted to the analysis of the point source population and the spectral properties of the X-ray emission. Our results are presented in §4. Comparisons between the properties of the diffuse hot gas in NGC 3184 and those of superbubbles in our Galaxy are discussed in §5.
2 Observations and Reductions
2.1 Chandra Data
Chandra observations of NGC 3184 were made with the galaxy centered on the back-illuminated S3 chip of the ACIS instrument: a 42.66 ks exposure on 8 January 2000 (obs ID 804) and a 24.04 ks exposure on 3 February 2000 (obs ID 1520). The second observation was performed to observe SN1999gi (Schlegel, 2001), which occurred near the center of NGC 3184 in December 1999. We used the Chandra X-ray Center’s analysis program CIAO (Chandra Interactive Analysis of Observations) version 2.3 and the Chandra calibration files, CALDB Version 2.21, to reduce the observations. Our reduction processing followed the guidelines released by Chandra X-Ray Center (CXC) and utilized various of the CIAO “science threads,” which can be found at http://asc.harvard.edu/ciao/documents_threads.html.
Enhanced charged particle fluxes unrelated to the observed X-ray source are often seen during observations with the S3 chip, and our observations contained a number of them. For a discussion of these “flares” see Plucinsky & Virani (2000). The flares were identified by generating a light curve of events in the 2.5-7.0 keV range, using an iterative-clipping algorithm to determine the quiescent mean rate, and rejecting intervals that exceeded the mean-plus-three-sigma rate. After filtering, the combined observations provided 56.50 ks of useful data. We re-gridded the two event files around a common tangent point using the associated aspect solution files in the CIAO tool reproject_events so that the event lists could be combined using a common coordinate system. The data from the two observations were then combined into a single image. For our analysis we used only the region where the two observations overlapped.
The full energy range that we used for analyzing our Chandra observations is 0.36-8.0 keV. Below 0.36 keV the increasing electronic noise swamps the X-ray signal coming from the sky. At higher energies there is negligible instrumental response above 8.0 keV. There is minimal diffuse emission above 1.3 keV from NGC 3184 so we restrict our band pass to 0.36-1.3 keV for image analysis, but maintain a larger band pass for point source detections and spectral fits. An image of the 0.36-1.3 keV diffuse soft X-ray emission is shown in Figure 1. Point sources have been removed via the procedures described in §3.1. The raw image has a plate scale of 0.492 arcsec pixel-1, but the image in Figure 1 was smoothed using a six-pixel () Gaussian filter. There is an enhancement of the 0.36-1.3 keV band X-ray surface brightness over the face of NGC 3184. The decrease in signal off the galaxy can be better seen in Figure 2, which shows a plot of counts s-1 arcsec-2 (in the band pass 0.36-1.3, with point sources removed) as a function of distance from the galaxy’s center. The dashed line in Figure 2 indicates the level of the non-X-ray instrument background, and the solid line on the right hand side shows the level of the total background off-galaxy –both were determined from the spectral fits described in §3.2. We defined the X-ray extent of NGC 3184 by where the X-ray radial profile flattens, at a radius of . A circle of this radius was used to separate the on-galaxy region from the off-galaxy region and is indicated by the red circle in Figure 1. A circle of radius is smaller than the optical definition of the galaxy given in Table 1.
2.2 Optical Data
We observed NGC 3184 over two nights in March and April of 2001 using the WIYN111The WIYN Observatory is a joint facility of the University of Wisconsin-Madison, Indiana University, Yale University, and the National Optical Astronomy Observatories. 3.5-m telescope at Kitt Peak, AZ. The WIYN observations consisted of two B band exposures adding up to 2400 s, one 900 s V band exposure, two R band exposures combining for 1200 s, three H ( = 6565Å, 47Å) exposures for a total of 3600 s and one H continuum ( = 6618Å, 72Å) exposure for 1200 s. All observations were made with the Mini-Mosaic camera, which has a field of view and a 0.141 arcsec pixel-1 plate scale. Observing conditions were not photometric and therefore we were unable to calibrate the optical images.
The Mini-Mosaic instrument is a combination of two CCD chips, each with two amplifiers. Each amplifier has a different bias, which needs to be taken into account. We corrected for the bias difference, subtracted the over-scan (the background level from the non-illuminated region of the chip), and flat-fielded the images using dome flats. To obtain adequate astrometry, we fit the positions of 100 stars in the field and derived a plate solution. We combined the data from the four amplifiers into a single image for each exposure and removed the cosmic ray hits from each of those images. Finally we combined multiple observations that used the same filter to create a single image in each band. The B band image of NGC 3184 is shown in Figure 3 and the continuum-subtracted H image is shown in Figure 4. The horizontal strip in each of these images is a result of a gap between the two CCD chips.
A radial surface brightness profile of the NGC 3184 B band image was examined and shows that the extent of the galaxy is slightly smaller in the X-ray than in the optical. The B band image was used to define the NGC 3184 spiral arms. To define the spiral arms we used a series of annuli, each centered on the center of the galaxy and 7′′ wide, to generate azimuthal profiles from the B band image outside a 28′′ radius circle. Sections of the profiles that were 20% greater than the background-subtracted mean for that ring are used as a guide to distinguish between the “arm” and “off-arm” regions of the galaxy. NGC 3184 has weak spiral arms, in that the brightness contrast between “arm” and “off-arm” regions is low. While this is not a rigorous algorithm, it results in a good approximation of the spiral structure of NGC 3184. The central 28′′ was also considered part of the spiral arm. Using this technique, we found 24% of the optical disk is “arm.” The “arm” region is outlined in blue in Figures 1, 3 and 4.
The bright H II regions were isolated using our H observations. We subtracted the 6618 Å image from the 6565 Å image to yield a continuum-subtracted H image. We smoothed the image using a 31x31 pixel (437) box filter and fit a Gaussian to a histogram of the smoothed data. Regions that were more than 10 times brighter than the standard deviation of the Gaussian distribution were identified as H II regions. Only 2.4% of the galaxy meets this criterion of emitting brightly in H. These regions are outlined in green in Figure 4.
Although neither the spiral arm region nor the H II regions are defined using the X-ray data, the regions are correlated with the distribution of X-ray emission. The diffuse X-ray emission from NGC 3184 is not uniformly distributed across the galaxy. Figure 2 shows there is a radial dependence of the surface brightness of the hot gas and we see X-ray emission out to (10 kpc for a distance of 11.6 Mpc), but the distribution is not simple. In Figure 1, the hot gas appears to have not only a radial dependence, but also to be correlated with the galaxy’s spiral arms. Furthermore, where the H emission is bright, the X-ray emission is also bright, but the converse is not true. This is most noticeable in the central 1 kpc of the galaxy where there is bright X-ray emission, but negligible H emission.
3 Analysis
Before analyzing the diffuse X-ray emission, we have to account for contributions to the flux from NGC 3184 from both point sources and the background. To do that we removed the resolved point sources and modeled the remaining unresolved emission. Section 3.1 addresses the resolved point sources. Section 3.2 addresses the non-X-ray and X-ray backgrounds. In section 3.3 we take into account the unresolved point sources and fit the total unresolved emission from NGC 3184.
3.1 Point Sources
Point sources in the Chandra data were detected using the full 0.36-8.0 keV Chandra energy band and the CIAO program wavdetect (Freeman et al., 2002). wavdetect searches over multiple scale sizes and correlates them to find point sources. We applied wavdetect using the logarithmic spatial scales of 1, 1.4, 2, and 4 pixels (chosen to optimize the wavelet search function), and a significance threshold for source detection corresponding to a less than 10-6 chance probability of a false detection due to local background fluctuations. For each source, wavdetect identifies an elliptical source region whose axes are three times the standard deviation of the distribution of the source counts. We detected 61 sources in our 0.019 deg2 field of view, 44 of them from the 0.0096 deg2 region on the face of NGC 3184 and 17 from the 0.0094 deg2 region off of NGC 3184. The latter number is roughly consistent with that expected from the log N - log S function of Mushotzky et al. (2000). The locations of the 61 resolved sources are indicated as green ellipses in Figures 1 and 3.
For each point source, the net number of detected counts in the 0.36-8.0 keV band within the source region defined by wavdetect was determined by subtracting the local background normalized for each source region. The local background region was taken to be that between concentric ellipses surrounding the source with axes 1.5 and 3 times the axes of the source ellipse. To determine the flux from the sources we used the spectral fit to the combined point source spectrum, as described in §3.3. By dividing the number of counts in the combined point source spectrum by the model-predicted flux in our band pass, we determined a counts-to-flux factor that we used to convert the number of counts from a given source to a flux. To correct for the differences in the instrument response across the detector, we divided the flux from each point source by the relative value of the exposure map at that location. The exposure map was created using the mean energy of the point source spectrum, 1.6 keV, which was calculated using the spectral fits described in §3.3. The exposure map combines for each pixel the exposure time, the effective collecting area of the mirror, and the detector efficiencies and geometry. Assuming all 44 sources from the galaxy are at the distance of NGC 3184, we converted source fluxes to luminosities, finding that resolved sources have luminosities of to ergs s-1 in the 0.36-8.0 keV band.
The log N - log L (number vs. luminosity) relation for the 44 detected sources from NGC 3184 is given in Figure 5. This distribution is similar to that found by Kilgard et al. (2002) in other nearby spiral galaxies (including obs ID 804 of this NGC 3184 data set). A one-component power-law fit to the log N - log L data resulted in an unacceptable reduced of 7.7. We then used a broken power-law model to fit the log N - log L data and found a reduced of 0.79. The break in the distribution occurs at ergs s-1. At higher luminosities the power-law exponent is , and for fainter luminosities the exponent is . Following Kilgard (2002), the break in the source luminosity function may be providing us with information on the last episode of enhanced star formation in NGC 3184, but the change in power-law index across the break, 0.5, is not very close to the value of 1 expected in their model for an age-dependent luminosity function. The data start to fall away from the power-law fit at a luminosity of ergs s-1, indicating that below this luminosity, our point source detection is probably incomplete.
3.1.1 SN 1999gi
One of the sources we removed from NGC 3184 was the Type II-plateau supernova, SN 1999gi, reported by Schlegel (2001). The position of SN 1999gi can be seen in the expanded B band image of Figure 6. The location of the SN is on the leading edge of the northern spiral arm, in a region that contains a number of objects bright in the B band. This is highly suggestive that its progenitor was an early-type star in an OB association. This region has an enhancement, independent of the SN, of X-ray and H flux (see Figure 1 and 4) and is possibly a superbubble.
3.2 Background Fitting
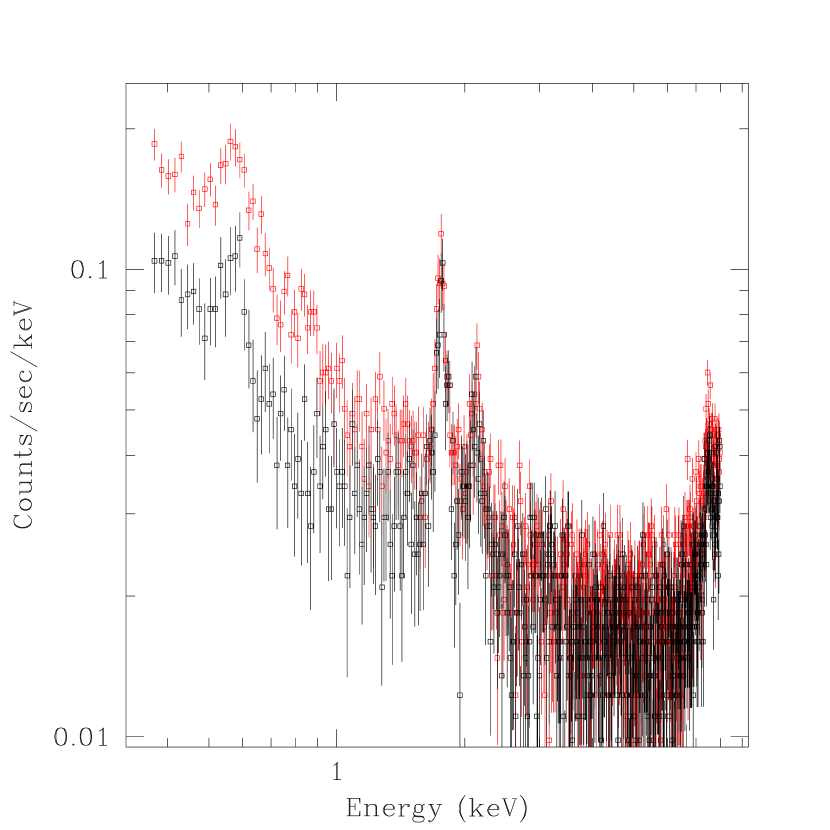
To determine the surface brightness of NGC 3184, and the regions within it, we performed spectral fits to the data from those regions and used the best fit model parameters to characterize the surface brightnesses. Figure 7 shows the combined spectrum from the two observations of NGC 3184, both on and off the galaxy, over the 0.36-8.0 keV energy range. For spectral fitting, we used the energy range of 0.36-3.0 keV so that we include significant higher energy continuum. In all of our spectral fits, we performed simultaneous fits to the two independent data sets from the separate observations. Although the sky spectra were required to be the same for the data from the two independent observation dates, the normalizations of the non-X-ray background, which is caused almost entirely by charged particles, were allowed to be different for the two different dates. All fits were performed using Sherpa 3.0.2. We generated the spectral response files, .rmf and .arf, for the 2000 February observation, for which the detector temperature was -120∘ C, using the CIAO program acisspec. For the 2000 January observation, when the temperature was -110∘ C, we used the same .rmf used for the February observation because the calibration files available from the Chandra website (http://cxc.harvard.edu) for the -110∘ C time period are not current. We also applied the apply_acisabs routine to the .arf files to correct for the degradation in the ACIS quantum efficiency over time (http://cxc.harvard.edu/cal/Acis/Cal_prods/qeDeg/).
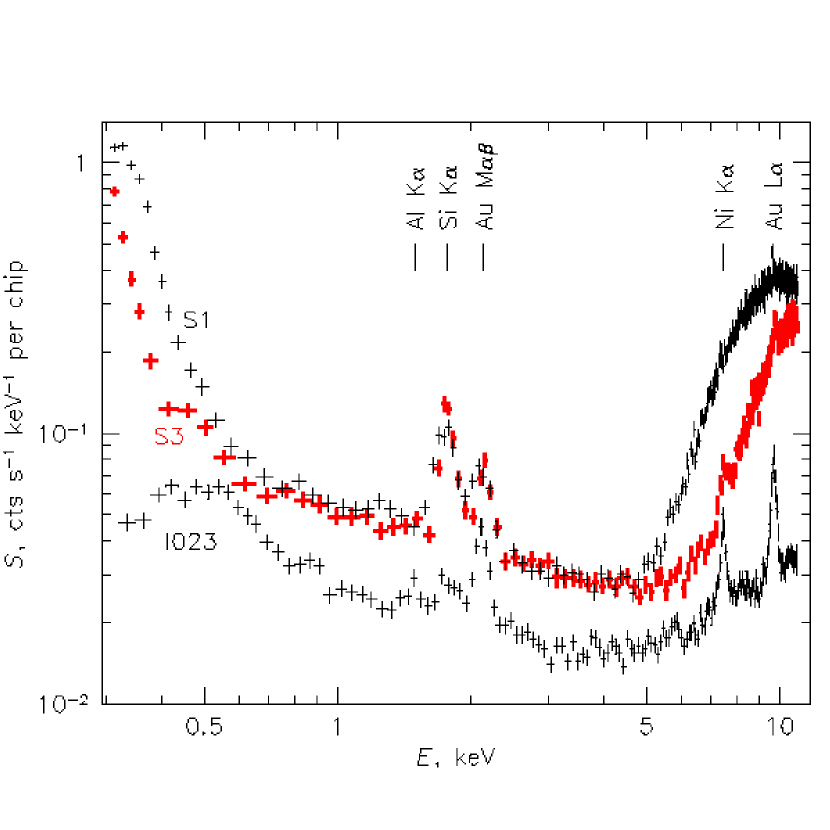
We used the off-galaxy portion of our data to determine the background for the spectral analysis of the on-galaxy data. The off-galaxy background is made up of several components: local bubble emission, Galactic halo emission, hot intergalactic medium (IGM), unresolved AGNs, and the non-X-ray instrument background. The hot IGM contributes only about 10% of the total background flux (Phillips, Ostriker, & Cen, 2001) so we did not include it as a separate component in our model for the background. The X-ray background has been studied in previous X-ray missions, which provide the basis for the model parameters we used to fit the X-ray background of our observations. We adopted the temperatures found by Sanders et al. (2002) from a simultaneous fit to high latitude the X-ray background measured by ROSAT (Snowden et al., 1997) and the Wisconsin all-sky survey (McCammon et al., 1983): kT of 0.086 keV for the local bubble and 0.22 keV for the Galactic halo. All thermal models used in our fits are the Astrophysical Plasma Emission Code (APEC, http://hea-www.harvard.edu/APEC) model. To model the unresolved background AGNs we used a power-law with a fixed index of 1.4 (McCammon & Sanders, 1990). Both the Galactic halo model and the unresolved AGN model used ISM absorption (Morrison & McCammon, 1983) equal to that along the line of sight to NGC 3184 from Table 1. To determine the form of the non-X-ray background spectrum, we used the spectrum from the Chandra Proposers’ Observatory Guide (http://cxc.harvard.edu/proposer/POG/index.html) shown in Figure 8. This non-X-ray background, caused by charged particles interacting with the Chandra satellite, does not pass through the telescope in the same way X-ray emission does. To properly treat the non-X-ray background model, we used the noise command in Sherpa so that it was not convolved through the telescope response function, only the detector response is applied. The non-X-ray background was approximated using two Gaussians and a broken power-law. The Gaussians were used to fit the fluorescent emission lines, Si-Kα at 1.74 keV and Au-M at 2.12 keV, caused by charged particles interacting with the instrument. For the broken power-law we adopted a break energy of 0.7 keV, a low energy index of 1.47 and a high energy index of 0.4. In our spectral fits only the four normalization parameters were allowed to float, those of the two thermal models and of the two power-law models. The spectral fit parameters are given in the first section of Table 2.
After obtaining the best fit values for parameters of the background model, we used those values to calculate the counts s-1 arcsec-2 of the X-ray background to compare with the image data of Figure 2. The value for the solid line on the right hand side of Figure 2 was determined solely from the spectral fit parameters found above. As expected, the spectral fitting result agrees with the image data. As another consistency check, we compared the predictions of our model parameters with the ROSAT data from around NGC 3184. Using the X-ray background tool from the HEASARC website (http://heasarc.gsfc.nasa.gov/cgi-bin/Tools/xraybg/xraybg.pl), we obtained the average ROSAT count rates in the R4, R5, R6 and R7 bands over a 5∘ radius field of view centered on NGC 3184 that excluded the inner 1∘ radius circle. Our best fit model predictions agreed with the ROSAT data to within 10% in the 0.44-2 keV range. Our observations of the X-ray background are also consistent with the observed range of diffuse background surface brightness measured with sounding rockets (McCammon & Sanders, 1990), when allowances are made for the different thresholds in the removal of the resolved point sources from the AGN contribution.
3.3 Fitting Emission from NGC 3184
The unresolved emission from NGC 3184 consists of two components, unresolved point sources and truly diffuse emission. The unresolved point sources are composed of stars and the low luminosity end of the low-mass X-ray binary (LMXB) population. Assuming that the stellar densities, X-ray luminosities and scale heights for X-ray emitting stars given by Kuntz & Snowden (2001) for the Milky Way apply also to NGC 3184, we estimate that the unresolved emission from stars is 4% of the total unresolved emission. The luminosities presented in Kuntz & Snowden (2001) were calculated from ROSAT observations in the 0.1-2.4 keV range. This energy range is larger than the 0.36-1.3 keV range we use and results in 4% being an upper limit on the contribution of stellar emission. A similar approach was taken by Kuntz et al. (2003) to find the stellar contribution to the X-ray flux of M101 measured by Chandra to be 10%. For the spectrum of the unresolved LMXBs, we used the spectral form of the resolved point sources, but allowed the normalization to float. To determine the spectrum of the resolved point sources we extracted the spectrum from each source and co-added them to form a single spectrum. This single combined spectrum of the resolved point sources is best fit by an absorbed power-law with an index 1.8 and absorption of cm-2. This model results in the same luminosity for the unresolved point source emission as extrapolating the Log N - Log L plot of resolved point sources down to ergs s-1. For the truly diffuse emission we tried both one and two component models and found a significantly better fit using the two thermal component model.
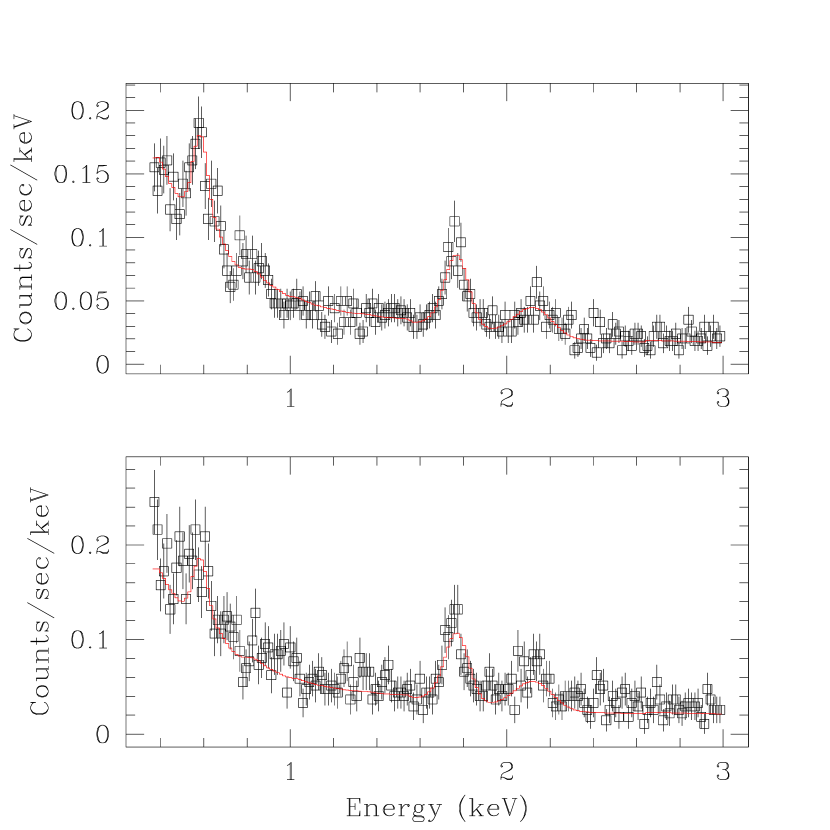
We then fit all of the on-galaxy data, varying only the normalization of the point source power-law and the normalizations and temperatures of the diffuse thermal components. The off-galaxy background spectral model was included as the on-galaxy background spectrum. We found a best fit ( = 267 with 355 degrees of freedom) with kTs of 0.125 and 0.43 keV, and other parameter values given in the second section of Table 2. The best-fit spectral model is shown in Figure 9 superimposed on the two data sets. The error bars on the temperatures were taken from the one sigma contour of the two temperature parameter space, shown in Figure 10 . The two-temperature model for the diffuse X-ray emission in NGC 3184 is similar to that found by Kuntz et al. (2003) in M101, Strickland et al. (2002) in NGC 253, and Fraternali et al. (2002) in NGC 2403. In subsequent fits to the individual regions of NGC 3184, i.e. spiral arms, off-spiral arms, bright H regions, and non-H regions, the temperatures of the diffuse emission were frozen to the values obtained from the fit to the whole galaxy due to lack of signal in the individual regions. The results of these fits are given in the latter sections of Table 2.
4 Results
Using the results of the spectral fitting in the previous section, we determined the surface brightnesses for these same regions of the galaxy, as shown in Table 3. We calculated the range of surface brightnesses for each component using the model surface brightnesses obtained from within the one sigma surface of the parameter space of those parameters allowed to vary. For the all-galaxy spectral fits, the free parameter space consists of five dimensions. The projection of the volume within the one-sigma surface onto the temperature-temperature plane is shown in Figure 10. For the spiral arm, off-arm, H, and non-H spectral fits the parameter space only involved three dimensions as the two temperatures were fixed. The resulting ranges in the surface brightnesses are shown in Table 3. We consider these surface brightnesses to be the primary results of this investigation.
The surface brightness of the combined thermal emission of NGC 3184 in the 0.36 - 1.3 keV band is ergs s-1 cm-2 arcsec-2, which results in a luminosity of ergs s-1 using the distance in Table 1 and the solid angle in Table 3. The surface brightness of the point sources is ergs s-1 cm-2 arcsec-2. The point source contribution is relatively uniform across the galaxy, as can be seen in Table 3, where each of the power-law surface brightnesses of the four sub-regions of NGC 3184 is consistent with the all-NGC 3184 power-law surface brightness. This is the expected distribution throughout the galaxy of the relatively old LMXB population. The diffuse gas, however, is clearly not uniformly distributed across the galaxy. From Figure 1, the total unresolved emission appears to be correlated with the galaxy’s spiral arms, and since the LMXBs are uniformly distributed, the truly diffuse emission must not be. From Table 3, the average X-ray surface brightness of the combined thermal emission over the optically-defined spiral arms is ergs s-1 cm-2 arcsec-2, more than twice the average surface brightness of the whole galaxy and a factor of 5 more than the X-ray surface brightness of the “off-arm” regions. Clearly the diffuse hot gas tends to be spatially associated with the population of young stars traced by what we call the spiral arms.
The diffuse X-ray emission is not only associated generally with the spiral arms of NGC 3184, but also specifically with the H II regions. The surface brightness of the thermal component of the diffuse X-ray emission coincident with H II regions (see Figure 5) is ergs s-1 cm-2 arcsec-2, a factor of 7 higher than the X-ray emission not associated with H II regions, as shown in Table 3. Our results are consistent with the picture that the diffuse X-ray emission is broadly correlated with star-forming regions.
5 Discussion
How does the emission we observe in NGC 3184 compare to that which we observe in the Milky Way? We can interpret the X-ray background in our NGC 3184 data as a first approximation of the Milky Way X-ray emission. Seen externally, there are three components to the diffuse X-ray signal coming from the solar neighborhood: (1) a Galactic halo component equal to what we observed in the background fits toward NGC 3184, except with no absorption, (2) a local bubble component twice as bright as what we saw, but with an absorption equal to that of our Galaxy at high latitudes, and (3) a second Galactic halo component (from the far side of our Galaxy) with absorption equal to twice what we see at high latitudes. This picture, using our emission measures from Table 2, implies that we would measure a surface brightness from the vicinity of the Sun of ergs s-1 cm-2 arcsec-2 in the 0.36-1.3 keV energy range. The surface brightness of the local bubble component would be ergs s-1 cm-2 arcsec-2 while the two halo components add up to ergs s-1 cm-2 arcsec-2. This surface brightness estimate for the total emission is comparable to the average surface brightness for all of NGC 3184 (see Table 3), although it is only half of the average spiral arm surface brightness measured in NGC 3184. Thus, NGC 3184 appears to have diffuse X-ray emission similar to what we see in the limited region of our Galaxy that we can directly observe.
In NGC 3184 we see a correlation between regions of diffuse X-ray emission and the spiral arms and H II regions. Over the course of their short lifetimes massive stars deposit a tremendous amount of mechanical energy into the surrounding interstellar medium, first in the form of strong stellar winds and, subsequently, in the form of supernovae explosions. The energy injected into the ISM by massive stars resides in both the thermal energy of the hot interior of the bubble and in the kinetic energy of the expanding shell (McCray & Kafatos, 1987; Mac Low & McCray, 1988). An individual massive star will deposit erg of mechanical energy into the ISM in both a stellar wind and a supernova explosion. This is sufficient to heat the interior of the bubble to X-ray emitting temperatures (Mac Low & McCray, 1988). We therefore expect to find a strong spatial correlation between the distribution of massive stars and the distribution of bubbles of diffuse hot gas in galaxies. For example, Dunne, Points, & Chu (2001) showed clearly that diffuse X-ray emission in the Large Magellanic Cloud is associated with well-known regions of massive star formation.
That the diffuse X-ray emission in NGC 3184 is associated with discrete H II regions suggests that the X-ray emission arises from superbubbles associated with regions of star formation. In our Galaxy there are two nearby superbubbles centered on OB associations: Orion-Eridanus and Scorpius-Centaurus (Sco-Cen). The Sco-Cen superbubble has a bright ridge, the North Polar Spur (Egger & Aschenbach, 1995), so for this discussion we considered separately the North Polar Spur and the interior of the Sco-Cen superbubble. Observed parameters of these regions are given in Table 4. Using these observed parameters in a thermal APEC model, we calculated the intrinsic surface brightnesses of these regions, which are given in Table 5 along with the surface brightnesses we determined from NGC 3184. For completeness we also include the surface brightness of the local bubble as twice that seen along the line of sight to NGC 3184.
Both the Orion-Eridanus superbubble and North Polar Spur have higher surface brightnesses than the average NGC 3184 surface brightness, but are comparable to that of the NGC 3184 spiral arms. If the only X-ray emitting gas in NGC 3184 were to come from Orion-Eridanus type objects they could occupy no more than 30% of the projected surface area of NGC 3184 or less than 75% of the spiral arms, otherwise we would have detected more X-ray emission. Similarly, the upper limit on how much of the total NGC 3184 surface could be bubbles with the surface brightness of the North Polar Spur is 50-100%. The surface brightness of the interior of Sco-Cen is lower than, and that of the local bubble is comparable to, the observed emission from NGC 3184. If the entire galaxy were filled with either type of these bubbles we would not be able to account for the diffuse X-ray emission seen from NGC 3184. Thus, the diffuse X-ray emission in NGC 3184 most likely arises from a mixture of structures similar to those seen in the Milky Way.
A potential concern when comparing NGC 3184 and the Milky Way is that the brightest regions we observe in NGC 3184 are significantly brighter than the brightest regions of diffuse thermal X-ray emission in our Galaxy. It is possible that this is a result of our location in the Milky Way. We can only study a small number of nearby superbubbles because of the inherent difficulty of studying the X-ray emission within our disk. It is possible that the Milky Way contains similarly bright regions to those of NGC 3184, but that we cannot observe them. Another concern is why we don’t see in our observations of NGC 3184 specific diffuse X-ray features of surface brightness comparable to that of the nearby superbubbles in our Galaxy. This is most likely a result of Chandra’s sensitivity and our short observation time. To produce one count in our 0.36-1.3 keV Chandra observations requires a source luminosity of ergs s-1. To achieve a luminosity sufficient to generate one count in our data, a superbubble with the temperature and emission measure of the Orion-Eridanus bubble would need to encompass 73 pixels (a 24 radius circle). Fainter bubbles would need to be correspondingly larger: the interior of Sco-Cen would have to comprise a 87 radius circle. One count, as generated by regions of these surface brightnesses, would not be apparent in our observations because it would be spread out across such a large detector area that it would be indistinguishable from the noise.
The two temperatures that we observe from NGC 3184 straddle those found in the superbubbles in our own galaxy. The lower temperature component has a temperature, K, which is warmer than our own local bubble, but cooler than the other superbubbles that we see in our own Galaxy. The high temperature component, K, is hotter than the nearby superbubbles in our Galaxy. This reinforces our conclusion that the diffuse emission seen from NGC 3184 is a mixture of the types of bubbles of our own Galaxy. In the LMC, where individual superbubbles have been detected and analyzed, temperatures in the range of K are found. The diffuse X-ray emission from M101, NGC 2403 and NGC 253 all have a similar lower temperature to the one we find in NGC 3184, and high temperature components, T K (Kuntz et al., 2003; Strickland et al., 2002; Fraternali et al., 2002), consistent within the upper limit of our measurement, although somewhat higher. This is perhaps expected because these three galaxies all have significantly higher 21 cm continuum flux than NGC 3184. Continuum synchrotron radiation is an indicator of recent supernovae activity. It is not unexpected that galaxies that have more recent star formation have hotter gas that has not had time to cool.
In summary, we have detected diffuse X-ray emission arising from the face-on spiral SABcd galaxy NGC 3184. The power-law X-ray emission, which is expected to come from unresolved LMXBs that have much longer lifetimes than massive stars, is uniform across NGC 3184. By contrast the diffuse thermal emission, while observed throughout NGC 3184, is strongly correlated with both the spiral arms and H-emitting regions. The diffuse thermal X-ray emission must be associated with massive stars and star formation. We conclude that because the supperbubbles seen in NGC 3184 have surface brightnesses and temperatures similar to what we observe in our Galaxy, the diffuse thermal emission in NGC 3184 comes from a mixture of objects like we see in our Galaxy. The diffuse thermal emission across NGC 3184 is pervasive and has an average surface brightness approximately equal to that seen in our local neighborhood. This suggests that the filling factor of hot gas in NGC 3184, and possibly the Milky Way, may be greater than the previously estimated 10%.
6 Acknowledgments
We thank Andrew Glenn and Massimiliano Galeazzi for fruitful discussions and the referee for useful comments. We gratefully acknowledge support from the National Science Foundation through grant AST 00-98438, Chandra awards GO0-1022X and GO3-4113X, and funding from NASA contract NASB-39073 to the Chandra X-ray Center.
References
- Aschenbach (1988) Aschenbach, B. 1988, Appl. Opt., 27, No. 8, 1404
- Berghofer, Schmitt, & Cassinelli (1996) Berghofer, T. W., Schmitt, J. H. M. M., & Cassinelli, J. 1996, A&ASS, 118, 481
- Bochkarev (1987) Bochkarev, N. G. 1987, Ap&SS, 138, 229B
- Boulares & Cox (1990) Boulares, A., & Cox, D. P. 1990, ApJ 365, 544
- Bregman & Irwin (2002) Bregman, J. N., & Irwin, J. A. 2002, ApJ, 565L, 13
- Cox & Reynolds (1987) Cox, D. P., & Reynolds, R. J. 1987, ARA&A, 25, 303
- Cui et al. (1996) Cui, W., Sanders, W. T., McCammon, D., Snowden, S. L., & Womble, D. S. 1996, ApJ, 468, 102
- Dunne, Points, & Chu (2001) Dunne, B. C., Points, S. D., & Chu, Y.-H. 2001, ApJS, 136, 119
- Egger & Aschenbach (1995) Egger, R. J., & Aschenbach, B. 1995, A&A, 294, L25
- Ferriere (1998) Ferriere, K. 1998, ApJ 503, 700
- Fraternali et al. (2002) Fraternali, F., Cappi, M., Sancisi, R., & Oosterloo, T. 2002, ApJ, 578,109
- Freeman et al. (2002) Freeman, P. E., Kashyap, V., Rosner, R., & Lamb, D. Q. 2002, ApJS, 138, 185
- Frisch (1995) Frisch, P. C. 1995, SSRv, 72, 499
- Guo et al. (1995) Guo, Z., Burrows, D. N., Sanders, W. T., Snowden, S. L., & Penprase, B. E. 1995, ApJ, 453, 256
- Irwin, Athey & Bregman (2003) Irwin, J. A., Athey, A. E., Bregman, J. N. 2003, ApJ, 587, 356
- Iwan (1980) Iwan, D. 1980, ApJ, 239, 316
- Kerr (1993) Kerr, F. J. 1993, in AIP Conf. Proc. 278, Back to the Galaxy, ed. S. S. Holt & F. Verter (New York: AIP), 3
- Kilgard et al. (2002) Kilgard, R. E., Kaaret, P., Krauss, M. I., Prestwich, A. H., Raley, M. T., & Zezas, A. 2002, ApJ, 573, 138
- Kondo, Bruhweiler, & Savage (1984) Kondo, Y., Bruhweiler, F. C., Savage, B. D. 1984, Local Interstellar Medium, IAU 81
- Kuntz & Snowden (2001) Kuntz, K. D., & Snowden, S. L. 2001, ApJ, 554, 684
- Kuntz et al. (2003) Kuntz, K. D., Snowden, S. L., Pence, W. D., & Mukai, K. 2003, ApJ, 588, 264
- Leonard et al. (2002) Leonard, D. C., Filippenko, A. V., Li, W., Matheson, T., Kirshner, R. P., Chornock, R., Van Dyk, S. D., Berlind, P., Calkins, M. L., Challis, P. M., Garnavich, P. M., Jha, S., & Mahdavi, A. 2002, ApJ, 124, 2490
- McCammon et al. (1983) McCammon, D., Burrows, D. N., Sanders, W. T., & Krausharr, W. L. 1983, ApJ, 269, 107
- McCammon & Sanders (1984) McCammon, D., & Sanders, W. T. 1984, ApJ, 287, 167
- McCammon & Sanders (1990) McCammon, D., & Sanders, W. T. 1990, ARA&A, 28, 657
- McCammon et al. (2002) McCammon, D., Almy, R., Apodaca, E., Bergmann T. W., Cui, W., Deiker, S., Galeazzi, M., Juda, M., Lesser, A., Mihara, T., Morgenthaler, J. P., Sanders, W. T., Zhang, J., Figueroa-Feliciano, E., Kelly, R. L., Moseley, S. H., Mushotzky, R. F., Porter, F. S., Stahle, C. K., & Szymkowiak, A. E. 2002, ApJ, 576, 188
- Mac Low & McCray (1988) Mac Low, M-M., & McCray, R. 1988, ApJ, 324, 776
- McCray & Kafatos (1987) McCray, R. & Kafatos, M. 1987, ApJ, 317, 190
- Morrison & McCammon (1983) Morrison, R., & McCammon, D. 1983, ApJ, 270, 119
- Mushotzky et al. (2000) Mushotzky, R. F., Cowie, L. L., Barger, A. J., & Arnaud, K. A. 2000, Nature, 404, 459
- Larsen & Richtler (2000) Larsen, S. S., & Richtler, T. 2000, A&A, 354, 836
- Pence et al. (2001) Pence, W. D., Snowden, S. L., Mukai, K., & Kuntz, K. D. 2001, ApJ, 561, 189
- Phillips, Ostriker, & Cen (2001) Phillips, L. A., Ostriker, J. P., & Cen, R. 2001, ApJ, 554, L9
- Plucinsky & Virani (2000) Plucinsky, P. P., & Virani, S. N. 2000, Proc. SPIE, 4012, 681
- Raymond & Smith (1977) Raymond, J. C., & Smith, B. W. 1977, ApJS, 35, 419
- Sanders et al. (1977) Sanders, W. T., Kraushaar, W. L., Nousek, J. A., Fried, P. M. 1977, ApJ, 217, L87
- Sanders et al. (2002) Sanders, W. T., Lieu, D., McCammon, D., Rocks, L., Vaillancourt, J. E., Galeazzi, M., Figueroa-Feliciano, E., Kelley, R. L., Mushotzky, R. F., Porter, F. S., Stahle, C. K., & Szymkowiak, A. E. 2002, BAAS, 34, 1178
- Schlegel (2001) Schlegel, E. M. 2001, ApJ, 556, L25
- Sfeir et al. (1999) Sfeir, D. M., Lallement, R., Crifo, F., & Welsh, B., Y. 1999, A&A, 346, 785
- Slavin (1989) Slavin, J. D. 1989, ApJ, 346, 718
- Slavin & Cox (1992) Slavin, J. D., & Cox, D. P. 1992, ApJ, 392, 131
- Slavin & Cox (1993) Slavin, J. D., & Cox, D. P. 1993, ApJ, 417, 187
- Smith & Cox (2001) Smith, R. K., & Cox D. P. 2001, ApJS 134, 283
- Snowden et al. (1997) Snowden, S. L., Egger, R., Freyberg, M. J., McCammon, D. Plucinsky, P. P., Sanders, W. T., Schmitt, J. H. M. M., Trümper, J., & Voges, W. 1997, ApJ, 485, 125
- Strickland et al. (2002) Strickland, D. K., Heckman, T. M., Weaver, K. A., Hoopes, C. G., & Dahlem, M. 2002, ApJ, 568, 689
- Swartz et al. (2003) Swartz, D. A., Ghosh, K. K., McCollough, M. L., Pannuti, T. G., Tennant, A. F., & Wu, K. 2003, ApJS, 144, 213
- Tinsley (1980) Tinsley, B. M. 1980, Fund. Cosmic Phys., 5, 287
- Wang et al. (2001) Wang, Q. D., Immler, S., Walterbos, R., Lauroesch, J. T., Breitschwerdt, D. 2001, ApJ, 555, L99
| Table 1: NGC 3184 Particulars | ||||
|---|---|---|---|---|
| NGC 3184 | Milky Way | |||
| Parameter | Value | Source | Value | Source |
| Distance(Mpc) | 11.6 (56 pc arcsec-1) | Leonard et al. (2002) | … | … |
| Position(J2000.0) | = 10h18m17s, = 41∘25′28′′ | … | … | … |
| Galactic Coordinates | l = 178.33, b = +55.64∘ | … | … | … |
| Foreground NH(cm-2) | 1.13 | … | … | … |
| Maj/Min diameter | 7′.4/6′.9 | … | … | … |
| Hubble type | SAB(rs)cd | … | Sb-Sbc | Kerr (1993) |
| Star-formation rate(M⊙ yr-1 kpc-2) | 10-2.76 | Larsen & Richtler (2000) | 10-2.40 | Tinsley (1980) |
| Table 2: Fit Parameters for NGC 3184 in the 0.36-3.0 keV range | ||
| Parameters | Best Fit | /dof |
| Background | ||
| Non-X-ray broken power-law indices …………………………. | fixed at 1.5 & 0.4 | 248/358 |
| Non-X-ray broken power-law break energya ……………….. | fixed at 0.7 | |
| Non-X-ray broken power-law normalization (obsID 804)b | 5700 | |
| Non-X-ray broken power-law normalization (obsID 1520) | 7300 | |
| AGN power-law index ……………………………………………… | fixed at 1.4 | |
| AGN power-law normalizationc …………………………………. | 5.8 | |
| AGN power-law absorptiond ……………………………………… | fixed at 1.13 | |
| Thermal plasma (APEC) high temperaturea ………………. | fixed at 0.22 | |
| Thermal plasma high temperature emission measuree ….. | 0.0022 | |
| Thermal plasma high temperature absorption …………….. | fixed at 1.13 | |
| Thermal plasma low temperature ………………………………. | fixed at 0.086 | |
| Thermal plasma low temperature emission measure …….. | 0.027 | |
| Thermal plasma low temperature absorption ………………. | fixed at 0 | |
| All NGC 3184 | ||
| Point-source power-law index ……………………………………. | fixed at 1.8 | 267/355 |
| Point-source power-law normalization ………………………… | 11 | |
| Point-source power-law absorption …………………………….. | fixed at 8.3 | |
| Thermal plasma low temperature ………………………………. | 0.125 | |
| Thermal plasma low temperature emission measure ……… | 0.016 | |
| Thermal plasma high temperature ……………………………… | 0.43 | |
| Thermal plasma high temperature emission measure ……. | 0.0016 | |
| Thermal plasma absorption ………………………………………. | fixed at 1.13 | |
| Spiral Arms | ||
| Power-law normalization ………………………………………….. | 5.9 | 170/357 |
| Thermal plasma low temperature emission measure ……… | 0.035 | |
| Thermal plasma high temperature emission measure ……. | 0.0069 | |
| Off-Spiral Arms | ||
| Power-law normalization ………………………………………….. | 10 | 216/357 |
| Thermal plasma low temperature emission measure ……… | 0.0097 | |
| Thermal plasma high temperature emission measure ……. | 0.00029 | |
| Bright H | ||
| Power-law normalization ………………………………………….. | 0 | 40.4/357 |
| Thermal plasma low temperature emission measure …….. | 0.093 | |
| Thermal plasma high temperature emission measure ……. | 0.015 | |
| Non-H | ||
| Power-law normalization …………………………………………. | 11 | 267/357 |
| Thermal plasma low temperature emission measure …….. | 0.014 | |
| Thermal plasma high temperature emission measure …… | 0.0013 | |
a) keV
b) effective detector counts s-1 keV-1 sr-1
c) photons s-1 cm-2 keV-1 sr-1 at 1 keV
d) 1020 cm-2
e) cm-6 pc
| Table 3: Surface Brightnessesa of NGC 3184 field in 0.36-1.3 keV | ||||||
| Solid Angleb | Diffuse Thermal Emission | Power-Lawc | Total | |||
| Region | 0.125 keV | 0.43 keV | Total | |||
| X-ray Background | 110000 | 4.7 | 2.4 | 7.1 | ||
| All NGC 3184 | 114000 | 5.6 | 1.6 | 7.2 | 5.3 | 13. |
| Spiral Arm | 27800 | 12. | 6.8 | 19. | 2.8 | 22. |
| Off-Arm | 86700 | 3.4 | 0.3 | 3.7 | 4.9 | 8.6 |
| H | 2190 | 33. | 15. | 48. | 0.0 | 48. |
| Non-H | 112000 | 5.0 | 1.3 | 6.3 | 5.2 | 12 |
a) 10-19 ergs s-1 cm-2 arcsec-2
b) arcsec2, excluding the ellipses surrounding the resolved point sources
c) represents the AGN contribution for the background and the LMXB contribution for the galactic emission
| Table 4: Nearby Regions | ||||
| ne | Extenta | Emission Measure | T | |
| Superbubble | (cm-3) | (pc) | (cm-6pc) | (106 K) |
| Orion-Eridanus | 0.015b | 140b | 0.032 | 3.3b |
| North Polar Spur | 0.01-0.02c | 60c | 0.01-0.02c | 3c |
| Sco-Cen interior | 0.0025 | 320d | 2.0 x 10⁻³ | 4.6d |
a) distance through the emitting volume
b) Guo et al. (1995)
c) Iwan (1980)
d) Egger & Aschenbach (1995)
| Table 5: Surface Brightnesses in 0.36-1.3 keV band | |
|---|---|
| Surface | |
| Region | Brightnessa |
| Orion-Eridanus | 26. |
| North Polar Spur | 8.0-16. |
| Sco-Cen interior | 1.9 |
| Local Bubble | 5.3 |
| Milky Way Halob | 3.12 |
| All NGC 3184 | 7.2 |
| Spiral Arms in NGC 3184 | 19. |
| Off-Spiral Arms in NGC 3184 | 3.7 |
| Bright H in NGC 3184 | 48. |
| Non-H in NGC 3184 | 6.3 |
a) 10-19 ergs s-1 cm-2 arcsec-1
b) seen from outside the Milky Way, as described in §5
Figure Captions
Chandra observations of NGC 3184 in the 0.36-1.3 keV range. The data were smoothed with a six-pixel Gaussian filter and are displayed on a linear grey-scale with white values indicating less than 0.04 counts arcsec-2 and the black regions greater than 0.12 counts arcsec-2. The green ellipses indicate the locations and the ellipse size represents the count distribution of the removed point sources. The red circle indicates the radial extent of the galaxy as determined from the X-ray data, while the spiral arms used in the reduction, determined from the B band data, are outlined in blue.

The WIYN B-band image of NGC 3184. The green ellipses indicate the location and distribution of the X-ray point sources found using wavdetect in the 0.3-8.0 keV band. The red circle indicates the radial extent of the galaxy as determined from the X-ray data, which is consistent with the surface brightness fall-off found in the B band. The area outlined in blue is the spiral arms region used in the reduction, which were determined from the B band data. The horizontal strip is a result of a gap between the two CCD chips in the Mini-Mosaic camera.
The WIYN H continuum-subtracted image of NGC 3184. The green polygons mark regions of high H emission. The red circle indicates the radial extent of the galaxy as determined from the X-ray data, while the spiral arms used in the reduction, determined from the B band data, are outlined in blue. The horizontal strip is a result of a gap between the two CCD chips in the Mini-Mosaic camera.

Expanded B band image of NGC 3184 with the position of SN 1999gi indicated by the cross-hairs.