WHIM emission and the cluster soft excess: a model comparison
Abstract
The confirmation of the cluster soft excess (CSE) by XMM-Newton has rekindled interest as to its origin. The recent detections of CSE emission at large cluster radii together with reports of O VII line emission associated with the CSE has led many authors to conjecture that the CSE is, in fact, a signature of the warm-hot intergalactic medium (WHIM). In this paper we test the scenario by comparing the observed properties of the CSE with predictions based on models of the WHIM. We find that emission from the WHIM in current models is 3 to 4 orders of magnitude too faint to explain the CSE. We discuss different possibilities for this discrepancy including issues of simulation resolution and scale, and the role of small density enhancements or galaxy groups. Our final conclusion is that the WHIM alone is unlikely to be able to accout for the observed flux of the CSE.
1 Introduction
The location of all the baryons existing at the current epoch is still somewhat of a mystery. Observationally, the total sum of baryons seen in stars, galaxies and clusters of galaxies (%, Fukugita, Hogan & Peebles 1998) is only about half of the number of baryons required by big bang nucleosynthesis models (% Burles & Tytler 1998) or from measurements of the cosmic microwave background (% Bennett et al. 2003). Recent cosmological hydrodynamical simulations have, however, shown that this missing 50% of baryons may be in the form of a warm (K), tenuous medium (with overdensities between ) existing in filaments formed during the process of large scale structure formation (e.g. Cen & Ostriker 1999). This medium is generally called the ’warm-hot intergalactic medium’ or WHIM.
Ever since it was first proposed, the detection of the WHIM has been an important goal in astrophysics. To date there has been a considerable amount of success in finding WHIM like material, particularly from absorption line studies. Far UV and soft X-ray absorption lines from the WHIM have been reported for both the local group as well as at higher redshifts e.g. Fang, Sembach & Canizares 2003; Nicastro et al. 2003; Mathur et al. 2003, Tripp, Savage & Jenkins 2002. Possible emission from the the WHIM has also been observed, with some weak X-ray detections (e.g. Soltan, Freyberg & Hasinger 2002; Zappacosta et al. 2002) which are in approximate agreement with the predicted luminosity of the WHIM inferred from cosmological simulations.
Recently, new observations of the cluster soft excess emission (CSE) show that this phenomenon may also be a signature of the WHIM. The CSE (seen as an excess of observed flux above the the hot intracluster medium (ICM) at energies below lkeV) has been an observational puzzle for a number of years. First discovered in the Virgo cluster (Lieu et al. 1996) subsequent observations have found similar behavior in a number of different systems (e.g. Lieu et al. 1996b; Mittaz et al. 1998; Kaastra et al. 1999; Bonamente et al. 2001a; Bonamente et al. 2001b; Bonamente et al. 2002). Observationally the CSE shows a number of different characteristics. In some clusters the CSE when expressed as a percentage is spatially constant (e.g. Coma: Lieu et al. 1998), in others there is a marked radial dependence with the fractional soft excess being stronger in the outer regions of the cluster (e.g. Mittaz et al. 1998). Observations have also shown that the CSE is a relatively common phenomena - a ROSAT study of 38 clusters showed that approximately 45% of clusters show at least a effect (Bonamente et al. 2002) .
On the current state of interpretation, models assuming a thermal origin of the excess have invoked a warm gas intermixed with the hot ICM are unsatisfactory. These have found to be unsatisfactory, however, since the cooling times are extremely short (sometimes years Mittaz et al. 1998) so some kind of heating mechanism to sustain the warm gas has to be envisaged (Fabian 1997). On the other hand if the emission arises from an inverse-Compton process (such as suggested by Hwang 1997; Sarazin & Lieu 1998; Ensslin, Lieu & Biermann 1998) then the radial dependence seen in some clusters can be explained, but the inferred pressure of the required cosmic-rays would be perplexedly too high (Lieu, Axford & Ip 1999).
The picture has changed somewhat with new observations by the XMM-Newton satellite. These observations reveal apparent strong thermal lines of Oxygen in the CSE spectra for the outskirts of a number of clusters (Kaastra et al. 2003; Finoguenov et al. 2003) with the CSE continuum being fitted with a characteristic temperature of 0.2 keV. If established, this provides irrefutable evidence that the CSE must be thermal in nature. Such a finding is also supported by ROSAT observations of the Coma cluster, which shows a very large, degree scale halo of soft emission (Bonamente et al. 2003). Emission on this scale cannot possibly be non-thermal in nature since there is no way of confining a relativistic particle population at such distances from the cluster center. Therefore, given that there seems to be a large scale thermal component at the outskirts of clusters, the CSE emitting material has to be located predominantly beyond the cluster virial radius where we can have sufficiently low densities to overcome any cooling time issues. In such a scenario the warm emitting gas is spatially consistent with the WHIM i.e. current cosmological models should be able to predict the luminosity and temperature of the CSE. We have therefore undertaken a detailed comparison between cosmological simulations of the WHIM and the observed soft excess signal.
2 The model
We have used a recent cosmological hydrodynamic simulation of the canonical cosmological constant dominated cold dark matter model (Ostriker & Steinhardt 1995) with the following parameters: = 0.3, = 0.7, = 0.017, h = 0.67, and a spectral index of the primordial mass power spectrum of n = 1.0. The simulation box has a size of 25 h-1 Mpc comoving on a uniform mesh with 7683 cells and 3843 dark matter particles giving a comoving cell size of 32.6 h-1 kpc. This simulation together with another similar one at lower resolution derived from the same code and parameters have previously been used to account for a variety of of different observational consequences of the WHIM, such as O VI absorption line studies (e.g. Cen, Tripp, Ostriker, Jenkins, 2001) and the X-ray background (Phillips, Ostriker & Cen, 2001). For a more detailed discussion of the simulation itself see Cen, Tripp, Ostriker & Jenkins (2001). Here we are primarily concerned with the emission in the vicinity of a cluster. Thus we focus our analysis on a cluster simulated in the high resolution mode.
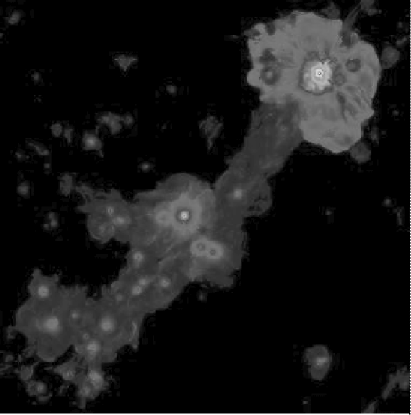
The simulation as provided comes in the form of three data cubes containing temperature, density and metal abundance. Figure 1 shows an emission weighted temperature map from one particular projection of the cube and within the image a number of structures can be seen, including filaments, groups and one cluster candidate at a temperature of 6.5keV. For the purpose of this paper we are going to concentrate on this cluster-like structure which is seen in the top right corner of Figure 1. It has a peak mass density of M⊙ Mpc-2 placing it the regime of virialized objects and so can be considered for our present purposes a cluster of galaxies. The parameters of this simulated cluster are those of a relatively massive cluster and such clusters do show soft excesses. In particular Coma (a very massive cluster) showed one of the first CSEs, and CSEs are found in clusters with a wide range of temperatures and masses. Therefore, there is no reason to suppose that this structure is inappropriate for looking for the signature of a WHIM produced soft excess.
3 Simulated X-ray spectra from the model
The ultimate aim of this paper is to investigate the WHIM model predicted X-ray emitting properties and compare them with current observations, particularly those of the CSE as now observed with XMM-Newton. To do this we have placed the simulation at a redshift of 0.02, similar to that of the Coma cluster whose CSE has been extensively studied (Bonamente et al. 2003; Finoguenov et al. 2003). We further assumed that the gas is in thermal and ionization equilibrium. Since the simulation provides the temperature, density and metal abundance at each point, for each cell we can derive an optically thin X-ray spectrum. To do this we have used the mekal code for optically thin plasmas (Kaastra et al. 1992, Leidhal et al. 1995) to generate the average bremsstrahlung and emission-line spectra. In order to avoid possible extreme abundance values that can sometimes be found in the densest regions of the simulation we do not allow the metal abundance to exceed a value of 0.5 solar. Then after adding the appropriate galactic absorption (N cm-2) and folding the resultant spectrum through the XMM-Newton MOS1 response we can generate an XMM-Newton counts spectrum from each cell. To obtain the overall spectrum we simply sum these spectra along our given line of sight. Finally, in order to get a reasonable estimate of the noise we must taken into account the effect of background subtraction on the determination of the CSE. To do this we have determined what the astrophysical background spectrum is by using the best fit model parameters for the cosmic X-ray background taken from Lumb et al. (2002). The background model includes both Galactic and extra-galactic backgrounds and the normalisations were scaled by the extraction area for each spectrum. Poisson noise was then added to the total spectrum assuming an exposure time of 50 ksec exposure. Then a simulated background spectrum (again with appropriate Poisson noise) was subtracsted from the total spectrum in the same way as would be done with a real observation.
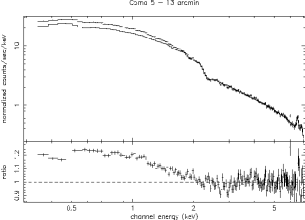
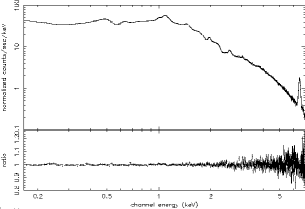
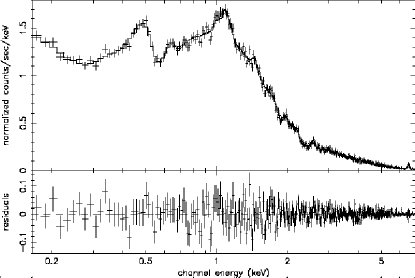
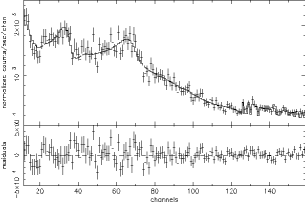
Figure 2 shows an example of a simulation of the central 40 kpc (i.e. one cell which corresponds to 0-2 arcminutes) region of the cluster. Also shown is the best fit performance of the single temperature mekal emission model to the data with parameters of keV and abundance of 0.5. As can be seen from the residual plot, there are no strong deviations of the data from the fit. This is consistent with general properties of clusters inferred from XMM-Newton and Chandra data (e.g. Molendi & Pizzolato 2001) where observationally there is no requirement for a multi-temperature fit, even within the so called cooling radius of the cluster where there is presumed to be a wide range of temperatures along the line of sight. As pointed out by Molendi & Pizzolato (2001) and Ettori (2002) this is to be expected for a single phase medium which further supports our model choice.
For a more in depth understanding, the reason why we see such a good fit to the data even though there are multiple temperatures and densities along the line of sight, is due to the weighting effect of density. Since emission goes as , the spectrum is heavily biased towards the densest material along the line of sight. Therefore the spectrum is dominated by the emission from a narrow range of densities and temperatures. Other components, such as may give rise to a CSE, will not be visible unless they exists in substantial quantities relating to the principle component.
3.1 Looking for the cluster soft excess
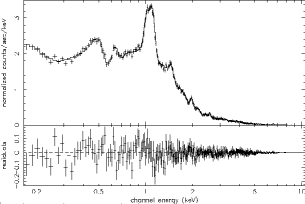
The sufficiency of a single temperature fit to the X-ray spectrum is seen at almost all radii ranging from the center to the outermost regions. This is illustrated in Figure 3 which shows examples from two outer annuli situated at 580-680 kpc and 1.17-1.26 Mpc from the center where the one temperature fits (with kT = keV & kT = keV respectively) are perfectly adequate. In the context of a WHIM explanation of the CSE this is interesting, because if the cluster soft excess is due to overlying filaments from the WHIM it is exactly in these outer regions (where the cluster emission is weak) that we would expect to see an effect. The fact the we see no evidence for a soft excess implies that the emission from the filaments in this simulation must be much weaker than that of the observed CSE.
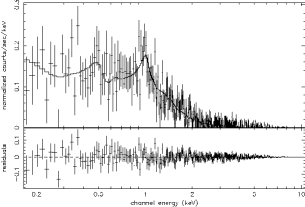
The difference between observations and theory is even more clearly seen in figure 4 which shows two spectra: the spectrum on the left is taken from Nevalainen et al. (2002) and is of the 5-13 arcminute region of the Coma cluster, the spectrum on the right is taken from the simulation covering a similar annular region. The first point to note is the relatively good agreement in the flux levels - the 0.2 - 2keV luminosity from the simulation is ergs/s while the real observations shows a luminosity of ergs/s, giving us confidence that the cross normalizations are realistic. However, there are also significant differences. Below 2 keV the XMM-Newton observation of Coma shows a clear soft excess at a 25% level above the hot ICM emission, whereas the simulated spectrum show no soft excess emission. We therefore conclude that the model does not include material at the right temperature and density to account for the thermal origin of the CSE.
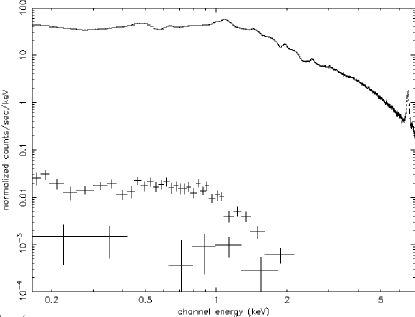
Such a conclusion is further underpinned when the emissivity of material at a temperature consistent with the CSE is studied. Figure 5 shows the same simulated spectrum as the one in figure 4 but with the addition of spectra derived only from those cells with temperatures below 1 keV i.e. just those cells from which we would expect the cluster soft excess emission to arise. The two lower spectra in figure 5 show the expected emission from all components below 1 keV as taken from two different lines of sight. The lower spectrum is derived from the same sight line used to create the total spectrum (i.e. the top spectrum). The brighter of the two spectra is taken from a sight line that has the most CSE effect, because along it the emission from cells with a temperature less the 1 keV is maximized i.e a line of sight that maximizes the CSE. Note in both cases there is emission in the crucial keV regime only it is much fainter (by a factors of or respectively) than the hot ICM emission. It then becomes obvious why no cluster soft excess was seen in the simulated spectra: the emission from cells capable of accounting for the soft excess is very small compared with the soft flux from the hot ICM emission lying behind it. We can further quantify this effect by comparing our model prediction with the soft excess emission seen in a large sample of clusters. Bonamente et al. (2002) studied 38 clusters and listed the strength of any soft excess detected with ROSAT . The simulated CSE luminosities fall short of the values for the majority of these cases.
3.2 A possible detection of a soft excess and the importance of small groups
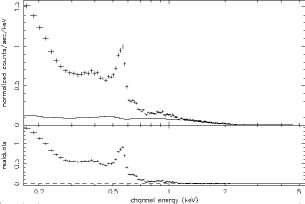
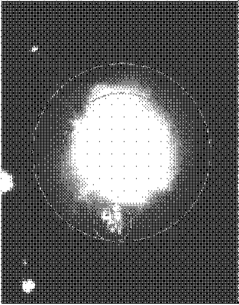
Under certain circumstances it is possible to emulate a soft excess. For example from an extraction from the 30 - 45 cell (978 - 1467 kpc) annular region one notices a strong excess at the lowest energies. The left panel of Figure 6 shows the simulated spectrum, and in this case a single temperature fit is unacceptable with a of 42.5. Following the analysis techniques of Nevalainen et al. (2002) and Bonamente et al. (2003) of applying a one temperature model to the spectrum above keV we find a reasonable fit with a single temperature of keV (). Below 1 keV there is then a very strong soft excess including a very strong O VII line. Interestingly the temperature of this excess is 0.2 keV, exactly the same temperature as has been reported for a number of clusters (eg. Kaastra et al. 2003). However, it turns out that this excess arises from a very small number of cells within the extraction region. In Figure 7 an image of the outskirts of the simulated cluster together with the annulus used to extract the original spectrum. Also shown is a small circle on the left hand side containing the region of bright pixels i.e. high densities, that actually gives rise to the soft excess. If this small region is removed, the resultant spectrum (the right hand panel of Figure 6) yields no evidence of a CSE.
We therefore conclude that there is very little evidence to link emission from the WHIM with the cluster soft excess. Our investigation has revealed the possibility, however, that small density enhancements (which may be associated with small galaxy groups) can give a signal that mimics the cluster soft excess. However, in the real observations the cluster soft excess seems relatively smooth and does not seem to be confined to a few small locations (see for example the ROSAT results on the Coma cluster Bonamente et al. 2003). One possibility is that the models to date do not have sufficient spatial resolution to emulate a large population of small density perturbations which could give rise to the observed soft excess signal. Additional physics related to a more complex environment, such as would exist in a supercluster, may also be required to achieve this - Kaastra et al. (2003) discussed the possibility, which clearly awaits further work. An overall fundamental problem exists, though, and it pertains to the acute lack of mass in gas at any temperature range to account for the soft excess. To get the required factor of increase in brightness from the WHIM would imply an increase in the density by a factor of 30. Since the majority of the WHIM has overdensities between 10-30 we then require overdensities greater than 300. However, only % of the WHIM bave overdensities greater than 200 (e.g. Davé et al. 2001) and it is clear that the models simply do not contain material at the densities and temperatures to give rise to the CSE signal as observed.
4 The importance of superclustering and the CSE
Another possible explanation for the CSE emission has been raised by Kaastra et al. (2003,2004) who have proposed a correlation between the cluster soft excess and a supercluster environment. They arrive at this conclusion based on two arguments. ROSAT all-sky survey maps on degree scales around soft excess clusters seem to show a large scale excess of soft emission which is claimed to be related to a supercluster. The authors also claimed that in the model of Fang et al. (2002), regions where there are numerous structures (i.e. a potential simulated supercluster) can also be associated with a O VII column density similar to that inferred from observations ( cm-2) thereby implying a causal link between superclusters and the presence of a CSE.
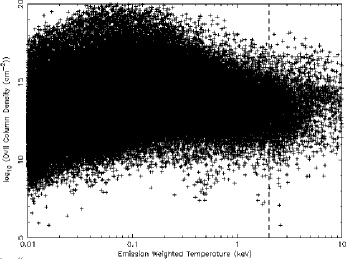
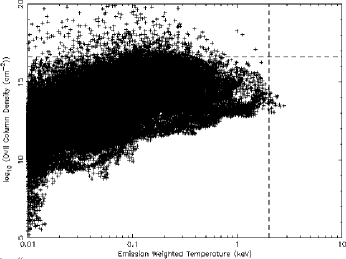
The first possibility, that of large scale soft emission, has already been demonstrated as being inconsistent with the models since the density of the WHIM and hence the emissivity is too low. We investigated the second argument using both the small and large scale simulations of Cen and Ostriker (scale 25 and 100 Mpc respectively) and have calculated the O VII column densities projected along the line of sight. In both cases we then compared the emission weighted temperature with the O VII column density to see where and how often the O VII is consistent with the strength of the line emission reported by Kaastra et al. The two models are shown in figure 8, and indicate that at locations where the projected emission weighted temperature is greater than 2 keV (which corresponds to locations where a cluster would exist) very few cells have the required O VII column. Indeed, for the smaller of the two models (the model with the higher resolution) there were no areas with an O VII column cm-2 (the density required by Kaastra et al. 2003) and a temperature above 2 keV. For the larger, low resolution model 45 cells out of a total of 3568 consistent (or 1.26%) with a cluster had an O VII column large enough. While this may indicate that there is some relationship between a CSE the density of structures in the model, 1.26% is a very small fraction compared to the size and scale of the observed soft excess evident in the real data. From the point of view of absorption line studies, these plots also show that in the vicinity of clusters we would expect an O VI absorbing column of order cm-2 rather than the value predicted by Kaastra et al. (cm-2). Therefore, based on these simulations we would say that there is no strong correlation between emission from the WHIM assoiciated with superclusters and the CSE.
5 Other models
All of the above discussion has been based on the analysis of one particular model. It is reasonable to ask if other models show the same effect. This is actually quite a difficult question to answer since there are only a few models with all the required information freely available. A larger volume, lower resolution model with a size of 100 h-1 Mpc on a uniform mesh with 5123 cells with dark matter particles has also been analysed. This model has been derived from the same code as was used for the higher resolution model discussed above. In general we find the same result - it is very difficult to reproduce the observed soft excess signal. With a larger volume there is, of course, a slightly higher probability of having galaxy groups located along any sight line which can give rise to excess soft flux in a similar fashion to the case studied in section 3.2. However, even by taking this effect into account we still arrive at a similar conclusions to those obtained form the higher resolution model - the WHIM itself cannot reproduce the observed CSE. We have also studied one of the clusters available in the Laboratory of Computational Astrophysics (LCA) simulated cluster archive (http://sca.ncsa.uiuc.edu) with no major change in the conclusions.
6 Conclusions
From the above discussion it would appear that within our current understanding there is insufficient luminosity and low temperature material ( keV) to enable association of an observable CSE with a WHIM filament. What are the possible reasons for this discrepancy? Perhaps the most obvious problem with the simulations is the need for the highest resolution possible coupled with a very large simulation volume. A high resolution enables an accurate simulation of the gas in small groups which may be important (see section 3.2), while a large volume will allow the simulation to accurately represent the WHIM on the scale of filaments and superclusters, again an idea that has been proposed to explain the CSE (Kaastra et al. 2003,2004 and section 4). Here we note that our high resolution simulation is only accurate over scales of 5-6 Mpc which is smaller than the proposed size of the Coma filament (Finoguenov et al. 2003), whereas with the low resolution model one can investigate scales commensurate with a filament but not small groups. Therefore the current model may very well have underestimated the soft X-ray/CSE emission from the WHIM. It is, however, inevitable that any difference between current and future models will be small when compared to the size of the CSE signal, since the current discrepancy between models and observation is so large (10-30 times by mass). This is certainly too large a difference to be a resolution or scale issue. Therefore, while new simulations may be able to account for more of the CSE than current models, there is currently no evidence that emission from the WHIM is the cause of the bulk of the CSE signal.
Given it is unlikely for the WHIM as modeled to be associated with the CSE signal, what other options are we left with? If we assume a thermal intracluster origin of the CSE we are back to the case where we have significant problems with gas cooling times, since the density of the warm ICM must then be high enough for it to be in pressure equilibrium with the hot ICM. As mentioned in the introduction, this would then require an efficient heating mechanism to replenish the radiated energy, which is not easy to envisage. On the other hand, in the context a non-thermal interpretation of the CSE the XMM-Newton detection of OVII emission lines in the CSE spectrum remains unexplained (unless, of course, the observational reality of such lines is called to question). Another formidable challenge to the non-thermal model concerns the ROSAT Coma results of Bonamente et al. (2003), where the CSE is reported to exist on a very large spatial scale. Thus the true nature of the soft X-ray emission component in clusters of remains illusive.
References
- (1)
- (2) Bennett, C.L. et al., 2003, ApJS, 148, 1
- (3) Bonamente, M., Lieu, R. & Mittaz, J.P.D., 2001a, ApJ, 552, L7
- (4) Bonamente, M., Lieu, R. & Mittaz, J.P.D., 2001b, ApJ, 561, L63
- (5) Bonamente, M.,et al. 2002, ApJ, 576, 688
- (6) Bonamente, M., Lieu, R & Joy, M., 2003, ApJ, 595, 722
- (7) Burles, S. & Tytler, D., 1998, Space Sci. Rev., 84, 65
- (8) Cen, R. & Ostriker, J., 1999, ApJ, 514, 1
- (9) Cen, R., Tripp, T., Ostriker, J., Jenkins, E., 2001, ApJ, 559, 5C
- (10) Davé et al., 2001, ApJ, 552, 473
- (11) Ensslin, T.A, Lieu, R. & Biermann, P.L., 1999, A&A, 397, 409
- (12) Ettori, S.,et al., 2002, MNRAS, 330, 971
- (13) Fabian, A.C. 1997, Science, 275, 48
- (14) Fang, T., Bryan, G.L. & Canizares, C.R.. 2002, ApJ, 564, 604
- (15) Fang, T., Sembach, K.R. & Canizares, C.R., 2003, ApJ, 586, L49
- (16) Finoguenov, A, Briel, U & Henry, P., 2003, A&A, 410, 777
- (17) Fukugita, M., Hogan, C.J.& Peebles, P.J.E, 1998, ApJ, 503, 518
- (18) Hwang, C, 1997, Science, 278, 1917
- (19) Kaastra, J.S. 1992, An X-Ray Spectral Code for Optically Thin Plasmas (Internal SRON-Leiden Report, updated version 2.0)
- (20) Kaastra, J. et al., 1999, ApJ, 519, 119
- (21) Kaastra, J., et al., 2003, A&A, 397, 445
- (22) Kaastra, J., et al., 2003b, preprint, astro-ph/0305424
- (23) Liedahl, D.A., Osterheld, A.L., & Goldstein, W.H., 1995, ApJ, 438, L115
- (24) Lieu, R., et al., 1996, ApJ, 458, L5
- (25) Lieu, R., et al., 1996b, Science, 274, 1335
- (26) Lieu, R. & Mittaz, J.P.D, 2004, “Soft X-ray excess emission from clusters of galaxies” Eds. R.Lieu & J.Mittaz, in press.
- (27) Lumb, D.,et al., 2002, A&A, 389, 93
- (28) Mathur, S., Weinberg, D. & Chen, X., 2003, ApJ, 582, 82
- (29) Mittaz, J.P.D, Lieu, R. & Lockman, J., 1998, ApJ, 419, L17
- (30) Molendi, S. & Pizzolato, Fl, 2001, ApJ, 560, 194
- (31) Nevelienen, J.et al., 2003. ApJ, 584, 716
- (32) Nicastro, F., et al., 2003, Nature, 421, 719
- (33) Nicastro, F., 2003, preprint, astro-ph/0311162
- (34) Ostriker, J.P. & Steinhardt, P., 1995, Nature, 377, 600
- (35) Phillips, L.A., Ostriker, J.P. & Cen, R., 2001, ApJ, 554, 9
- (36) Sarazin, C. & Lieu, R., 1998, ApJ, 494, L177
- (37) Soltan, A.M., Freyberg, M.J. & Hassinger, G., 2002, A&A, 395, 475
- (38) Tripp, T.M., Savage, B.D. and Jenkins, E.B., 2000, ApJ, 524, L1
- (39) Zappacosta, L., et al., 2002, A&A, 394, 7
- (40)