Mismatch between X-ray and emission-weighted temperatures in galaxy clusters: cosmological implications
Abstract
The thermal properties of hydrodynamical simulations of galaxy clusters are usually compared to observations by relying on the emission-weighted temperature , instead of on the spectroscopic X-ray temperature , which is obtained by actual observational data. In a recent paper Mazzotta et al. show that, if the cluster is thermally complex, fails at reproducing , and propose a new formula, the spectroscopic-like temperature, , which approximates better than a few per cent. By analyzing a set of hydrodynamical simulations of galaxy clusters, we find that is lower than by 20–30 per cent. As a consequence, the normalization of the – relation from the simulations is larger than the observed one by about 50 per cent. If masses in simulated clusters are estimated by following the same assumptions of hydrostatic equilibrium and –model gas density profile, as often done for observed clusters, then the – relation decreases by about 40 per cent, and significantly reduces its scatter. Based on this result, we conclude that using the observed – relation to infer the amplitude of the power spectrum from the X–ray temperature function could bias low by 10-20 per cent. This may alleviate the tension between the value of inferred from the cluster number density and those from cosmic microwave background and large scale structure.
1 Introduction
Thanks to their position at the top of the hierarchy of cosmic structure formation, galaxy clusters represent powerful tools to constrain cosmological parameters, like the present value of the matter density parameter , and the normalization of the primordial power spectrum, usually expressed in terms of , the r.m.s. matter fluctuation in a sphere of radius of Mpc (Rosati et al. 2002; Voit 2004 for recent reviews). The fundamental quantity entering theoretical models is the cluster mass, but from the observational point of view its high-precision measurement is still precluded by the presence of different systematic effects affecting the lensing data and the dynamical models. A possible short cut to overcome this difficulty is represented by the determination of the cluster temperature from X-ray observations. In fact simple theoretical arguments, supported by numerical hydro-N-body simulations, suggest the existence for virialized gravitational systems of a tight relation between mass and temperature .
The enormous progresses in the angular and spectral resolutions of the latest generation X-ray satellites, Chandra and XMM-Newton, allowed us to obtain temperature measurements for extended sets of clusters, showing in many cases the presence of a rather complex thermal structure. The theoretical interpretation of these high-quality data requires state-of-the art numerical simulations, in which the physical processes acting on the gas component (radiative cooling, non-gravitational heating, etc.) are faithfully reproduced. The comparison between observations and simulations is, however, not always simple. As for X-ray data, the cluster gas temperature is obtained by fitting the source spectrum to a suitable thermal model. This procedure cannot be reproduced in the analysis of simulations, without using devoted software packages (like X-MAS; Gardini et al. 2004), which simulate the spectral properties of the simulated clusters taking into account the instrument response, as well as sky and instrumental backgrounds. To overcome this problem, it has been of common use to resort to the emission-weighted temperature,
| (1) |
Here is the gas density and is the cooling function, for which most of the works in the literature use , assuming bremsstrahlung emission.
Recently, Mazzotta et al. (2004, M04 hereafter) demonstrated that, if clusters have a complex thermal structure, always overestimates the spectroscopic temperature obtained from X-ray observations. The discrepancy between and strongly depends on the complexity of the cluster thermal structure (see also Mathiesen & Evrard 2001; Gardini et al. 2004). M04 proposed a new definition of temperature to be implemented in the analysis of simulations, the spectroscopic-like temperature,
| (2) |
When applied to simulated spectra of clusters hotter than 2-3 keV observed by Chandra or XMM-Newton , this equation, with , yields a temperature within a few per cent from . M04 also showed that this result is almost independent of the details of the detector response function, as long as its spectral properties are similar to or worse than the Chandra ones. In this way, Eq. 2 can be reliably applied to the detectors on board of Beppo-SAX and ASCA.
In this Letter we address the implications of using on the mass–temperature relation and on the X–ray temperature function (XTF) for an extended set of simulated clusters. These results are then used to discuss the effect on the estimate of from the XTF.
2 The simulated clusters
The sample of simulated galaxy clusters used in this paper has been extracted by the large-scale cosmological hydro-N-body simulation of a “concordance” CDM model (, , , , ), presented in Borgani et al. (2004, B04 hereafter). Here we give only a short summary of its characteristics, and we refer to that paper for more details. The run, made by using the massively parallel Tree+SPH code P-GADGET2 (Springel et al. 2001; Springel 2004, in preparation), follows the evolution of dark matter particles and an equal number of gas particles in a periodic cube of size Mpc. The mass of the gas particles is , while the the Plummer-equivalent force softening is kpc at . Besides gravity and hydrodynamics, the simulation includes the treatment of radiative cooling, the effect of a uniform time–dependent UV background, a sub–resolution model for star formation from a multiphase interstellar medium, as well as galactic winds powered by SN explosions (Springel & Hernquist 2003). At we extract a set of 95 temperature-selected clusters (hereafter Set#1) with keV, value below which the single spectroscopic temperature for thermally complex systems cannot be defined (see discussion in M04).
Due to the finite box–size, the largest cluster found in the cosmological simulation has keV. In order to extend our analysis to more massive and hotter systems, as required for the study of the – relation, we further include 4 more galaxy clusters (hereafter Set#2) having and belonging to a different set of hydro-N-body simulations (Dolag et al. 2004 in preparation). Since these objects have been obtained by re-simulating at high resolution a patch of a pre-existing cosmological simulation, they have a better mass resolution, with . These simulations have been performed by using the same code with the same choice of the parameters defining star–formation and feedback.
Therefore, our total sample (Set#1 and #2) comprises 99 objects spanning the temperature range keV.
3 Results
For each cluster in our sample we calculate both the emission–weighted and the spectroscopic–like temperature. As for , it is computed as in B04 by applying Eq. 1, with the cooling function estimated in the [0.5–10] keV energy band so as to account for the typical energy coverage of X–ray detectors. For similar reasons, we apply Eq. 2 to compute by removing the gas particles with keV. We note that, since the mean temperature of each cluster here considered is higher than 2 keV, the excluded particles usually provide a small fraction of the total emission measure. Therefore, this procedure does not significantly affect the values obtained for both and .
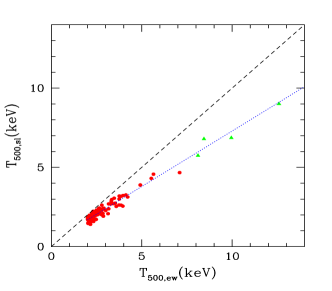
In Fig. 1 we plot the value of versus , which confirms the result of M04, that for all clusters is smaller than . The distribution of the points in Fig. 1 suggests that the two estimators can be roughly related by a linear relation. By applying a fit, we find the relation,
| (3) |
shown as dotted line in Fig. 1. Therefore, for objects with temperatures of about 6 keV, the disagreement can be as large as 2 keV. As also discussed by M04, the relative mismatch between and depends only on the thermal structure of the ICM and, in particular, increases as a function of its complexity. For this reason, we expect Eq. 3 to hold for the physics considered in our simulation sets. Any physical process (e.g. stronger feedback or thermal conduction), which produces a more isothermal ICM, is expected to provide a smaller difference between the two definitions of temperature.
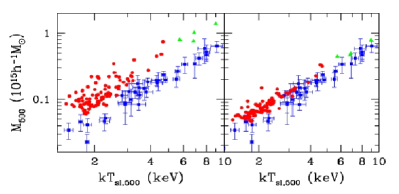
The existence of a systematic trend between the two different estimates of the cluster temperature has interesting consequences on the scaling relation between mass and temperature. Adiabatic hydrodynamical simulations (e.g. Evrard et al. 1996; Bryan & Norman 1998) find a normalization which is about 40 per cent higher than observed (e.g. Horner et al. 1999; Nevalainen et al. 2001; Finoguenov et al. 2001; Allen et al. 2001). This result has suggested the necessity of including in numerical simulations the treatment of extra physical processes for the gas component, like non–gravitational heating and radiative cooling. For instance, B04 showed that considering both effects can be efficient in reducing the normalization of the simulated – relation, which however turned out to be still 20 per cent higher than observed. In that paper, as in most numerical works on the X-ray properties of galaxy clusters, the emission–weighted temperature is used to construct the – relation. However, since tends to overestimate by a fair amount, we expect the actual - relation from simulations to be even more discrepant with respect to observations. This discrepancy is indeed apparent in the left panel of Figure 2, where the simulated – relation at overdensity 111Here is the cosmological critical density. is compared to the observational results by Finoguenov et al. (2001), who measured temperatures from ASCA data. By modelling the scaling relation with
| (4) |
a log-log least–square fitting for the simulated clusters gives
and ,
while
by fixing the slope to the
value expected from the condition of hydrostatic
equilibrium.
While masses of simulated clusters have been computed here by summing over all the particles, masses of X–ray observed clusters are usually estimated from data (e.g., Markevitch 1998; Nevalainen et al. 2000; Finoguenov et al. 2001) by applying the condition of hydrostatic equilibrium to a spherical gas distribution described by a –model (Cavaliere & Fusco–Femiano 1976), with the equation of state having the polytropic form. In this way, the total self–gravitating mass within the radius is
| (5) |
Here is the temperature at , is the fitted slope of the gas density profile, is the radial coordinate in units of the core radius , and is the effective polytropic index.
A number of analyses of hydrodynamical simulations of clusters (e.g., Muanwong et al. 2002; B04; Rasia et al. 2004; Kay et al. 2004; cf. also Ascasibar et al. 2003) have shown that Eq.5 underestimates the actual cluster mass by about 20 per cent. Here we repeat the same analysis as in B04, but using in Eq.5 instead of . Although the resulting – relation (shown in the right panel of Figure 2) is still slightly higher than the observed one, we find that the amplitude of the – relation decreases quite substantially, with masses derived from Eq.5 being on average 40 per cent smaller than the true ones. The discrepancy between true and recovered cluster masses is larger than in B04 as a consequence of using , instead of . A comparable bias in the mass estimates has been also found by Bartelmann & Steinmetz (1996), who used a spectroscopic definition of temperatures. Fitting the simulation results to Eq.4 gives and , while when fixing (we note that the change of is larger than the 40 per cent average decrease of the temperature, due to the non–Gaussian distribution of the scatter in the left panel of Fig.2).
As already mentioned, the – relation is one of the key ingredients in the recipes to extract cosmological parameters from the cluster X–ray luminosity (XLF) and temperature functions (XTF): for a fixed value of , a larger implies a larger mass for a fixed temperature and, therefore, a higher normalization of the power spectrum (e.g., Borgani et al. 2001; Seljak 2002; Pierpaoli et al. 2003; Henry 2004). Huterer & White (2002) suggested an approximation for the scaling of with , involving the matter density parameter: . Based on this relation, we expect that a bias in the mass estimate as large as that found for the simulated clusters turns into an underestimate of by about 20 per cent.
Besides decreasing , estimating cluster masses from Eq.5 also significantly reduces the scatter in the – relation from about 30 per cent to about 16 per cent, as evident from Figure 2. This witnesses that the complex structure of the ICM enters in determining the intrinsic scatter of the – relation in a more subtle way that just accounted for by cluster-to-cluster variations of the –model fitting parameters and of the effective polytropic index. The intrinsic scatter of the – relation is a further piece of information entering into the determination of : since the theoretical mass function needs to be convolved with this scatter, the high–temperature tail of the model XTF grows with the scatter, at a fixed (e.g. Pierpaoli et al. 2003). As a consequence, an overestimate of the scatter turns into an underestimate of . We find that decreases by about 5 per cent by assuming 30 per cent, instead of 16 per cent, intrinsic scatter. Although this effect only partially compensates for the underestimate of the amplitude of the – relation, it highlights once again how precision measurements of cosmological parameters require having under control a number of systematic effects entering in the conversion between cluster mass and observable quantities.
As a word of caution, we remind that the mismatch between and is introduced by the complexity of the cluster thermal structure and, therefore, so does the estimate of any biasing in the mass estimate. Furthermore, in order to properly quantify the amount of a possible bias in the observational determination of cluster masses it is required to reproduce as closely as possible the observational procedure and the scale range where the value of is fitted (see the discussion in B04). We desert to a forthcoming paper (Rasia et al., in preparation) a detailed analysis of the observational systematics in the determination of cluster masses from X–ray data. In this respect, it will be also important to compare results on from the XTF with those from other methods, also based on galaxy clusters, but not relying on the choice of the – relation. An example is provided by the approach based on the cluster baryon mass function (Voevodkin & Vikhlinin 2004), which provides .
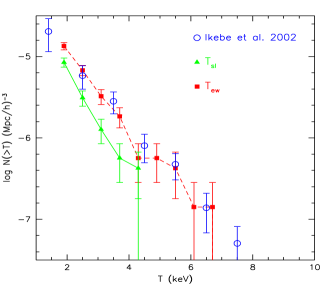
In Figure 3 we show the effect that using , instead of , has on the estimate of the XTF. We compare here the cumulative temperature function from the simulation (Set#1 only) to the data by Ikebe et al. (2002). Using reproduces the observed XTF quite well (see also B04): this would support , the value assumed in the simulation. However, when is used to better account for the observational procedure of temperature measurement, the simulation XTF is significantly affected, especially in the high-temperature tail. This result shows that is excluded at 3 level, while favoring a larger power spectrum normalization, at least for the ICM physics introduced in our simulation. For instance, at 2 keV the simulated cumulative XTF is lower than the observed one by about 50-60 per cent. The value of corresponding to this temperature in our simulation is about . Computing the mass function by Sheth & Tormen (1999) for our cosmology at this mass, we find that needs to be increased to about 0.9 to increase the number density of clusters above this mass limit by the required 50–60 per cent.
4 Conclusions
As demonstrated by Mazzotta et al. (2004; see also Mathiesen & Evrard 2001), the emission-weighted temperature, , usually assumed to analyze the results of hydrodynamical simulations, fails in reproducing the “observational” temperature obtained from the spectral fit. As an alternative, M04 proposed and tested a new formula, named spectroscopic-like temperature, , which gives a much better approximation to the spectroscopic temperature, with differences of a few per cent for –3 keV.
In this Letter we have studied the consequences, for the
mass–temperature (–) relation and for the estimate of
from the X–ray temperature function (XTF), of adopting
, instead of . We have analyzed a
set of hydrodynamical simulations of galaxy clusters, which include a
realistic treatment of the gas physics. Our main results can be
summarized as follows.
(a) We find in our simulations that is smaller than
by a factor 0.7–0.8. A linear fit approximating the
relation between the two different temperature estimators is given by
Eq. 3.
(b) Using , instead of , increases the
normalization of the – relation making it higher than the
observed one by about 50 per cent. By assuming hydrostatic
equilibrium for a gas density distribution described by a
–model with a polytropic equation of state, masses are
underestimated on average by per cent, therefore
substantially reducing the discrepancy with observational data; the
scatter in the – relation is also underestimated by about a
factor two.
(c) A bias in the – relation propagates into a bias in
the power spectrum normalization, , from the XTF. If such a
bias is as large as that found in the simulations, the values
of obtained by combining the local XTF and the observed
– relation are underestimated by about 15 per cent.
(d) The XTF from the simulation is significantly lower when
using instead of . A comparison with the
observed XTF (Ikebe et al. 2001) indicates that for the
“concordance” CDM model needs
to be increased from to .
In general, our conclusions go in the direction of alleviating a possible tension between the power–spectrum normalization obtained from the number density of galaxy clusters and that arising from the first–year WMAP CMB anisotropies (e.g. Bennett et al. 2003) and SDSS galaxy power spectrum (e.g. Tegmark et al. 2004). Our results rely on: i) the reliability of our simulations to correctly describe the thermal complexity of the ICM; ii) the capability of reproducing and understanding any possible source of bias in the estimates of cluster masses. There is little doubt that these two issues need to be addressed in detail in order to fully exploit the role that hydrodynamical simulations play in the calibration of galaxy clusters as precision tools for cosmology.
References
- (1) Allen, S.W., Schmidt, R.W., & Fabian, A.C. 2001, MNRAS, 328, L37
- (2) Ascasibar, Y., Yepes, G., Mueller, V., & Gottloeber, S. 2003, MNRAS, 346, 731
- (3) Bartelmann, M., & Steinmetz, M. 1996, MNRAS, 283, 431
- (4) Bennett, C.L., et al. 2003, ApJS, 148, 1
- (5) Borgani, S., et al. 2001, ApJ, 561, 13
- (6) Borgani, S., et al. 2004, MNRAS, 348, 1078 (B04)
- (7) Bryan, G.L., & Norman, M.L. 1998, ApJ, 495, 80
- (8) Cavaliere, A., & Fusco–Femiano, R. 1976, A&A, 49, 137
- (9) Evrard, A.E., Metzler, C.R., & Navarro, J.F. 1996, ApJ, 469, 494
- (10) Finoguenov, A., Reiprich, T.H., & Böhringer, H. 2001, A&A, 369, 479
- (11) Gardini, A., Rasia, E., Mazzotta, P., Tormen, G., De Grandi, S., & Moscardini, L. 2004, MNRAS, 351, 505
- (12) Henry, J.P. 2004, ApJ, 609, 603
- (13) Horner, D.J., Mushotzky, R.F., & Scharf, C.A. 1999, ApJ, 520, 78
- (14) Huterer, D., & White, M. 2002, ApJ, 578, L95
- (15) Ikebe, Y., Reiprich, T.H., Böhringer, H., Tanaka, Y., & Kitayama, T. 2002, A&A, 383, 773
- (16) Kay, S.T., Thomas, P.A., Jenkins, A., & Pearce, F.R. 2004, MNRAS, in press (astro-ph/0407058)
- (17) Markevitch, M. 1998, ApJ, 504, 27
- (18) Mathiesen, B.F., & Evrard, A.E. 2001, ApJ, 546, 100
- (19) Mazzotta, P., Rasia, E., Moscardini, L., & Tormen, G. 2004, MNRAS, in press (astro-ph/0404425) (M04)
- (20) Muanwong, O., Thomas, P.A., Kay, S.T., & Pearce, F.R. 2002, MNRAS, 336, 527
- (21) Nevalainen, J., Kaastra, J., Parmar, A.N., Markevitch, M., Oosterbroek, T., Colafrancesco, S., & Mazzotta, P. 2001, A&A, 369, 459
- (22) Nevalainen, J., Markevitch, M., & Forman, W. 2000, ApJ, 532, 694
- (23) Pierpaoli, E., Borgani, S., Scott, D., & White, M. 2003, MNRAS, 342, 163
- (24) Rasia, E., Tormen, G., & Moscardini, L. 2004, MNRAS, 351, 237
- (25) Rosati, P., Borgani, S., & Norman, C. 2002, ARA&A, 40, 539
- (26) Seljak, U. 2002, MNRAS, 337, 769
- (27) Sheth, R.K., & Tormen, G. 1999, MNRAS, 308, 119
- (28) Springel, V., & Hernquist, L. 2003, MNRAS, 339, 289
- (29) Springel, V., Yoshida, N., & White, S.D.M. 2001, NewA, 6, 79
- (30) Tegmark, M., et al. 2004, Phys. Rev. D, 69, 103501
- (31) Voevodkin, A. & Vikhlinin, A. 2004, ApJ, 601, 610
- (32) Voit, G.M. 2004, Rev. Mod. Phys., in press