∗Corresponding author: A. Horneffer horneff@MPIfR-Bonn.mpg.de
LOPES
Detecting Radio Emission from Cosmic Ray Air Showers
Abstract
Radio pulses emitted in the atmosphere during the air shower development of high-energy primary cosmic rays were measured during the late 1960ies in the frequency range from 2 MHz to 520 MHz. Mainly due to difficulties with radio interference these measurements ceased in the late 1970ies.
LOFAR (Low Frequency Array) is a new digital radio interferometer under development. Using high bandwidth ADCs and fast data processing it will be able to filter out most of the interference. By storing the whole waveform information in digital form one can analyze transient events like air showers even after they have been recorded.
To test this new technology and to demonstrate its ability to measure air showers a ”LOFAR Prototype Station” (LOPES) is set up to operate in conjunction with an existing air shower array (KASCADE-Grande).
The first phase consisting of 10 antennas is already running. It operates in the frequency range of 40 to 80 MHz, using simple short dipole antennas and direct 2nd Nyquist sampling of the incoming wave. It has proven to be able to do simple astronomical measurements, like imaging of a solar burst. It has also demonstrated how digital interference suppression and beamforming can overcome the problem of radio interference and pick out air shower events.
keywords:
cosmic rays, radio, EAS, LOFAR, LOPES1 Introduction
The earth’s atmosphere is continuously bombarded by high energy particles, called cosmic rays. They consist mainly of ionized atomic nuclei, of elements in the range from hydrogen to iron and that have energies from eV up to the order of eV. The flux spectrum follows a power law with a change of the index from to around 3 PeV. The origin of cosmic rays is still not definitively known. Possible sources are supernova remanents, pulsars, quasars, active galactic nuclei, or even the decay of topological defects or other exotic particles. Due to the wide range in energy different emission mechanisms are also possible. Since these charged particles are deflected in the interstellar magnetic fields, important information about their origin is in their energy and mass.
High energy cosmic rays hitting the earth’s atmosphere undergo nuclear reactions with atmospheric nuclei, producing secondary particles in an air shower. Thus direct measurements are only possible above the earth (i.e. with balloon-borne or satellite experiments). Due to the low flux cosmic rays at energies above ca. 1 PeV cannot be effectively measured by direct measurements. A standard method to observe these cosmic rays is to measure the secondary particles of an air shower with an array of particle detectors on the ground. As the state of an air shower at the ground level depends on many factors, like primary particle energy and type, atmospheric conditions and statistical fluctuations, the determination of primary particle energy and type from the measured particles is not straightforward. Very useful information for the determination of primary particle energy and type can be obtained by additionally observing the air shower as it evolves. So far this is only done by observing optical emission like Cherenkov or fluorescence light. This requires dark, clear and moonless nights and thus limits the available duty cycle to about 10%.
Measuring radio emission from air showers might be an alternative method for such observations, providing a much better efficiency. This becomes particularly relevant since a new generation of digital radio telescopes – designed primarily for astronomical purposes – promises a new way of measuring air showers.
2 Radio Properties of Air Showers
Radio emission from cosmic ray air showers were discovered for the first time by Jelley et al.[4] at 44 MHz. The results were soon verified and in the late 1960’s emission from 2 MHz up to 520 MHz were found. In the following years these activities ceased due to difficulty with radio interference, uncertainty about the interpretation of the results, and the success of other methods.
The radio properties of extensive air showers were summarized in a review by Allan[2]. His analysis led to an approximate formula relating the received voltage to various other parameters:
| (1) |
Here is the primary particle energy, is the angle to the geomagnetic field, is the zenith angle, R is the distance to the shower center, is around 110 m at 55 MHz, and is the observing frequency. Some later works (e.g. by Prah[3]) yielded much smaller values for the field strength. Part of this discrepancies may be due to errors in the calibration (e.g. of the primary particle energy). Additionally the documentation of the available data is not always precise, which makes direct comparisons complicated. Although comparisons of the absolute values are difficult, the trend in the dependence on observing frequency and radial distance is fairly consistent. More recent experiments conducted at the CASA-MIA air shower array have only been able to give an upper limit for the field strength[5].
3 LOFAR and LOPES
LOFAR is a new attempt to revitalize astrophysical research at 10-200 MHz with the means of modern information technology[7]. The basic idea of LOFAR is to build a large array of stations of omnidirectional dipole antennas in which the received waves are digitized and sent to a central super-cluster of computers.
A new feature is the possibility to store the entire data stream for a certain period of time. If one detects a transient phenomenon – like gamma ray bursts, X-ray binary flares or air showers – one can then retrospectively form a beam in the desired direction and thus basically look back in time. LOFAR therefore combines the advantages of a low-gain antenna (large field of view) and a high-gain antenna (high sensitivity and background suppression). This makes it an ideal tool to study radio emission from cosmic ray air showers. With its range of baselines between 10 m and 400 km LOFAR will be capable to detect air showers from eV to eV.
To test the technology of LOFAR and demonstrate its capability to measure air showers we are building LOPES a ”LOFAR Prototype Station” at the site of KASCADE-Grande in Karlsruhe/Germany[8][9]. The data from a well tested air shower experiment not only allows us to calibrate the radio data with other air shower parameters, it also provides us with starting points for the air shower reconstruction, simplifying the development process. This will enable us to clarify the nature and properties of radio emission from air showers and provide an energy calibration for future radio air shower experiments. Also, LOPES will provide KASCADE-Grande with valuable additional information about the air shower, as the radio data and the particle data come from different stages in the evolution of a shower.

4 The Hardware of LOPES
LOPES operates in the frequency range of 40–80 MHz. This is a band where there are few strong man made radio transmitters, as it lies between the short-wave- and the FM-band. Also the frequency is low enough, that the emission from air showers is strong, while it is still high enough, so that the background emission from the galactic plane111The radiation temperature averaged over the sky ranges from 2000 K at 80 MHz to 10000 K at 40 MHz is still low.
The outline of the hardware used for LOPES can be seen in figure 3. It samples the radio frequency signal after minimal analog treatment without the use of a local oscillator. This will allow mass production at low costs in the future.
4.1 Antenna
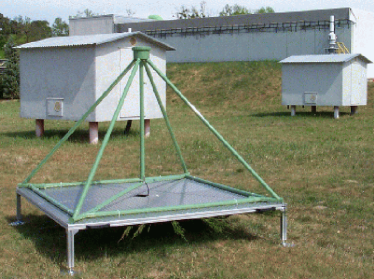
The antennas for LOPES are short dipole antennas with an ”inverted vee” shape. Placed above a suitable ground screen this gives an antenna diagram, that points to the zenith and has its half power line at a zenith angle of ca. almost independent of azimuth. One of the LOPES antennas at the KASCADE-Grande site is shown in figure 3. The visible parts are commercial PVC pipe holding the active parts in place. The radiator consists of two copper cables extending from the top down two thirds of two opposing edges of the pyramid. The four edges can be used for two orthogonal linear polarizations of the signal. As we expect the signal to be highly polarized we use only the east-west polarization direction.
Inside the container at the top resides the active balun. Its main functions are balanced to unbalanced conversion, amplification of the signal and transformation of the antenna impedance to the impedance of the cable. The amplifier is a negative feedback amplifier, with the input impedance of the feedback network matched to the impedance of the radiator. This gives sensitivity over a wide frequency range with good linearity and noise performance.
The PVC exterior of the antenna resides on an aluminum pedestal. This acts as a ground screen and protects the antenna from the people mowing the lawn.
4.2 Receiver Module
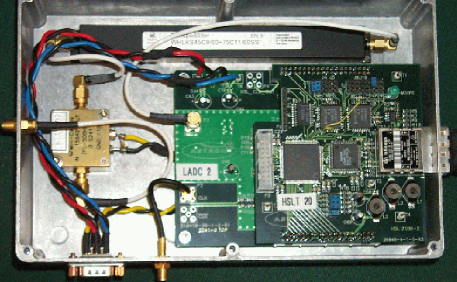
Figure 4 shows one of the receiver modules for LOPES (RML). On the left side, next to the signal input, is an analog amplifier. This is a commercially available amplifier. The high background from the galactic noise and the low absolute power makes it possible the meet the required noise and intermodulation performance with a relatively cheap amplifier.
Next in the signal path, at the top of picture, is the anti-aliasing filter. To suppress contamination from outside our band a stopband attenuation of 60 dB is needed. Additionally the desire for high usable bandwidth makes steep edges necessary. The filter used for LOPES gives us a usable frequency band from 43 MHz to 76 MHz.
The last analog device in the signal path is the A/D-converter board at the bottom right of the picture. The necessary dynamic range to detect weak pulses while not saturating the ADC with radio interference is achieved by using 12-bit ADCs. We are using ADCs running at 80 MHz, thus sampling the signal in the 2nd Nyquist domain of the ADCs. Piggybacked onto the A/D-converter board is an optical transmitter board for transmission of the digital data to the backend module.
4.3 Digital Backend and Clock Module
The digital data is transferred via fiber optics to memory modules. These modules have standard PCI-connectors ant fit into the front-end PCs. Each module has two inputs with 1.2 GBit/sec each and can take up to 2 GByte of normal PC133–style computer memory. This allows it to store up to 6.25 seconds of data from both inputs or even 12.5 seconds of data using only one input. Several of these modules can be used together by synchronizing them with a common sync-signal. The modules can either start writing the data after a sync-signal or write data continuously into the memory and stop a predefined time after a sync-signal is received.
The sample clock for the A/D-converters and a synchronous clock for the memory modules is generated on a central clock module and then distributed all modules. This clock module also distributes the sync-signal to all memory modules.
5 LOPES at KASCADE-Grande
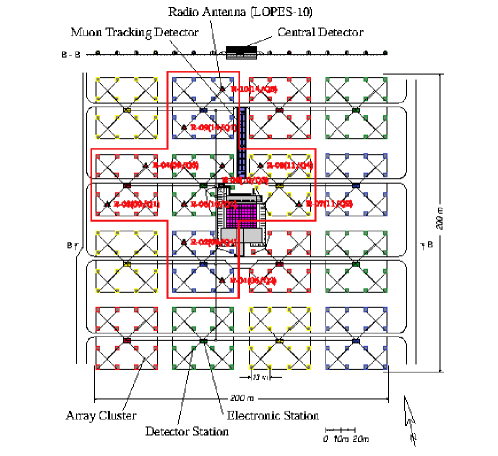
The first stage of LOPES is complete and running. The system and ten antennas are set up at the KASCADE-Grande site at the positions shown in Figure 5. The relative positions of the antennas have been measured using a differential GPS system with an accuracy of a few cm.
LOPES is triggered by a large event trigger from the KASCADE-array[9] (10 out of 16 array-cluster have an internal trigger). After each trigger 0.82 milliseconds worth of data from the time around the trigger are read out and stored on harddisk in our central DAQ-PC.
LOPES is not yet tied into the KASCADE data acquisition system. But offline correlation of LOPES and KASCADE data works without problems. A PCI card, that supplies a KASCADE-style timestamp to LOPES, is currently under development. This timestamp is needed by the event building software of KASCADE, and will enable us to add the LOPES data into the KASCADE data stream.
6 Measurements
6.1 Dynamic Spectra
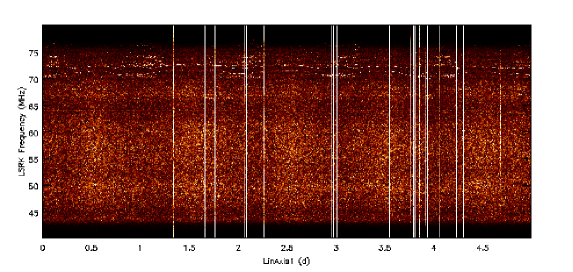
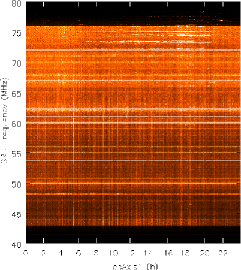
During system tests in Dwingeloo some data was taken every minute over a period of a few days. From this data we calculated the dynamic spectrum as shown in figure 6 at the left side. The day to night change in general background noise is due to the rise and fall of the galactic plane into and out of the antenna beam. This shows us, that the noise performance of the total system is satisfactory.
Horizontal lines in the figure show narrow band interference. E.g. a TV-transmitter, that is switched of at night at 62 MHz and 67 MHz. Vertical lines, that extend over the whole range, are caused by digital errors. Those, that show the shape of the analog filter are caused by bursts of short time interference pulses. The vertical line at 3.9 days is caused by a solar burst.
Similar measurements at the KASCADE-Grande site (figure 6 right) show that there is more radio interference present. This interference also prevents us from seeing the rise and fall of the galactic plane.
6.2 Astronomic Maps
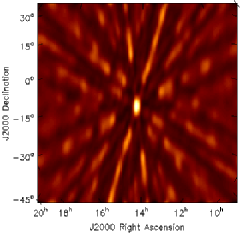
During solar bursts the sun becomes by far the brightest source in the sky at our frequencies, enabling us to generate an image of the sun with minimal integration time. Due to the low frequencies of LOPES the sun is seen as a single point. This allows us to calibrate the relative time delays of our antennas, by comparing the measured time delays to the values as expected from the position of the sun.
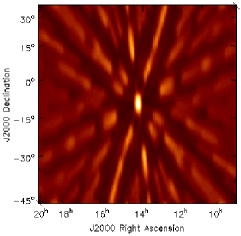
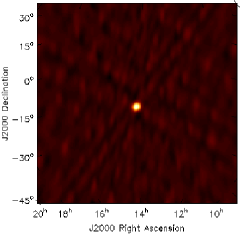
The success of this calibration can be tested by generating a map of the sun. Figure 7 shows a raw (dirty) map from 0.82 milliseconds of data for a solar burst at the 28 October 2003 on the left side. The structures around the point in the middle are due to the sidelobes caused by the large distances between our antennas. These sidelobes can be computed from the antenna positions with standard astronomical software e.g. aips++[10] (figure 7 middle). With this information one can reconstruct a clean map of the sun (figure 7 right).
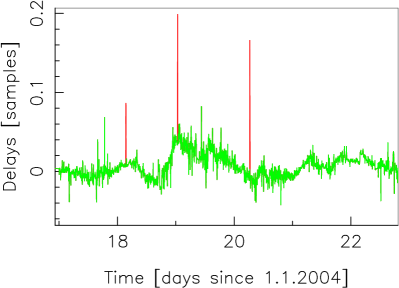
By monitoring the relative phases of a TV transmitter we can monitor the phase stability of our system and get time delay calibration values for every day. These measurements show us, that sometimes the synchronization of one antenna jumps by two sample times2221 sample time = 1/(80 MHz) = 12.5 ns for some time. But these jumps can be corrected for by the data from the TV transmitter. After the correction of integer sized jumps the residual time delays are below 0.1 sample time.
6.3 Air Shower Events
a)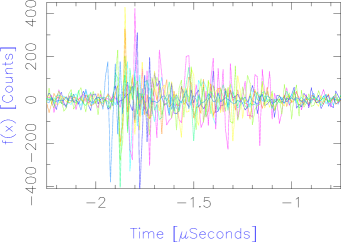 b)
b)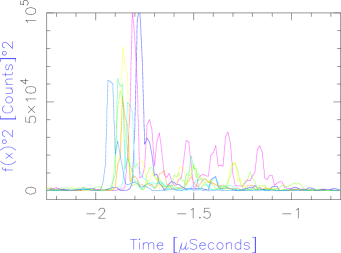
c)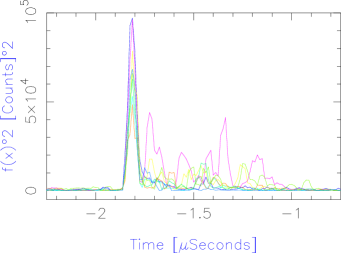 d)
d)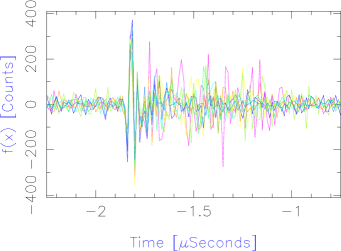
e)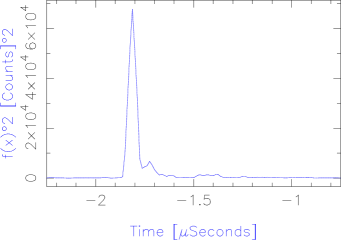 f)
f)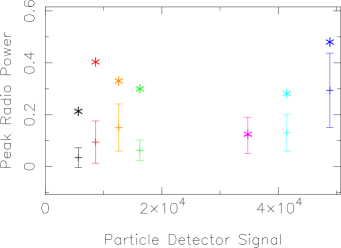
As already shown radio interference comes in two kinds: (approximately) continuous narrow band transmissions and short time pulses. The narrow band interference can be filtered out without problems by transforming the data to frequency space, flagging of the interference and transforming back. Short time pulses, which are not correlated with an air shower, can be identified by their arrival time at the different antennas, and thus suppressed.
The detectors of the KASCADE-array emit radio pulses, that are correlated with the air shower arrival time and direction. They scale with the particle detector signal, so they are present for the largest (and thus interesting) air showers and hard to detect in small air showers. The interference pulse each antenna sees is dominated by the particle detectors nearest to it.
However, the emission from the detectors is not coherent and can be reduced in the beamforming process. This is demonstrated in figure 9 a–e. During beamforming a time delay is computed for each antenna from its position relative to the phase center and the desired direction, e.g. the direction of the air shower as given by KASCADE-Grande. Then the electric field data (subpanel a) is shifted by this delay. Shifting by subpixel values can be done by applying a phase gradient to the Fourier space data. A coherent signal that comes from the chosen direction has then in every data set the same form, like the spike at ca. in subpanel d. Incoherent signals show different forms in the different antennas, like the pulses at –. (Subpanels b and c in figure 9 show the squared values of the data in subpanels a and d. This is a value for the received power.) Then the shifted electric field data from all antennas is added together. Thus coherent signals are enhanced, while incoherent signals are suppressed. Subpanel e shows the power of the formed beam. The spike gives a large peak, while the interference from the particle detectors is reduced, demonstrating that the spike is a radio signal, that comes from the chosen direction.
Subpanel f demonstrates that this spike lies well above what is usually produced by the particle detectors. By choosing events with the same amount of energy deposited in the detectors around a given antenna (as measured by KASCADE), one gets a dataset, in which events from small air showers, that had their center near the chosen antenna, are accumulated. In this data the radio signal is dominated by the interference from the particle detectors. By averaging over this radio signals, one can get a relation with which one can use the KASCADE data to calculate the expected interference signal. In subpanel f the data from the example event and the expected data is shown for seven antennas.
7 Outlook
The first phase of LOPES consisting of 10 antennas is running and taking scientific data. Currently we are working on the scientific analysis of the data. The results of this work will be published in another paper. The second stage of LOPES with 20 more antennas is currently under construction. It will be set up this year.
The same technology can be applied to other forthcoming digital radio telescopes like LOFAR and the SKA, providing additional detection area for high energy cosmic rays.
Acknowledgements.
LOPES is supported by the German Federal Ministry of Education and Research, under grant No. 05 CS1ERA/1 (Verbundforschung Astroteilchenphysik).References
- [1] T. Huege and H. Falcke, “Radio emission from cosmic ray air showers,” A&A 412, pp. 19–34, 2003.
- [2] H. R. Allan Prog. in Element. part. and Cos. Ray Phys. Vol. 10, p. 171, 1971.
- [3] J. H. Prah, “M.phil. thesis, university of london,” 1971.
- [4] J. V. Jelley, J. H. Fruin, N. A. Porter, T. C. Weekes, F. G. Smith, and R. A. Porter Nature 205, p. 327, 1965.
- [5] K. Green, J. L. Rosner, D. A. Suprun, and J. F. Wilkerson, “A prototype system for detecting the radio-frequency pulse assisoated with cosmic ray air showers,” Nucl. Instr. Meth. 498, p. 256, 2003.
- [6] H. Falcke and P. W. Gorham, “Detecting radio emission from cosmic ray air showers and neutrinos with a digital radio telescope,” Astropart. Physics 19, p. 477, 2003.
- [7] J. D. Bregman, “Perspective on radio astronomy: Technologies for large antenna arrays,” 1999.
- [8] T. Antoni et al. (KASCADE-Collaboration), “The cosmic-ray experiment kascade,” Nucl. Instr. Meth. A 513, p. 490, 2003.
- [9] H. Schieler et al., “Kascade extensive air shower experiment,” in Astronomical Telescopes and Instrumentation 2002: Non-EM Astronomy, Proc. SPIE 4858-5, 2002.
- [10] AIPS++ Consortium, http://aips2.nrao.edu/docs/aips++.html AIPS++ the Astronomical Information Processing System.