11email: enno.middelberg@csiro.au, aroy@mpifr-bonn.mpg.de 22institutetext: Geodätisches Institut der Universität Bonn, Nussallee 17, D-53115 Bonn, Germany 33institutetext: National Radio Astronomy Observatory, P.O. Box 0, Socorro, NM, 87801, USA
33email: cwalker@aoc.nrao.edu 44institutetext: ASTRON, P.O. Box 2, 7990 AA Dwingeloo, The Netherlands
44email: falcke@astron.nl
VLBI detections of a source weaker than at 86 GHz
Abstract
We use a new phase-calibration strategy to calibrate the phase of 86 GHz VLBI observations of the FR I radio galaxy NGC 4261. Instead of switching between a calibrator source and the target source, the target was observed while rapidly switching between the target frequency and a lower reference frequency. Self-calibration at the reference frequency yielded phase corrections which were multiplied with the frequency ratio and applied to the target frequency visibilities. The resulting detection of NGC 4261 is, to our knowledge, the first of NGC 4261 with 86 GHz VLBI, and it is also the weakest source so far detected with VLBI at that frequency.
1 Introduction
The scientific interest in VLBI observations at 86 GHz includes spatially resolved imaging of extragalactic radio jets on the linear scales on which the jets are launched. The process is not yet understood and only millimetre VLBI can resolve this region even in the closest objects. Interests also include investigations of internal jet structure, jet composition and collimation (e.g., Doeleman et al. 2001, Gómez et al. 1999), and imaging of the event horizon in, e.g., Sgr A∗ (Falcke et al. 2000). 86 GHz observations of the FR I radio galaxy NGC 4261 provide the opportunity to eventually resolve its jet collimation, because its combination of proximity and black hole mass yields a linear resolution of only 200 Schwarzschild radii.
Higher frequency observations involve a number of serious problems. The sources are usually weaker, the aperture efficiencies of most radio telescopes used for VLBI drop to 15 % or less, the receiver performances become disproportionately worse, the atmospheric contribution to becomes larger, and the atmospheric coherence time scales decrease as . In cm VLBI, the coherence time can be extended using phase-referencing, but in mm VLBI, phase-referencing is not commonly used, although a successful proof of concept exists (Porcas & Rioja 2002). Problems arise from the need for a suitable, strong phase calibrator in the vicinity of the target source and relatively long telescope slewing times.
We outlined the technique of fast frequency switching, in Middelberg et al. (2002), in which an object is observed while rapidly switching between the target frequency and a lower reference frequency. We demonstrated there the feasibility of the technique with detections of a calibrator and made tentative detections of a weak target, the AGN in M81. We have since made considerable improvements to the observing strategy and present here the first detection of the AGN in NGC 4261 with 86 GHz VLBI.
2 Principle of phase correction
The main source of phase noise in VLBI observations at frequencies higher than about 5 GHz is turbulence in the troposphere causing refractive inhomogeneities. The refractive screen is non-dispersive, and one can self-calibrate the visibility phases at the reference frequency, , and use the solutions to calibrate the target frequency visibility phases, , after multiplying them by the frequency ratio, . However, the lag between the two measurements must not exceed half the atmospheric coherence time. This is possible with the VLBA111The VLBA is an instrument of the National Radio Astronomy Observatory, a facility of the National Science Foundation, operated under cooperative agreement by Associated Universities, Inc. because frequency changes need only a few seconds and because the local oscillator phases return to their original settings after a frequency switch. After multiplying the phase solutions by the frequency ratio and applying them to the target-frequency phases, there remains a constant phase offset between the signal paths at the two frequencies, , which must be calibrated. It can be monitored with observations of achromatic, strong calibrators, and must be subtracted from the high-frequency visibility phases. Thus, the true high-frequency visibilities are phase-referenced to the source’s low-frequency visibilities, and so the technique can prolong coherence and can measure the position shift of cores in active galactic nuclei (AGN) with frequency.
However, in our project, unmodelled ionospheric path length changes, which are dispersive, limited the coherence to half an hour in the worst case. Therefore, we here only show how fast frequency switching can be used to calibrate the short-term phase fluctuations. To remove the remaining long-term phase drifts and remaining phase offsets, we used one extra step of self-calibration at the target frequency with a half-hour solution interval. This extra step of self-calibration prevented us from making a core-shift measurement.
3 Observations
We observed NGC 4261 as a fast frequency switching target and 3C 273 and 3C 279 occasionally for the phase offset, , and to test the technique on strong sources. Dynamic scheduling allowed us to observe during a period of superb weather, using 256 Mbps to record a bandwidth of 64 MHz with 2-bit sampling.
In this article, a pair of two integrations at and is called a “cycle”, each integration of which is called a “half-cycle”, and a sequence of cycles on the same source is called a “scan”.
Several considerations influenced the experiment design. The target frequency should be an integer multiple of the reference frequency to avoid having to unwrap phase wraps. We chose a reference frequency of 14.375 GHz since the third and sixth harmonics at 43.125 GHz and 86.25 GHz lie within the VLBA receiver bands. For convenience, we will refer to these frequencies as “15 GHz”, “43 GHz” and “86 GHz”, respectively.
We chose a cycle time of 50 s, of which 22 s were spent at the reference frequency of 15 GHz and the remaining 28 s were spent at the target frequency, either 43 GHz or 86 GHz. An average time of 7 s per half-cycle was lost in moving the subreflector between the feed horns, resulting in net integration times of 15 s at and 21 s at . The integration times are a compromise, depending on source brightness, antenna sensitivity and expected weather conditions. This setup yielded a detection limit of 89 mJy in 15 s at 15 GHz for the VLBA on a single baseline.
4 Data reduction
Data reduction was carried out in AIPS. The amplitudes were calibrated using and gain measurements, and amplitude corrections for errors in the sampler thresholds were performed using autocorrelation data. The instrumental delays and inter-IF phase offsets were corrected using a fringe-finder scan and were found to be stable over the experiment. A correction for the dispersive delays introduced by the ionosphere was attempted using GPS-based, global maps of the total electron content. Unfortunately, the error in these maps can be quite high (typically 10 % to 20 %, but up to 50 %), causing residual phase rates after the transfer of phase solutions between frequencies. These errors prevented us from making a core-shift measurement because self-calibration was still required to calibrate the residual rates.
From the start of a new half-cycle, 5 s to 8 s are required to position the subreflector. Data during that time should be flagged. Compromise flagging times for each antenna and frequency at the start of each half-cycle were applied using the AIPS task QUACK.
We fringe-fitted the 15 GHz data using the AIPS task FRING. We made a 15 GHz image that we used as a source model in a second run of FRING, so that the phase solutions did not contain structural phase contributions. The solution interval was set to 1 min, yielding one phase, delay and phase rate solution per half cycle. The detection rate was . The solution table was written to a text file to do the phase scaling outside AIPS. A Python program was used to read in the table, to generate timestamps to coincide with the target frequency half-cycles, and to calculate a solution consisting of a phase, a phase rate, and a delay. These solutions were imported to AIPS to update the most recent calibration table at the target frequency.
5 Results
5.1 43 GHz
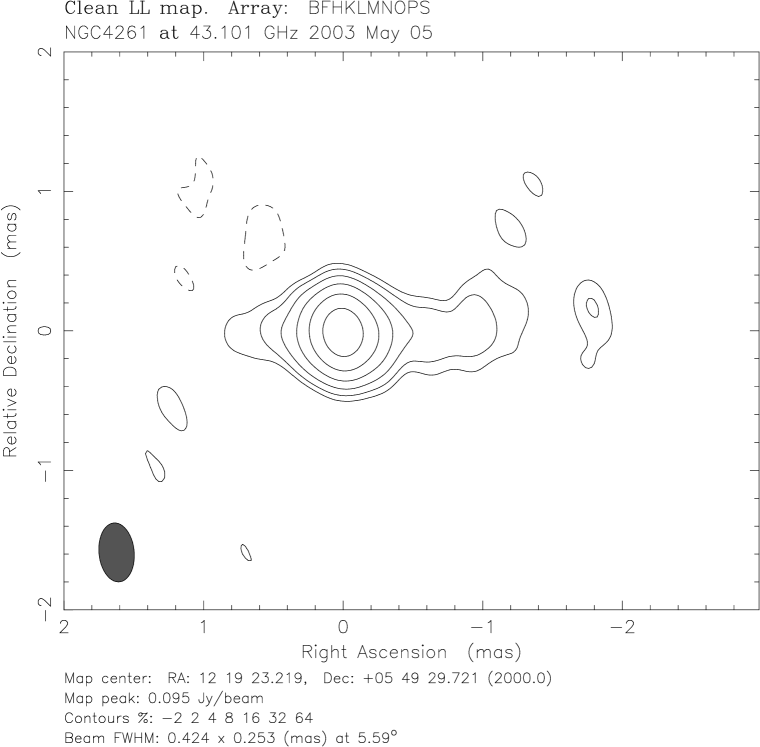
NGC 4261 was detected on most baselines at all times after scaling the 15 GHz solutions to 43 GHz, with correlated flux densities of 30 mJy (800 M) to 160 mJy (30 M). Here, the term “detected” means that by inspecting the phase-time series by eye one can see that the phases are not random. The 43 GHz half-cycle average visibilities on baselines to Los Alamos are shown in Fig. 1. The short-term fluctuations introduced by the troposphere are almost perfectly calibrated, but residual phase drifts remain on longer time-scales, especially at the beginning and at the end of the experiment, when the sun was setting and rising at Los Alamos and the source elevation was low at most stations.
Before making an image from the 43 GHz visibilities calibrated with fast frequency switching, the residual phase offsets and phase rates were removed using fringe-fitting with a solution interval of 30 min so that one solution per scan was obtained. The resulting dirty image (Fig. 2) has a peak flux density of and an rms noise of , yielding a dynamic range of 18:1. After several cycles of phase self-calibration with a solution interval of 30 s and one cycle of amplitude self-calibration with a solution interval of 12 h, the peak flux density was and the rms noise was , so the dynamic range improved to 122:1 (Fig. 3). The theoretical rms noise at 43 GHz was expected to be . Thus, fast frequency switching allowed us to use a half-hour solution interval in fringe fitting, and so gain much improved detection sensitivity.
The performance of the calibration technique can be demonstrated by comparing the measured phase noise to the expected phase noise. We have measured the rms of the cycle-to-cycle variations of the calibrated 43 GHz visibilities after a) only applying the scaled-up 15 GHz phase solutions and b) after correcting for the residual phase errors with a cycle of self-calibration using a 30 min solution interval. In case a), the rms was found to be in the beginning and end of the experiment (coinciding with dusk and dawn at the stations in the south-western US and with predominantly low elevations), and was in the middle of the observations (at night at most stations and at high elevations). In case b), the rms dropped slightly to and , respectively.
The expected phase noise in the visibilities calibrated with fast frequency switching consists of three parts (aside from long-term changes in electron content, the ionosphere does not contribute noticeable phase noise, and errors in the source model at are negligible). a) thermal phase noise at the reference frequency scaled by the frequency ratio, b) thermal phase noise at the target frequency and c) tropospheric phase changes during the two integrations. We estimate the three terms as follows, assuming that NGC 4261 has an average compact flux density of 200 mJy at 15 GHz and 100 mJy at both 43 GHz and 86 GHz. a) On a single baseline, the expected signal-to-noise ratio (SNR) of a detection at 15 GHz is 11.2 when averaging over the band. In fringe-fitting, this is increased by , where is the number of baselines. , so the SNR of a detection at 15 GHz increases to 31.7, corresponding to a phase error of . This error is scaled by the frequency ratio to at 43 GHz and at 86 GHz. b) The thermal noise contributions at 43 GHz and 86 GHz are and , respectively. c) We estimated the tropospheric phase noise within the switching cycle time using observations of 3C 273, which are essentially free of thermal noise and any phase changes during and between the half-cycles are due to changes in the troposphere. We found the median rms phase noise after fringe-fitting with a 30 min solution interval to remove the residual long-term phase drift to be at 43 GHz, or at 86 GHz.
Adding those three noise components in quadrature yields at 43 GHz and is in good agreement with the measured rms phase noise of .


5.2 86 GHz
Following the same data reduction path as for the 43 GHz data, we obtained good detections of NGC 4261 at 86 GHz on baselines among the four stations FD, KP, LA, and PT and only weak detections on baselines to NL, OV and MK. The corrected visibility phases are plotted in Fig. 4, and an image is shown in Fig. 5. The peak flux density is 59.3 mJy. To our knowledge, this is the first VLBI detection of \objectNGC 4261 at 86 GHz, and is probably the weakest continuum object ever detected with VLBI at this frequency.
With only delay calibration applied, the median rms phase noise of the baselines during the best 25 min scan is , after applying the scaled 15 GHz phase solutions is and after fringe-fitting with a 30 min solution interval is (the increase in rms phase noise after removal of phase rates has an unknown cause). We estimate the expected phase noise to consist of the scaled-up 15 GHz noise, , the thermal 86 GHz noise, , and the tropospheric phase errors, . Their quadrature sum is , in agreement with the measured noise levels.


6 Summary
We have demonstrated the feasibility of using fast frequency switching as a phase calibration method for 86 GHz VLBI, yielding the detection of the faintest source so far at that frequency. Although ionospheric effects prevented purely phase-referenced images and hence the detection of a core shift, the technique allows the detection of much fainter sources at 86 GHz than is possible with conventional VLBI. This includes nearby sources which can be imaged with unprecedented linear resolution and allow one to study the jet formation and collimation processes.
References
- Doeleman et al. (2001) Doeleman, S. S., Shen, Z.-Q., Rogers, A. E. E., Bower, G. C., Wright, M. C. H., Zhao, J. H., Backer, D. C., Crowley, J. W., Freund, R. W., Ho, P. T. P., Lo, K. Y., & Woody, D. P. 2001, AJ, 121, 2610
- Falcke et al. (2000) Falcke, H., Melia, F., & Agol, E. 2000, ApJ, 528, L13
- Gómez et al. (1999) Gómez, J., Marscher, A. P., & Alberdi, A. 1999, ApJ, 521, L29
- Middelberg et al. (2002) Middelberg, E., Roy, A. L., Walker, R. C., Falcke, H., & Krichbaum, T. P. 2002, in 6th European VLBI Network Symposium on New Developments in VLBI Science and Technology, ed. E. Ros, R. W. Porcas, A. P. Lobanov, & J. A. Zensus (Max-Planck-Institut für Radioastronomie), 61
- Porcas & Rioja (2002) Porcas, R. W. & Rioja, M. J. 2002, in 6th European VLBI Network Symposium on New Developments in VLBI Science and Technology, ed. E. Ros, R. W. Porcas, A. P. Lobanov, & J. A. Zensus (Max-Planck-Institut für Radioastronomie), 65