GOODS Discovery of a Significant Population of Obscured AGN 11institutetext: Yale Center for Astronomy and Astrophysics, Yale University, P.O. Box 208121, New Haven CT 06520-8121, USA
GOODS Discovery of a Significant Population of Obscured AGN
Abstract
We analysed the optical and infrared properties of X-ray sources in the Great Observatories Origins Deep Survey (GOODS), a deep, multiwavelength survey covering 0.1 square degrees in two fields. The HST ACS data111Based on observations obtained with the NASA/ESA Hubble Space Telescope, which is operated by the Association of Universities for Research in Astronomy (AURA), Inc., under NASA contract NAS5-26555. are well explained by a unified AGN scheme that postulates roughly 3 times as many obscured as unobscured AGN, as are the spectroscopic and photometric redshift distributions once selection effects are considered. Our model predicts infrared number counts of AGN that agree well with the preliminary Spitzer data, confirming that large numbers of obscured AGN are present in the early Universe ().
1 Why There Might be Obscured AGN at High Redshift
Luminous Active Galactic Nuclei (AGN) have been readily found throughout the Universe, primarily in surveys at radio, optical, ultraviolet, and X-ray wavelengths. These AGN (often called quasars) are ultimately powered by gravity, as matter from the host galaxy accretes onto a central supermassive black hole. The prevalence of AGN at redshifts indicates that that is the epoch of greatest black hole growth. It is also an epoch of strong star formation in young galaxies, one of several arguments that the growth of supermassive black holes must be closely tied to the formation of galaxies. Understanding the co-evolution of galaxies and black holes requires knowing the accretion history of supermassive black holes, via an accurate census of black hole demographics: how many there are, where they are, and what their masses are.
Although many thousands of AGN have been catalogued, most recently in the Sloan Digital Sky Survey (e.g., Richards et al., 2002; Anderson et al., 2003), the demographics of supermassive black holes has proved a surprisingly elusive goal. Very few “type 2 quasars”222“Type 2 quasars” are the luminous analogs of local Seyfert 2 galaxies, i.e., AGN lacking broad optical emission lines. According to the unification hypothesis for AGN, the central continuum and broad line region in type 2 AGN are obscured by high column densities of gas and dust ( cm-2) along the line of sight. have been found (e.g., Norman et al., 2002; Stern et al., 2002; Dawson et al., 2003). Of course, UV-excess or optical emission-line surveys would not have found most obscured AGN, nor would soft X-ray surveys such as the ROSAT All-Sky (Voges et al., 1999) or WGA (Singh et al., 1995) surveys. Instead, one needs to look at hard X-rays, where absorption is a smaller effect, or in the far-infrared, where the absorbed energy is re-radiated.
There are three good reasons to expect many supermassive black holes to be hidden behind a thick screen of gas and dust. First, local AGN conform well to the unification scenario, in which roughly 3/4 of all AGN are at least partly hidden from a direct line-of-sight (Antonucci, 1993). Second, the 2–40 keV spectrum of the X-ray background is very hard, much harder than the typical spectrum of an unobscured AGN (Mushotzky et al., 1993), yet high resolution X-ray imaging makes clear that the “background” is in fact summed emission from individual AGN (Giacconi et al., 1979). As X-ray astronomers have understood for nearly two decades, this means most AGN are absorbed by column densities in excess of atoms/cm2 (Setti & Woltjer, 1989; Madau, Ghisellini, & Fabian, 1994; Comastri et al., 1995; Gilli et al., 2001). Recent papers (Comastri et al., 2003; Worsley et al., 2004; Ueda et al., 2003; U03; see also Fabian, this volume) have argued that to explain the keV peak in the energy density of the X-ray background requires a substantial contribution from Compton-thick AGN (with obscuring column densities cm-2). Third, in the young Universe, where forming galaxies are often dusty and reddened, obscuration of the central AGN is even more likely. Thus, at traditional survey wavelengths, the strong line and nonthermal continuum emission by which AGN are selected and identified may be completely invisible.
Our strong reliance on optical identification has led many to argue that luminous obscured AGN, few of which have been found at high redshift, do not exist, and the obscuring material must be blown away in higher luminosity sources. While this possibility cannot be ruled out, it is certainly premature to explain the absence of obscured AGN from surveys that were remarkably insensitive to such objects.
2 Searching for Obscured AGN in GOODS
A strong motivation for the Great Observatories Origins Deep Survey (GOODS) was the discovery of obscured AGN. GOODS consists of deep imaging in the far infrared with the Spitzer Space Telescope (Dickinson & Giavalisco, 2002) and in the optical with the Hubble Space Telescope (Giavalisco et al., 2004) on the footprints of the two deepest Chandra fields (Giacconi et al., 2001; Brandt et al., 2001;Alexander et al., 2003). The total area is roughly 60 times larger than the original Hubble Deep Field (Williams et al., 1996) and nearly as deep in the optical. The Great Observatories data were augmented with ground-based imaging and spectroscopy.333GOODS observations are summarized at http://www.stsci.edu/science/goods/. More than 85% of the GOODS X-ray sources are AGN, with luminosities ergs/s; to avoid confusion with starburst galaxies, we limit our sample to X-ray sources above this luminosity threshold.
With extensive coverage over five decades in energy from 24 m to 8 keV, the GOODS survey is well suited to finding a high-redshift population of obscured AGN. A complementary approach, given the relatively low surface density of AGN compared to normal galaxies, is to target higher luminosity AGN over a wider area of the sky, an approach followed by the ChaMP (Green et al., 2004), CYDER (Castander et al., 2003), and HELLAS2XMM (Fiore et al., 2003) surveys, among others. Here we describe the AGN detected in the X-ray and optical in the GOODS North and South fields, which represent an order of magnitude more objects than in most previous works.
Most studies of black hole demographics begin with the AGN content of a given survey, correcting where possible for selection biases to infer the underlying population. If selection effects are strong, however, one ends up making large extrapolations using little information. We therefore took a different approach: we asked, if there is a substantial population of obscured AGN, what would be seen in a deep multiwavelength survey like GOODS? This work is presented by Treister et al. (2004a); here we briefly describe our assumptions and results.


We start with a very simple unification scheme for AGN, in which a central engine – well understood from studies of unobscured AGN – is surrounded by a dusty torus444Note that the geometry need not be a torus; we use this geometry simply to derive the distribution of absorbing column densities expected from random orientations. The resulting distribution matches well the observed one, with the proviso that Compton-thick sources are missing, but so would many other geometries. that absorbs optical through soft X radiation and re-radiates the absorbed energy as thermal infrared emission. We combine well-measured spectra of unobscured AGN with plausible reddening and absorption laws, and with the dust emission models of Elitzur et al. (2003) and Nenkova et al. (2002), to create a grid of spectra appropriate to increasing absorbing column densities along the line of sight to the AGN. The torus geometry was adjusted so that three-quarters of all AGN are obscured (i.e., have cm-2) and so the mid-plane column density is cm-2 (even the Chandra deep surveys are not sensitive to objects with higher column densities). We further assumed this geometry was independent of redshift and luminosity – the simplest assumption, and one that, frankly, we expected to prove wrong. We added an host galaxy spectrum to each AGN template spectrum. Finally, we assumed the most recent, hard-X-ray-selected luminosity function and luminosity-dependent density evolution given by Ueda et al. (2003; U03).
As shown in Figure 1, this very simple model explains very well the X-ray and optical counts in the GOODS fields. That it explains the X-ray counts is not too surprising since we start with a hard X-ray luminosity function and evolution derived from these fields, among others. For the optical, however, the agreement indicates that faint optical sources are primarily obscured AGN. Indeed, these tend to have red colors and hard X-ray spectra, as expected of obscured AGN.
These results mean that the GOODS HST data agree well with a population of obscured AGN extending from to well beyond . Specifically, the X-ray and optical properties of GOODS AGN are fully consistent with a very simple unification picture, requiring no modification with either redshift or AGN luminosity. The implication is that some X-ray-emitting AGN are missed in the Chandra Deep Field samples, and others lack optical spectroscopic identifications. Since the best 8- or 10-m class telescopes have an effective limit at mag, many obscured AGN will lack spectroscopic identification.
The redshift distribution is a critical point. The best population synthesis models for the X-ray background prior to the new Chandra and XMM deep fields (Gilli et al., 2001) incorporated a high-redshift population of obscured AGN that evolves similarly to the unobscured AGN, and hence predicted a redshift distribution peaking at . Yet observed redshift distributions from the Chandra Deep Fields and the Lockman hole peak at much lower redshifts (e.g., Hasinger, 2002; Barger et al., 2003). This has been taken as evidence of a fatal flaw in the population synthesis models.
We find the discrepancy does not imply any lack of obscured quasars at high redshift. Rather, it results from a combination of two factors: (1) the luminosity-dependent density evolution now measured for X-ray AGN, which was not used in the Gilli et al. (2001) models and which increases the fraction of AGN at lower luminosity and lower redshift, and more importantly, (2) the implicit spectroscopic limit for X-ray samples, which preferentially excludes the faint counterparts of high-redshift, obscured AGN.
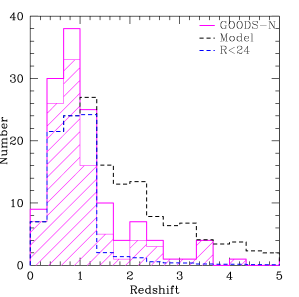
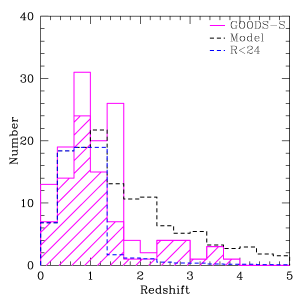
The latter point is illustrated in Figure 2, which shows the redshift distribution for GOODS AGN. The upper dashed line shows the predicted redshift distribution for our unified model, which still peaks above a redshift of 1, much like the earlier population synthesis models. If we impose a spectroscopic limit of mag, however, we obtain the lower dashed line, which agrees well with the observed spectroscopic redshift distribution. Note that the photometric redshifts are indeed shifted to higher redshifts compared to the spectroscopic redshifts, although they too miss the very faintest, highest redshift obscured AGN.
3 Spitzer Data and the Far-Infrared Properties of AGN
According to the unification scheme, dust and gas absorbs much of the luminous optical through X-ray AGN emission, and is thus heated. The absorbed energy is re-radiated as thermal emission, which should be readily visible in the far-infrared. A key element of the GOODS project is very deep imaging with the Spitzer observatory, in the IRAC bands from 3.6 to 8.4 microns and the MIPS 24-micron band. These data will provide a strong test of our unified model.
We used our simple unification model to predict the far-infrared source counts, in each Spitzer band, for the appropriate GOODS flux limits (Treister et al., 2004a). As of spring 2004, some IRAC data in the GOODS-S field were already in hand. We compared preliminary photometry of the AGN to our source count prediction. The results are shown in Figure 3 (van Duyne et al., in prep.), along with predictions for the 24-micron source counts. (The first GOODS MIPS data will be obtained in summer/fall 2004.)
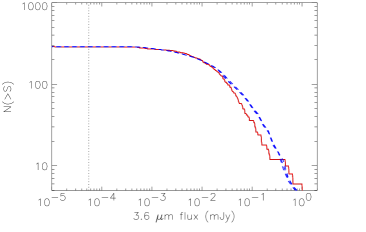
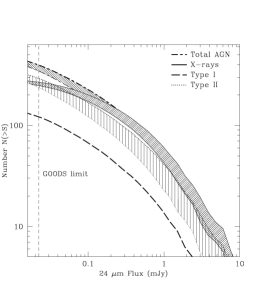
Certainly these early data require closer inspection, and the model awaits a stronger test from the full multiwavelength Spitzer data set. The pending data will allow us to verify whether large numbers of obscured AGN are indeed present in the early Universe, and will also be extremely important for refining the AGN model, specifically the covering factor, dust geometry, and evolution thereof. The 24-micron images are particularly powerful, since the AGN emission is most isotropic at the longest infrared wavelengths. Obscured AGN should be very bright far-infrared sources; those that are missed even by X-ray observations probably look like ultraluminous infrared galaxies.
We have looked at the spectral energy distributions of the GOODS AGN, including the available Spitzer data. Indeed, the hard X-ray sources with faint, red optical counterparts are extra-luminous in the Spitzer bands. Two example spectral energy distributions are shown in Figure 4 (van Duyne et al., in prep.). Both cases look just like a normal galaxies at optical wavelengths, but are revealed to be AGN by the luminous X-ray emission. They are clearly obscured by virtue of their faint optical magnitudes, hard X-ray spectra, and bright infrared fluxes.


4 Summary and Conclusions
The GOODS multiwavelength survey supports the idea of a significant population of obscured AGN persisting to high redshift. From a strictly observational viewpoint, we cannot rule out this population, and indeed, see every evidence for its existence. In a subsequent paper (Treister et al., 2004b) we explain the apparent decline in the ratio of obscured to unobscured AGN with redshift or luminosity, which is seen in several X-ray-selected AGN samples (Hasinger, 2004; U03), by the same selection effects against Compton thick and/or optically faint sources.
The data are consistent with a simple unified model of a luminous AGN nucleus obscured along some lines of sight by dust and gas. Our work is not strongly sensitive to the geometry, and other configurations of dust are equally possible as long as they predict a similar distribution of absorbing column densities. We are also not sensitive to the numbers of Compton-thick AGN, a population that will be probed with future X-ray missions sensitive in the energy range 10-100 keV. In any case, we conclude that at least 3/4 of all supermassive black holes are obscured by column densities of at least cm-2.
The unified model implies that half the obscured AGN are not detected in X-ray fields at the Chandra Deep Field depths. They should be clearly visible in the Spitzer data, although separating heavily obscured AGN from very luminous starbursts will not be simple. Upcoming Spitzer data, along with the integral constraint from the X-ray “background” spectrum, will better constrain the geometry and other properties of the obscuring material.
Individual spectral energy distributions of the AGN will also constrain the dust geometry, and perhaps the contribution from any starburst component. Bolometric corrections in the far-infrared are likely to be significant, and affect estimates of the mass accretion rate and thus the growth rate of supermassive black holes. Note that observed spectral energy distributions never represent the actual output from the AGN engine: the luminosity of unobscured AGN is overestimated (since the optical through soft X-ray emission is not isotropic), while obscured AGN appear under-luminous relative to their intrinsic power. Bolometric corrections can be calculated from models, such as those considered here, but can not be derived empirically for any highly anisotropic source. This is critical for understanding the energetics and structures of AGN.
One strong conclusion from our work is that one should look for obscured black holes where they can be easily found, namely in the far-infrared and hard X-ray. Any substantial and widespread obscuration has important implications for the cosmic accretion history of black holes, and for the average efficiency of converting gravitational potential energy to radiation.
Acknowledgements – This work, which was supported in part by NASA grant HST-GO-09425.13-A, owes a great deal to our colleagues in the GOODS project, particularly Yale graduate student Jeff van Duyne and the co-authors of the Treister et al. (2004a) paper.
References
- Alexander et al. (2003) Alexander, D. M., Bauer, F. E., Brandt, W. N., Schneider, D. P., Hornschemeier, A. E., Vignali, C., Barger, A. J., Broos, P. S., Cowie, L. L., Garmire, G. P., Townsley, L. K., Bautz, M. W., Chartas, G., & Sargent, W. L. W. 2003, AJ, 126, 539
- Anderson et al. (2003) Anderson, S. F., et al. 2003, AJ, 126, 2209
- Antonucci (1993) Antonucci, R. 1993, ARA&A, 31, 473
- Barger et al. (2003) Barger, A. J., Cowie, L. L., Capak, P., Alexander, D. M., Bauer, F. E., Fernandez, E., Brandt, W. N., Garmire, G. P., & Hornschemeier, A. E. 2003, AJ, 126, 632
- Brandt et al. (2001) Brandt, W. N., Alexander, D. M., Hornschemeier, A. E., Garmire, G. P., Schneider, D. P., Barger, A. J., Bauer, F. E., Broos, P. S., Cowie, L. L., Townsley, L. K., Burrows, D. N., Chartas, G., Feigelson, E. D., Griffiths, R. E., Nousek, J. A., & Sargent, W. L. W. 2001, AJ, 122, 2810
- Castander et al. (2003) Castander, F. J., Treister, E., Maza, J., Coppi, P. S., Maccarone, T. J., Zepf, S. E., Guzmán, R., & Ruiz, M. T. 2003, Astronomische Nachrichten, 324, 40
- Comastri et al. (1995) Comastri, A., Setti, G., Zamorani, G. & Hasinger, G. 1995, A&A, 296, 1
- Comastri et al. (2003) Comastri, A. & the HELLAS2XMM team 2003, Societa Astronomica Italiana Memorie Supplement, 3, 179
- Dawson et al. (2003) Dawson, S., McCrady, N., Stern, D., Eckart, M. E., Spinrad, H., Liu, M. C., & Graham, J. R. 2003, AJ, 125, 1236
- Dickinson & Giavalisco (2002) Dickinson, M. & Giavalisco, M. 2002, in The Mass of Galaxies at Low and High Redshift, in press, astro-ph/0204213
- Elitzur et al. (2003) Elitzur, M., Nenkova, M., & Ivezic, Z. 2003, astro-ph/0309040
- Fiore et al. (2003) Fiore, F., et al. 2003, A&A, 409, 79
- Giacconi et al. (1979) Giacconi, R., Bechtold, J., Branduardi, G., Forman, W., Henry, J. P., Jones, C., Kellogg, E., van der Laan, H., Liller, W., Marshall, H., Murray, S. S., Pye, J., Schreier, E., Sargent, W. L. W., Seward, F., & Tananbaum, H. 1979, ApJ, 234, L1
- Giacconi et al. (2001) Giacconi, R., Rosati, P., Tozzi, P., Nonino, M., Hasinger, G., Norman, C., Bergeron, J., Borgani, S., Gilli, R., Gilmozzi, R., & Zheng, W. 2001, ApJ, 551, 624
- Giavalisco et al. (2004) Giavalisco, M. et al. 2004, ApJ, 600, L93
- Gilli et al. (2001) Gilli, R., Salvati, M., & Hasinger, G. 2001, A&A, 366, 407
- Green et al. (2004) Green, P. J., et al. 2004, ApJS, 150, 43
- Hasinger (2002) Hasinger, G. 2002, in New Visions of the X-ray Universe in the XMM-Newton and Chandra Era, Ed. F. Jansen (ESTEC: ESA SP-488), XX (astro-ph/0202430)
- Hasinger (2004) Hasinger, G. 2004, Nucl. Phys. Proc. Suppl., 132, 86
- Madau, Ghisellini, & Fabian (1994) Madau, P., Ghisellini, G., & Fabian, A. C. 1994, MNRAS, 270, L17
- Mobasher et al. (2004) Mobasher, B. et al. 2004, ApJ, 600, L167
- Mushotzky et al. (1993) Mushotzky, R. F., Done, C., & Pounds, K. A. 1993, ARA&A, 31, 717
- Nenkova et al. (2002) Nenkova, M., Ivezić, Ž., & Elitzur, M. 2002, ApJ, 570, L9
- Norman et al. (2002) Norman, C., Hasinger, G., Giacconi, R., Gilli, R., Kewley, L., Nonino, M., Rosati, P., Szokoly, G., Tozzi, P., Wang, J., Zheng, W., Zirm, A., Bergeron, J., Gilmozzi, R., Grogin, N., Koekemoer, A., & Schreier, E. 2002, ApJ, 571, 218
- Richards et al. (2002) Richards, G. T., et al. 2002, AJ, 123, 2945
- Setti & Woltjer (1989) Setti, G., Woltjer, L. 1989, A&A, 224L, 21
- Singh et al. (1995) Singh, K. P., Barrett, P., White, N. E., Giommi, P., & Angelini, L. 1995, ApJ, 455, 456
- Stern et al. (2002) Stern, D., Moran, E. C., Coil, A. L., Connolly, A., Davis, M., Dawson, S., Dey, A., Eisenhardt, P., Elston, R., Graham, J. R., Harrison, F., Helfand, D. J., Holden, B., Mao, P., Rosati, P., Spinrad, H., Stanford, S. A., Tozzi, P., & Wu, K. L. 2002, ApJ, 568, 71
- Szokoly et al. (2004) Szokoly, G. et al. 2004, ApJS in press, astro-ph/0312324
- Treister et al. (2004a) Treister, E. et al. 2004a, ApJ in press, arXiv:astro-ph/0408099.
- Treister et al. (2004b) Treister, E. et al. 2004b, ApJ submitted.
- Ueda et al. (2003; U03) Ueda, Y., Akiyama, M., Ohta, K., & Miyaji, T. 2003, ApJ, 598, 886 (U03)
- Voges et al. (1999) Voges, W. et al. 1999, A&A, 349, 389
- Williams et al. (1996) Williams, R. E., et al. 1996, AJ, 112, 1335
- Worsley et al. (2004) Worsley, M. A., Fabian, A. C., Barcons, X., Mateos, S., Hasinger, G., & Brunner, H. 2004, MNRAS, 352, L28