Variability and rotation of ultra cool dwarfs
Abstract
Over the past few years monitoring programs have shown ultra cool dwarfs (UCDs) to be photometrically variable. Of the 60 sources monitored in the field and some 120 monitored in clusters, about 40% show variability in both cases. For mid to late M dwarfs in young (100 Myr) clusters, this variability is generally periodic with amplitudes of up to a few tenths of a magnitude and periods of between a few hours and several days. For older field dwarfs (covering late M, L and T types) this variability is often nonperiodic with smaller amplitudes (up to 0.1 mag in I) and timescales of order hours. The former may be attributed to the rotational modulation of magnetically-induced photospheric spots, as seen in higher mass T Tauri stars. The nonperiodic variability, on the other hand, may be caused by a rapid evolution of surface features (which ‘mask’ the otherwise observable rotational modulation). This could be related to the formation and dissipation of inhomogeneities in dust clouds in the photospheres of UCDs.
keywords:
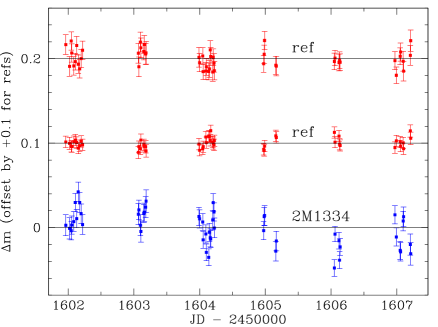
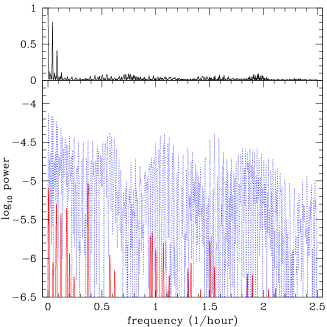
brown dwarfs – ultra cool dwarfs – atmospheres – variabilityWork over the past few years by several groups has shown strong evidence for low amplitude photometric variability in both field and cluster very low mass stars and brown dwarfs (collectively, ultra cool dwarfs, or UCDs). An example light curve and power spectrum is shown in Fig. 1.
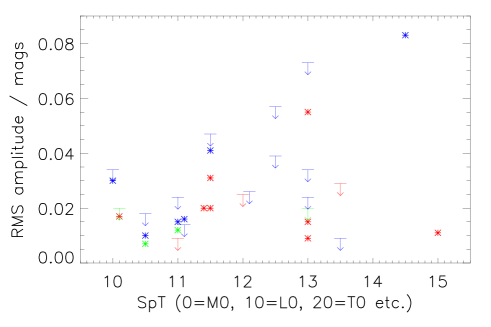
For the field UCDs, variability timescales are typically of order a few hours with amplitudes of between 0.01 and 0.08 mags in the I band. Fig. 2 shows the variability detection amplitudes and upper limits as a function of spectral type. There is no particular correlation, also not with the amplitudes against spectral type.
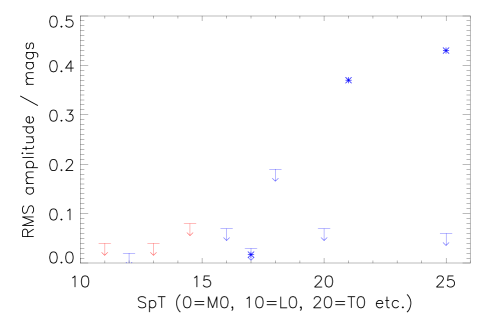
In several cases, the variability in UCDs has been found to be non-periodic. This is curious, as in many cases the monitoring surveys would have been sensitive to expected UCD rotation periods (see Fig. 3). Bailer-Jones & Mundt (2001) interpreted this with a masking hypothesis: If surface evolve on a timescale shorter than the rotation period, these will obscure a regular modulation of the light curve.


An analysis of the literature shows that UCD variability is quite common. I have collated these results into Tables 1 and 2 for field UCDs and cluster UCDs respectively. My literature search tries to include all relevant work in the refereed literature as of mid 2004. All surveys are in the I-band, except Enoch et al. 2002 (K band), Bailer-Jones & Lamm 2003 (J and K bands) and Tinney & Tolley 1999 (two narrow bands). The issue of a detection or non-detection is somewhat arbitrary for marginal cases, as it depends on the statistical test and threshold used. As far as is possible, I have converted values to a common 99% confidence level for variability detection. One must obviously be very careful in comparing results from different surveys, as they differ in their sensitivity limits, target selection, spectral types etc. Keeping this in mind, it appears that both cluster and field UCDs show a similar variability fraction of 30–40% down to optical and near infrared amplitudes greater than 0.5–1%. However, cluster UCDs are more likely to show periodic variability – presumably a rotational – whereas the field UCDs often display non-periodic variability. Thus while both sets are rapid rotators, it seems that surface features evolve more rapidly on field UCDs.
| Reference | #var | #non | fraction |
|---|---|---|---|
| Bailer-Jones & Mundt 2001 | 8 | 3 | 73% |
| Bailer-Jones & Lamm 2003 | 0 | 3 | 0% |
| Clarke et al. 2002a | 2 | 2 | 50% |
| Clarke et al. 2002b | 1 | 0 | 100% |
| Enoch et al. 2002 | 3 | 6 | 33% |
| Gelino et al. 2002 | 6 | 12 | 33% |
| Koen 2003 | 3 | 9 | 25% |
| Martin et al. 2001 | 1 | 0 | 100% |
| Tinney & Tolley 1999 | 1 | 1 | 50% |
| TOTAL | 25 | 36 | 41% |
| Reference | #var | #non | fraction | |
| Joergens et al. 2003 | C | 5 | 5 | 50% |
| Bailer-Jones & Mundt 2001 | P | 1 | 4 | 20% |
| Scholz & Eislöeffel 2004a | P | 12 | 14 | 46% |
| Terndrup et al. 1999 | P | 2 | 6 | 25% |
| Bailer-Jones & Mundt 2001 | S | 3 | 3 | 50% |
| Caballero et al. 2004 | S | 11 | 17 | 39% |
| Scholz & Eislöeffel 2004b | S | (23) | ( 72) | (24%) |
| Zapatero Osorio et al. 2003 | S | 1 | 0 | 100% |
| TOTAL | 35 | 49 | 42% | |
| (58) | (121) | (32%) |
There are at least two plausible candidates for causing the variability. The first is cool, magnetically-induced spots. This is an attractive explanation for cluster UCDs: as these are young, they may show activity with spots appearing in analogy to weak-lined T Tauri stars. However, Gelino et al. (2002) and Mohanty et al. (2003) have argued against the presence of spots at these very low temperatures because of the neutrality of the photosphere and thus a weak coupling between the gas and any magnetic field. A second explanation is dust clouds. Dust is known to form at these low temperatures. Rapid rotation and convection could give rise to complex atmospheric dynamics, possibly accounting for the non-periodic variability seen in field L and T dwarfs.
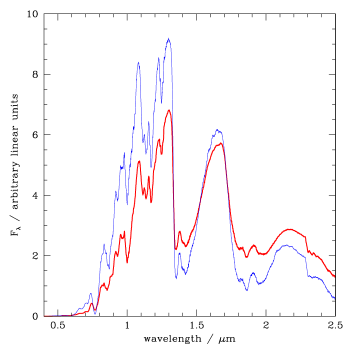
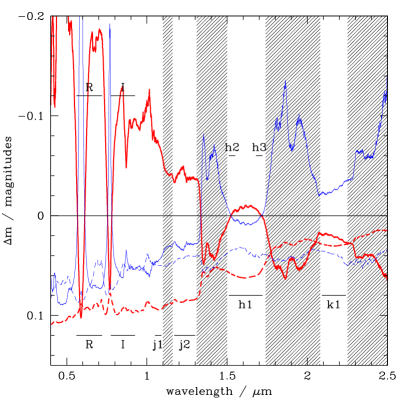
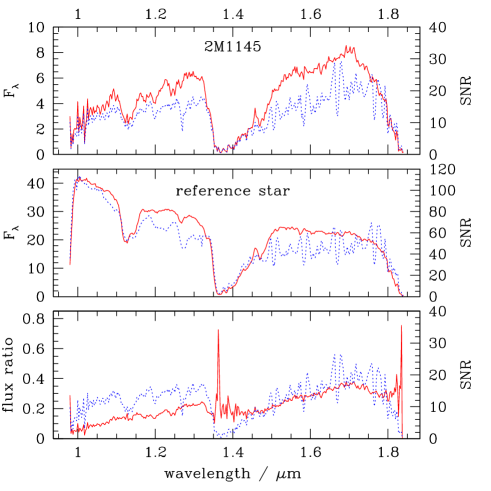
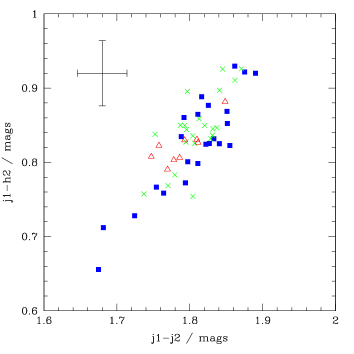
I have made initial attempts to predict and observe the spectroscopic signatures of different types of spot and cloud patterns (Bailer-Jones 2002), as shown in Figs. 4 and 5. To test these predictions, I obtained time-resolved differential spectrophotometric observations of one field L1.5 dwarf. Spectra were obtained relative to a reference star observed simultaneously in the slit (see Fig. 6). There is no strong evidence for variability in any single band, but there is evidence for colour-correlated variability (Fig. 7). Adopting a dusty atmosphere with = 1900 K, this limits coherent clear clouds to a coverage of no more than 10–15% and 200 K cooler spots to a 20% coverage.
Ongoing work is aimed at better characterizing UCD variability and achieving higher sensitivity. Recent observations have been obtained of several UCDs (see Fig. 8). I am also extending this work to field M dwarfs and T dwarfs. Other useful observational signatures include polarimetry and high resolution monitoring of line profiles (Doppler imaging).

References
- [] Allard F., Hauschildt P.H., Alexander D.R., Tamanai A., Schweitzer A., 2001, ApJ 556, 357
-
[]
Bailer-Jones C.A.L., Mundt R., 2001, A&A 367, 218
(Erratum: A&A 374, 1071) - [] Bailer-Jones C.A.L., 2002, A&A 389, 963
- [] Bailer-Jones C.A.L., Lamm M., 2003, MNRAS 339, 477
- [] Bailer-Jones C.A.L., 2004, A&A 419, 703
- [] Caballero J.A., Béjar V.J.S., Rebolo R., Zapatero Osorio M.R., 2004, A&A, in press
- [] Clarke F.J., Tinney C.G., Covey K.R., 2002a, MNRAS 332, 361
- [] Clarke F.J., Oppenheimer B.R., Tinney C.G., 2002b, MNRAS 335, 1158
- [] Enoch M.L., Brown M.E., Burgasser A.J., 2003, AJ 126, 1006
- [] Gelino C.R., Marley M.S., Holtzman J.A., Ackerman A.S., Lodders K., 2002, ApJ 577, 433
- [] Joergens V., Fernandez M., Carpenter J.M., Neuhäuser R., 2003, ApJ 594, 971
- [] Koen C., 2003, MNRAS 346, 473
- [] Martín E.L., Zapatero Osorio M.R., Lehto H.J., 2001, ApJ 557, 822
- [] Mohanty S., Basri G., Shu F., Allard F., Chabrier G., 2002, ApJ 571, 469
- [] Scholz A., Eislöffel J., 2004a, A&A 421, 259
- [] Scholz A., Eislöffel J., 2004b, A&A 419, 249
- [] Terndrup D.M., Krishnamurthi A., Pinsonneault M.H., Stauffer J.R., 1999, ApJ 118, 1814
- [] Tinney C.G., Tolley A.J., 1999, MNRAS 304, 119
- [] Zapatero Osorio M.R., Caballero J.A., Béjar V.J.S., Rebolo R., 2003, A&A 408, 663