Absorption Line Study of Halo Gas in NGC 3067 Toward the Background Quasar 3C 232
Abstract
We present new H I 21 cm absorption data and ultraviolet spectroscopy from HST/STIS of the QSO/galaxy pair 3C 232/NGC 3067. The QSO sightline lies near the minor axis and (11 kpc) above the plane of NGC 3067, a nearby luminous ( km s-1, ) starburst galaxy with a moderate star formation rate of 1.4 M☉ yr-1. The UV spectra show that the Si IV and C IV doublets have the same three velocity components at , 1417, and 1530 km s-1 found in Ca II H & K, Na I D, Mg I, Mg II, and Fe II, implying that the low and high ionization gas are both found in three distinct absorbing clouds (only the strongest component at 1420 km s-1 is detected in H I 21 cm). The new Ly observation allow the first measurements of the spin and kinetic temperatures of halo gas: K and . However, while a standard photoionization model can explain the low ions, the C IV and Si IV are explained more easily as collisionally-ionized boundary layers of the photoionized clouds. Due to their small inferred space velocity offsets (, , and +170 km s-1) relative to the nucleus of NGC 3067 and the spatial coincidence of low and high ionization gas, we propose that these absorbers are analogous to Galactic high velocity clouds (HVCs). A comparison of the NGC 3067 clouds and Galactic HVCs finds similar H I column densities, kinematics, metallicities, spin temperatures, and inferred sizes. We find no compelling evidence that any halo gas along this sightline is escaping the gravitational potential of NGC 3067, despite its modest starburst.
1 Introduction
Starburst-driven superwinds, powered by the cumulative effect of coeval supernova explosions, have long been suggested as a mechanism by which metals and energy can be transported from galaxies to enrich their surroundings (e.g., De Young, 1978; Heckman, 1998). However, observations have yet to prove that starburst galaxies commonly generate winds that are capable of escaping the galaxy’s gravitational potential. Most studies measure the wind velocity near the disk of a starburst galaxy. Using such velocities to try to determine whether the wind is gravitationally bound to the galaxy is not straightforward, however, since the expanding superbubble will inevitably sweep up gas as it travels through the galactic halo, causing the wind to decelerate.
The spatial extent of wind gas can be measured by H or X-ray imaging (Watson, Stanger, & Griffiths, 1984; Martin, 1999; Martin, Kobulnicky, & Heckman, 2002) and follow-up spectroscopy can determine the wind velocity. The X-ray images themselves allow one to measure the wind temperature, which is found to be nearly constant as a function of a galaxy’s maximum H I rotation speed (Martin, 1999), suggesting that superwinds are more likely to escape from dwarf galaxies than more massive ones. These emission line studies are limited to studying the densest regions of wind gas, however, and cannot measure the full extent of the gas or the wind velocity in the diffuse halo.
Given a suitably bright background source, typically the stellar continuum of the starburst region itself, high velocity wind gas can also be detected in absorption (e.g., Heckman et al., 2000, 2001). Such studies detect typical outflow velocities of 400-1000 km s-1, although the outflow velocities in dwarf galaxies can be considerably lower (Heckman et al., 2000; Martin, 2003). While absorption line studies are more sensitive to diffuse gas than emission line studies, they suffer from an ambiguity in the distance between the background source and the absorbing gas. These studies can only definitively state that the absorber lies in front of the background source and yield no information about how far in front of the source the absorber lies. Since absorption line studies of galactic winds typically use the starburst itself as a background source, they cannot differentiate between a high velocity outflow in the galactic halo or within the starburst region.
Currently, the only method that directly measures the properties of the superwind gas well away from its parent galaxy relies on searching for absorption from the wind gas against a bright background QSO (e.g., Stocke et al., 2004). Unfortunately, coincidences of a bright () QSO and a low- galaxy separated by kpc in projection are exceedingly rare; only are known to exist over the entire sky, and most of the galaxies in these pairs are not starbursts. Thus, a systematic study of galaxy winds with this technique is not yet possible, although much can be learned by observing those QSO/galaxy pairs that do exist.
Rest-frame ultraviolet absorption line spectroscopy of bright QSOs is a very sensitive tracer of diffuse gas in interstellar and intergalactic space. For example, the weakest Ly absorption lines detected by the Hubble Space Telescope (HST) probe gas at H I column densities, , comparable to the weakest Ly lines detected in Keck and VLT ground-based spectra at high redshift. Associated metal-line absorptions are commonly found in individual H I absorbers down to and pixel addition techniques cumulatively detect Si III, C IV, and O VI absorptions down to (Schaye et al., 2003; Aguirre et al., 2004; Simcoe, Sargent, & Rauch, 2004). Given that the number density of Ly absorbers greatly increases both with increasing redshift and with decreasing column density, a “unified” model for these absorbers places them all in the extended halos of bright galaxies (e.g., Steidel, 1995; Lanzetta et al., 1995). However, the radii of such halos become implausibly large at for the weak () Ly and metal line systems: kpc for L∗ galaxies. A more recent interpretation (Stocke, Shull, & Penton, 2005) suggests that, while the higher column density absorbers could be the bound halos of bright galaxies, the weaker absorbers arise in unbound galaxy winds produced by the much more numerous low luminosity galaxies ().
QSO absorption line systems with column densities in the range to cm-2, known as Lyman limit systems (LLSs), are associated with bright (-0.3) galaxy halos as shown by Steidel (1995, 1998). Steidel found that 55 of the 58 LLS absorbers with Mg II equivalent widths Å in his sample at were associated with bright galaxies at the same redshift within a projected distance of 50 kpc. Follow-up spectra of the underlying stellar kinematics in these galaxies (Steidel et al., 2002) and HST imaging and UV spectra of the C IV absorption in these systems (Churchill et al., 2000) further indicate that LLSs are the bound gaseous halos of luminous galaxies and that in many cases these halos share the kinematics of the underlying stellar disk.
3C 232/NGC 3067 is a well-studied QSO/galaxy pair in which the QSO sightline probes the gaseous galaxy halo of a low- spiral galaxy (Burbidge et al., 1971). The 3C 232 sightline lies near the minor axis of NGC 3067 and is located (11 kpc projected) above the galactic plane. NGC 3067 is a luminous (, ; de Vaucouleurs et al., 1991; Marzke, Huchra, & Geller, 1994) nearly edge-on spiral ( degrees; Rubin, Thonnard, & Ford, 1982) with a radial velocity of km s-1 (Carilli & van Gorkom 1992, hereafter CvG ) and a far infrared luminosity of ergs s-1 (Shapley, Fabbiano, & Eskridge, 2001), which corresponds to a star formation rate (SFR) of 1.4 M☉ yr-1 (Misiriotis et al., 2004). The SFR of NGC 3067 is somewhat less than that of other nearby luminous () starbursts like NGC 253 (), NGC 3079 (), and NGC 4945 (; de Vaucouleurs et al., 1991; Marzke et al., 1994; Shapley et al., 2001; Misiriotis et al., 2004; Grimm, Gilfanov, & Sunyaev, 2003). Thus, one would expect NGC 3067 to produce a wind similar to but perhaps weaker than those of other starburst galaxies in the local Universe.
H I 21 cm absorption against 3C 232 was first detected near the redshift of NGC 3067 at km s-1 by Haschick & Burke (1975), who conjectured that the absorption was caused by H I in the outermost regions of NGC 3067. CvG observed 3C 232/NGC 3067 in H I 21 cm emission at resolution using the VLA and found H I distributed slightly asymmetrically (the 21 cm emission extends further to the east of the kinematic center than to the west, and the kinematic center is offset from the optical center) at velocities ranging from 1310 to 1635 km s-1. CvG also found a region of extended emission north and south of NGC 3067 with velocities ranging from 1350 to 1550 km s-1, from which the 21 cm absorption seen toward 3C 232 arises. CvG speculated that the extended emission is caused either by extended spiral arms, which may be the result of a past encounter with an as-yet undetected companion, or by viewing gas in a polar ring that is seen nearly face-on. In the former case we would expect the H I seen above and below the plane of NGC 3067 to be rotating in the same direction as the underlying disk; in the latter case the space velocity field is less well-constrained.
Metal lines have also been detected along the 3C 232 sightline at the same velocity as the H I 21 cm absorption found by Haschick & Burke. Boksenberg & Sargent (1978) found Ca II H and K at km s-1 with the Hale 5m. Stocke et al. (1991, hereafter S (91)) used the Multiple Mirror Telescope to find three separate velocity components in Ca II H & K and Na I D at , and km s-1 and Tumlinson et al. (1999, hereafter T (99)) used the Goddard High Resolution Spectrograph (GHRS) aboard HST to discover that Mg I, Mg II, and Fe II absorption lines show evidence for the same three velocity components that S (91) found in Na I and Ca II, although the Mg II lines are highly saturated and could cover this entire velocity range. None of these spectra preclude weaker absorption at velocities intermediate to the three strong systems.
The NGC 3067 halo cloud probed by the 3C 232 sightline has been used to set both an upper limit based upon H imaging (; S, 91) and a lower limit based upon Mg II/Mg I absorption line ratios (; T, 99) on the extragalactic ionizing flux (Iν). The H images also yielded a limit on the escape fraction of ionizing radiation from the disk of NGC 3067 to the halo locations probed by the 3C 232 sightline of % (T, 99). This value is comparable to the most recently derived -2% for the Galaxy from H images of high velocity clouds (HVCs; Putman et al., 2003).
This paper presents H I 21 cm and ultraviolet spectra of 3C 232 to determine if the multiple velocity components found by S (91) and T (99) along this sightline are present in H I Ly, Si IV, and C IV. In §2 we describe our radio and UV observations and analysis. In §3 we hypothesize that the multiple velocity components found by S (91) correspond to HVCs around NGC 3067 and compare the properties of these clouds to those of Galactic HVCs. In §4 we summarize our findings and discuss the evidence for unbound starburst winds in light of our results.
2 Observations and Data Reduction
Our full dataset includes previously-published optical and UV spectra of 3C 232 (S, 91; T, 99) and published Very Large Array (VLA) H I emission maps (CvG, ), as well as new H I 21 cm observations with the Very Long Baseline Array (VLBA) and the Arecibo radio telescope and new HST low and medium resolution far-UV spectra obtained with the Space Telescope Imaging Spectrograph (STIS). The H I 21 cm and HST/STIS observations are described below, while the previously published data will be described as needed in §3.
2.1 VLBA Observations
High angular resolution observations of 3C 232 were carried out at 1413.7 MHz on 2002 January 31 using the VLBA, which is operated by NRAO555The National Radio Astronomy Observatory (NRAO) is a facility of the National Science Foundation operated by Associated Universities, Inc.. The bandwidth of the observations was 8 MHz, in each of the right- and left-hand circular polarizations, sampled at two bits and centered at the frequency of the H I 21 cm line, at a heliocentric redshift of , or km s-1. The data were correlated at the VLBA correlator in Socorro, New Mexico, with 1024-point spectral resolution per baseband channel and 4 s correlator integration time. The resulting channel separation was 7.8 kHz (1.7 km s-1). The total observing time was 11.7 hr. Along with 3C 232, the radio source J0927+3902 was observed at the same frequency as a fringe finder and a bandpass calibrator. Data reduction and analysis were performed using the Astronomical Image Processing System (AIPS), and the Astronomical Information Processing System (AIPS++), of NRAO.
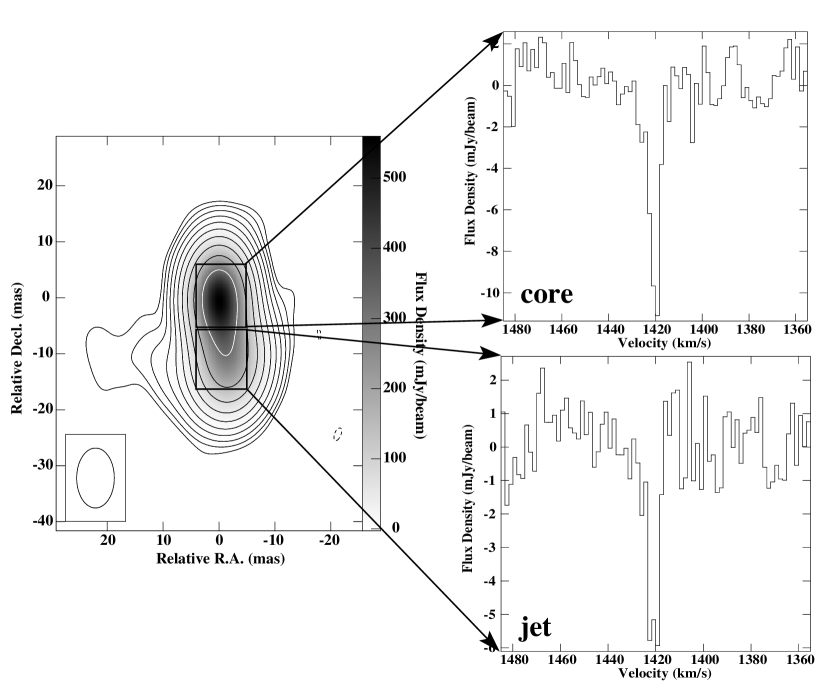
Figure 1 shows our high resolution L-band continuum image of 3C 232 with mas resolution, along with H I absorption spectra averaged over two regions. The image was obtained by using the CLEAN algorithm as implemented in AIPS, with an intermediate grid weighting (Robust=+2 in IMAGR). The continuum source consists of a compact core and a jet structure extending to the south, with a weaker extension to the east (but see Figure 2). A small amount of additional, very low surface brightness flux exists on the 500 mas scale (Condon et al., 1998). Table 1 lists the results of fitting Gaussian models to the observed spatial profile for the source components listed in column 1. We designate the two regions of 3C 232 toward which the spectra in Figure 1 have been extracted as core and jet. No H I absorption larger than mJy beam-1 is detected toward other continuum regions in 3C 232. The velocity full width at half maximum (FWHM) of the H I absorption is km s-1 centered at km s-1. No H I absorption is detected at 1369 and 1530 km s-1, in contrast to where metal lines appear in optical and UV data (S, 91; T, 99).
| Relative Positionaa The position (0,0) is , . | Peak | Total | Majorbb Errors are mas | Minorbb Errors are mas | P.A. | ||
|---|---|---|---|---|---|---|---|
| Source | (mas) | (mJy beam-1) | (mJy) | (mas) | (mas) | () | |
| core | 0 , 0 | 8.7 | 4.7 | ||||
| jet | 1.5W, 11S | 11.0 | 6.1 | ||||
| east. ext. | 7.5E, 14S | 8.3 | 4.8 |
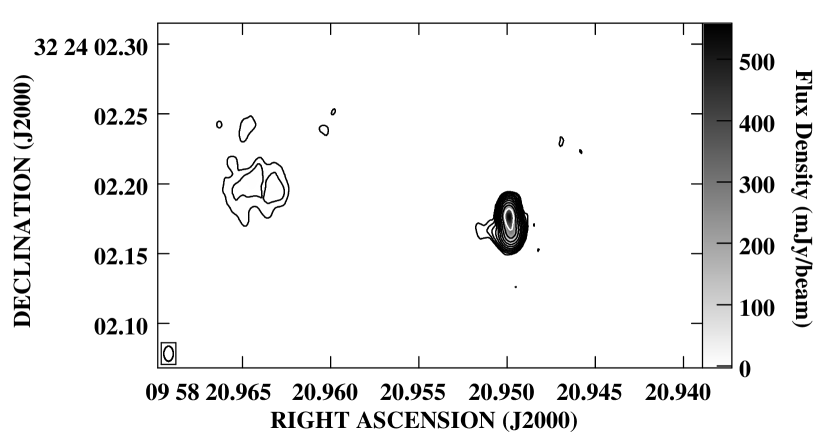
Figure 2 is a wide field continuum image with the same angular resolution as Figure 1, showing an extended structure at an angular distance of mas to the east of the main continuum structure of 3C 232. A gaussian fit to this structure results in a total flux density of mJy, and a size at full width half maximum of mas on the plane of the sky. No H I absorption larger than 3 mJy beam-1 is detected toward this diffuse continuum emission region.
The peak optical depth values in the core and the jet regions are % and %, respectively, which yields column densities () of H I absorption of and for the core and jet regions, respectively. An absorber with this column density would cause a flux decrement of mJy beam-1 against the eastern extension of the jet (see Figure 1) and mJy beam-1 against the diffuse emission region in Figure 2. Since the detection limit in these regions is 4.7 mJy beam-1, we cannot exclude the possibility that the H I absorption is constant over a region extending at least 20 mas (2 pc) and possibly as large as (20 pc) on the sky.
CvG measured the column density of H I 21 cm emission toward 3C 232 to be using the VLA ( beam). Comparing this value with the derived from our VLBA H I absorption observations, we derive a hydrogen spin temperature of . Of course, this value assumes that the H I 21 cm emission and absorption have comparable physical extent.
2.2 Arecibo Observations
Single dish observations of 3C 232/NGC 3067 were carried out with the L-band Wide receiver of the 305 m Arecibo radio telescope666The Arecibo Observatory is part of the National Astronomy and Ionosphere Center, which is operated by Cornell University under a cooperative agreement with the National Science Foundation. on 2003 November 23-24, for a total of 2.5 hr. The double position switching observations utilized two of the interim correlator boards to observe at the frequency of the H I 21 cm line in NGC 3067. The bandwidth of each board was 6.25 MHz, with one linear polarization each and 2048 spectral channels. The source 4C+32.34 was observed as a bandpass calibrator.
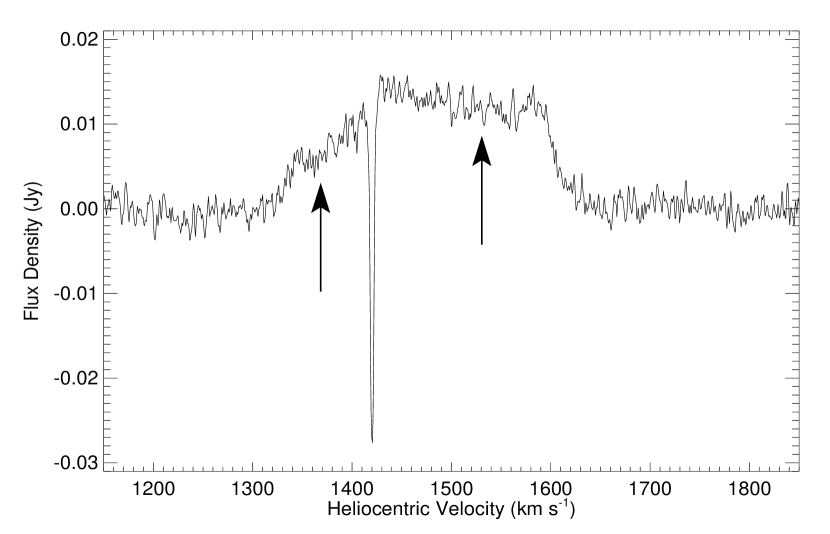
Figure 3 is a total intensity Hanning-smoothed H I spectrum of 3C 232/NGC 3067. The plot clearly shows the km s-1 wide H I 21 cm emission in NGC 3067, and the narrow H I 21 cm absorption line that arises on the line of sight to the background quasar 3C 232 at km s-1. The velocity resolution of this spectrum is 1.3 km s-1, and the rms noise level is 1.2 mJy. The velocity FWHM of the 21 cm absorption is km s-1 and its peak optical depth is , yielding a column density of . While the single dish optical depth is marginally larger than the VLBA measurements, these observations suggest no strong variation in covering factor or over a size scale of , or 20 pc. Again using the H I 21 cm emission column density found by CvG , this value corresponds to a hydrogen spin temperature of K, which agrees with the spin temperature calculated from the VLBA column density to within errors.
No H I absorption is detected at the two other metal-line velocities to . Assuming a spin temperature of K and the same velocity width as the 1420 km s-1 absorption line, this optical depth limit corresponds to a column density limit of cm-2. Notice that the three metal line velocities are well within the extent of the disk rotation curve.
| Wavelength Coverage | Resolution | Usable Exposure Time | ||
|---|---|---|---|---|
| Setting | (Å) | (km s-1) | Date of Observation | (s) |
| 1 | 1372-1428 | 20 | 2001 Oct 29 | 11,178 |
| 2 | 1194-1250 | 25 | 2001 Oct 30-31 | 11,178 |
| 3 | 1540-1594 | 20 | 2002 Jan 02 | 8,208 |
| 1540-1594 | 20 | 2002 Jan 04 | 14,098 | |
| 4 | 1150-1700 | 250 | 2003 Mar 04 | 1,200 |
2.3 HST/STIS Observations
3C 232 was observed by HST/STIS777Based on observations with the NASA/ESA Hubble Space Telescope, obtained at the Space Telescope Science Institute, which is operated by the Association of Universities for Research in Astronomy, Inc., under NASA contract NAS5-26555. with the G140L grating as part of GO Snapshot Program 9506 (J. Stocke, PI), and also with the G140M grating at three wavelength settings as part of GO Program 8596 (M. Pettini, PI). A journal of these observations appears in Table 2; total exposure times were 1.2 ksec with G140L, 11.2 ksec with G140M at central wavelengths of 1222 and 1400 Å, and 22.3 ksec with G140M at a central wavelength of 1567 Å. Multiple exposures with the same central wavelength were shifted to a heliocentric reference frame and coadded with signal-to-noise weighting. The continuum in each wavelength region was normalized using Legendre polynomials and the resulting spectra were examined for evidence of absorption from NGC 3067. These normalized spectra are shown in Figure 4 and absorption lines associated with NGC 3067 are labelled at their observed wavelengths.

The G140L spectrum yields data on Ly, O I, C II, C IV, Si II, Si III, Si IV, S II, S III, and Al II. All of the prominent Si and C lines in the wavelength range covered by this spectrum are detected over a wide range of ionization states. The resolution of this spectrum is too coarse (250 km s-1; see Table 2) to separate the blended S III/Si II and S II/Si II lines; however, since the oscillator strengths of the Si II lines in these blends are 1-2 orders of magnitude stronger than those of the S lines and we detect no S II 1251 or S II 1254 absorption in our spectrum, these blended lines primarily reflect the properties of the Si II ions. Likewise, these values are the combined equivalent widths of all three velocity components detected in other metals in this sightline, as the resolution of this spectrum is too coarse to separate the components found by S (91) and T (99), which have a maximum separation of km s-1. Therefore, we analyzed the higher resolution (20-25 km s-1) G140M spectra to search for these velocity components. Measured radial velocities and equivalent widths for the species detected in the G140L spectrum are shown in Table 3.
| Ion | aa Tabulated recession velocities are heliocentric. | bb Lines without a reported column density were measured from the G140L spectrum. All other lines were measured from the G140M spectra. | Wλ | |
|---|---|---|---|---|
| (Å) | (km s-1) | (cm-2) | (Å) | |
| S III/Si II | 1190.2, 1190.4 | |||
| Si III | 1206.5 | |||
| Ly | 1215.7 | |||
| S II/Si II | 1259.5, 1260.4 | |||
| O I | 1302.2 | |||
| Si II | 1304.4 | |||
| C II | 1334.5 | |||
| Si IV | 1393.8, 1402.8 | |||
| Si IV Total: | ||||
| Si II | 1526.7 | |||
| C IV | 1548.2, 1550.8 | |||
| C IV Total: | ||||
| Al II | 1670.8 |
Voigt profiles were fitted to the Ly, Si III, Si IV, and C IV absorption features in the G140M data. While the Ly absorption shows no sign of velocity structure, the small velocity offsets associated with the multiple metal-line components would not be detectable due to the wide damped Ly profile. No clear velocity substructure is present in the Si III 1207 absorption feature from NGC 3067 at Å either, although the trough of the absorption feature spans velocities from -1650 km s-1 (see Figure 5). The expected location of the N I 1200 absorption feature at the redshift of NGC 3067 lies in the middle of the Galactic Si III 1207 absorption, so we cannot comment on its strength.
In order to determine the most robust values of the recession velocity and the column density, the observed Ly profile was fit by a Voigt profile with constant -value and varying and in order to minimize the of the fit. The equivalent width of the best-fit profile was calculated from the corresponding model parameters, not from a direct non-parametric measurement of the absorption. The best-fit recession velocity, column density, and equivalent width for the Ly profile are shown in Table 3 and the corresponding Voigt profile is shown in the top-left panel of Figure 5. The best-fit recession velocity of the Ly profile agrees with the H I 21 cm velocity to within the errors. The best-fit column density ( cm-2) makes this absorber a Lyman limit system, which are typically associated with the halos of bright galaxies (Steidel, 1995, 1998; Stocke et al., 2005). Together with the H I 21 cm radio data, the Ly column density yields estimates of the spin temperature from the single dish and VLBA data of K and K, respectively. The Si III profile was fit in the same way as the Ly profile and its best-fit recession velocity, column density, and equivalent width are shown in Table 3. The corresponding Voigt profile is shown in the bottom-left panel of Figure 5.
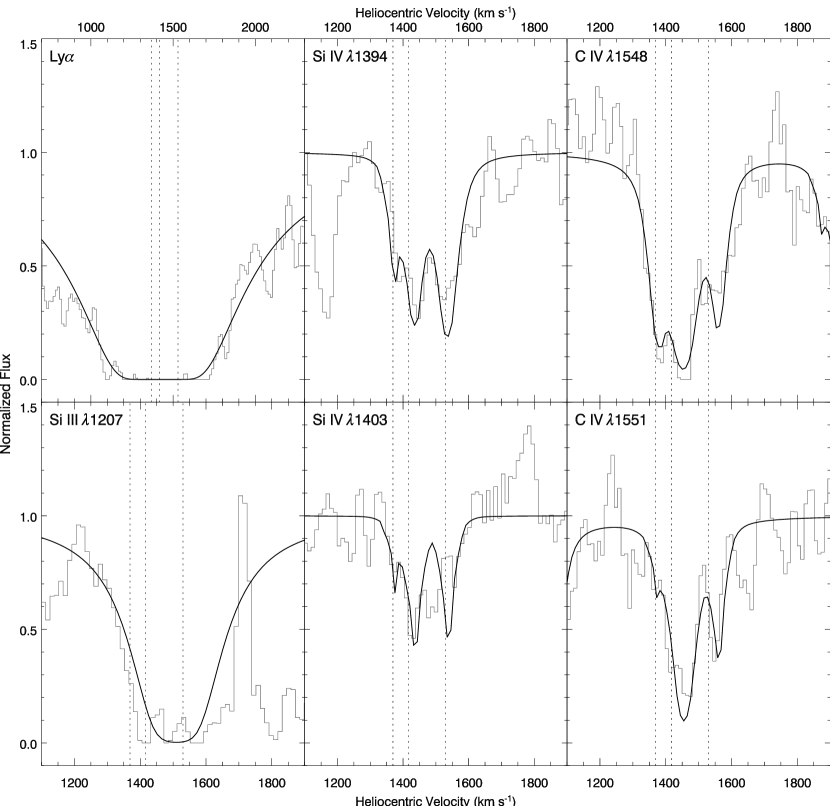
In contrast to the H I 21 cm and Ly data, the C IV and Si IV profiles have multiple velocity components as seen in several other metal species in the 3C 232 sightline (S, 91; T, 99). Multiple Voigt profiles were fit to the Si IV and C IV doublets in order to determine the most robust values of recession velocity and column density. The initial velocity estimates for these profiles were , 1420, and 1530 km s-1 (chosen to match the velocity components at , and km s-1 found in Na I and Ca II by S, 91). A range of -values from 4-20 km s-1 was chosen and held constant while the recession velocity and column density were allowed to vary in order to minimize the of the fits to the Si IV and C IV profiles. The best-fit parameters from the fits with different -values were then compared to estimate the fitting errors. The resulting best-fit recession velocities, column densities, and equivalent widths are shown in Table 3. The corresponding Voigt profiles for the Si IV and C IV doublets are shown in the middle and right panels of Figure 5, respectively. The best-fit velocities for the 1370 and 1530 km s-1 components in both the Si IV and C IV profiles agree with the values found by S (91) to within the combined errors. The best-fit velocity at km s-1 in the Si IV profile is just barely discrepant from the S (91) value of km s-1 at the level, while the best-fit velocity at in the C IV profile differs from the S (91) velocity by . Considering that the Si IV and C IV components are significantly blended (although much less so than Mg II; T, 99), all of the best-fit velocities agree well with the component velocities determined previously for Ca II and Na I (S, 91).
3 Discussion
Perhaps the most remarkable aspect of this sightline is the consistent velocity structure from neutral elements (Na I D, Mg I) to singly-ionized species (Ca II H & K, Mg II, Fe II) to high ions (Si IV, C IV). S (91) found three velocity components in the profiles of Na I D and Ca II H & K and determined that these components lie at heliocentric recession velocities of , , and km s-1. T (99) used HST/GHRS to examine the absorption-line profiles in the wavelength region -3000 Å and found absorption lines of Mg I, Mg II, and Fe II associated with NGC 3067. The Mg I 2853 profile has velocity components at heliocentric velocities of and 1420 km s-1 and the Fe II 2344, 2374, and 2600 profiles all show broad absorption centered at km s-1 and extending from -1600 km s-1, although no clear velocity substructure is present (the Fe II 2586 line was also observed, but due to blending with Galactic Fe II 2600, its velocity structure is indeterminate). Like the Ly profile described above, the Mg II 2796, 2800 profiles found by T (99) are highly saturated. Thus, while absorption is present in these profiles from -1600 km s-1, it is impossible to detect, or rule out, any velocity substructure in these transitions. Finally, the present study uses HST/STIS spectra to examine the Si IV and C IV absorption lines associated with NGC 3067 and finds evidence of multiple velocity components in these profiles. We find three distinct velocity components in both doublets, and by fitting Voigt profiles to the observed absorption we have found that the velocity components for the Si IV and C IV transitions generally match the components found by S (91) to within the combined errors. We believe, but cannot prove definitively due to line blending, that the velocities of Si IV and C IV match the low ion velocities exactly.
Because all of the far-UV absorption in Table 3 is in the Ly forest region for this QSO (), line blending with low- Ly interlopers (e.g., the line just blueward of Si IV 1394 in Figure 4) can contaminate the wavelength region of interest and create false velocity components. Ly interlopers are especially problematic for the Si IV and C IV profiles due to the sensitivity of the STIS G140M data. Nonetheless, the presence of a consistent velocity structure over numerous ionization states implies that the high ionization gas is spatially coincident with the neutral and singly-ionized gas; i.e., the gas exists in three “clouds” above the disk of NGC 3067.
The Na/Ca ratio for these absorbers ((Na I)(Ca II; S, 91) is not consistent with gas originating in the Galactic disk ((Na I)(Ca II-200; Crawford, Barlow, & Blades, 1989), but no studies have measured the Na/Ca ratio out to a Galactocentric radius of 30 kpc, the galactocentric radius of the NGC 3067 clouds if they lie in the disk of NGC 3067 rather than its halo. However, Morton, York, & Jenkins (1986) found a tentative cutoff in the distance at which Ca II could be detected from a galaxy center of , the isophotal face-on diameter of a galaxy at a surface brightness of 25 mag arcsec-2 ( kpc for NGC 3067) and Briggs et al. (1980) found that disk gas detected in H I 21 cm at galactocentric radii Holmberg radii is uncommon in the local Universe and that the distribution of the disk gas shows a sharp cutoff at . These results suggest that the NGC 3067 clouds are likely associated with the halo (i.e., not the very extended disk) of the galaxy. We propose that each of the velocity components in the 3C 232 sightline is caused by an absorbing cloud of gas above the plane of NGC 3067 that is analogous to a Galactic HVC. In §3.1 we compare the kinematics of the absorbing clouds around NGC 3067 and Galactic HVCs, in §3.2 we compare their spin temperatures and cloud sizes and in §3.3 we discuss the ionization conditions necessary to produce the observed equivalent width ratios.
3.1 Gas Kinematics
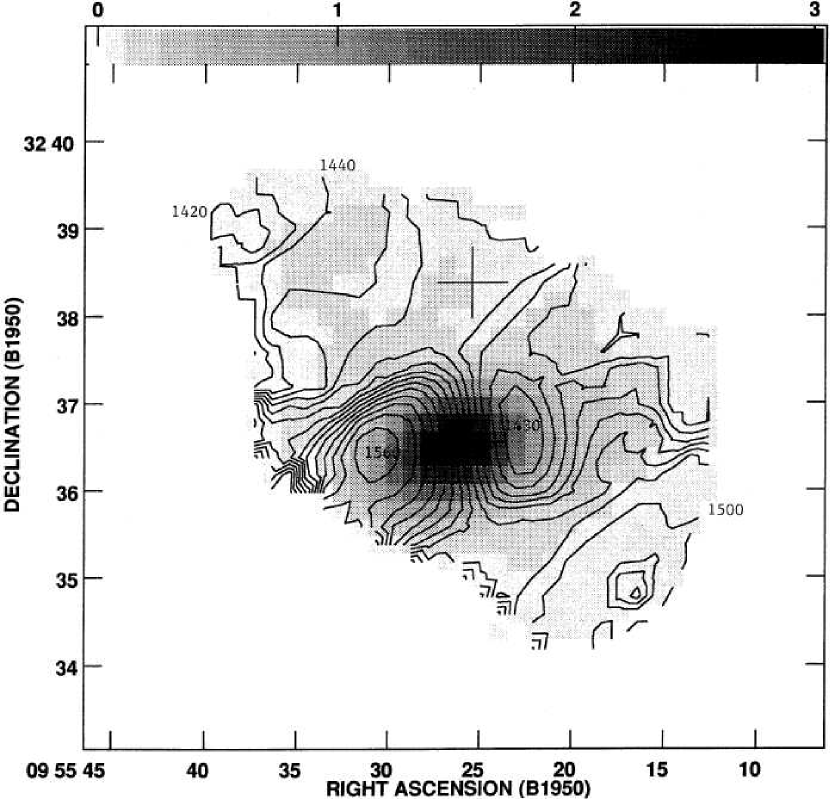
The H I 21 cm emission map and rotation curve of CvG (their Fig. 7) is reproduced in Figure 6, where the halo gas to the NE (SW) can be seen to have systematically lower (higher) radial velocities than the disk “below” these regions. If the halo gas in these regions is rotating similarly to disk gas, then the northern half is closer to us than the southern half (i.e., we are looking at the “underside” of the galaxy). Using the systemic velocity for NGC 3067 of km s-1 (CvG, ), an inclination of degrees (Rubin et al., 1982), and assuming that the clouds are on purely radial trajectories along the minor axis of NGC 3067 as one might expect for an outflowing starburst wind, the 1370, 1420, and 1530 km s-1 clouds are moving at , , and km s-1 with respect to the nucleus of NGC 3067, respectively. Thus, given the galaxy’s orientation, two of the clouds are infalling and one is outflowing. The uncertainties in the above velocities take into account the uncertainty in the velocity of each component and the uncertainty in the systemic velocity and inclination of NGC 3067, but they do not take into account uncertainties in our physical model. If the clouds are moving on radial orbits that are not along the minor axis of NGC 3067 then their inflow/outflow velocities could be much larger than this if they are moving nearly along the plane of the sky. Of course, these clouds could also share some or all of the rotation of the disk, in which case the radial inflow/outflow velocity is diminished.
The rotation curve in Figure 6 yields a dynamical mass for NGC 3067 of M☉, which leads to an escape velocity of km s-1 at a radius of 11 kpc. This velocity implies that even if our assumed geometry is wrong and the halo gas is counter-rotating with respect to the disk (i.e., the southern side of NGC 3067 is closer to us than the northern side) the H I detected cloud at km s-1 would still be bound to NGC 3067 if it is traveling on a radial orbit along the galaxy’s minor axis. Especially considering that these clouds are likely to share some rotational velocity with the underlying disk, it is likely that all three clouds are bound to the galaxy irrespective of the assumed geometry, lending more weight to the supposition that these clouds are not the result of an outflowing galactic wind. Despite the modest starburst (1.4 M☉ yr-1) in NGC 3067, there is no strong evidence that halo gas is escaping, and since these velocities are shared by both the low and high ions, this conclusion is not based solely upon the velocity of the neutral halo gas. Note in Figure 6 that the 3C 232 sightline samples a chord close to the minor axis of NGC 3067, the expected location of an outflowing starburst wind; e.g., Heckman, Armus, & Miley (1990) find that the high velocity gas in several nearby starbursts can be explained by a bi-conic outflow with a typical opening angle of . The location of 3C 232 relative to NGC 3067 (-15 from the minor axis; see Figure 6) places this sightline well within this cone angle.
The usual convention for Galactic HVCs is to call gas with a radial velocity km s-1 with respect to the local standard of rest (LSR) an HVC; however, the range of radial velocities allowed by differential galactic rotation varies with Galactic position (Wakker & van Woerden, 1997). Converting the LSR velocity to the Galactic standard of rest (GSR), an HVC with km s-1 would have in the range to km s-1 (Wakker & van Woerden, 1997). However, it should be stressed that this is a radial velocity only and does not represent the full space velocity of the HVC. The observed radial for the 1370, 1420, and 1530 km s-1 clouds ( to km s-1) are clearly in this velocity range, and so have kinematics and locations consistent with Galactic HVCs. Additionally, many Galactic HVCs (e.g., Complex C; Tripp et al., 2003) are observed to be infalling onto our local Galactic disk. Since NGC 3067 also shows evidence for infalling clouds and its starburst is of comparable strength to those of other bright () local starburst galaxies, one would expect that their superwinds might not be able to escape their gravitational potentials either.
We have measured a column density of cm-2 for the 1417 km s-1 cloud, and have calculated an upper limit of cm-2 for the 1370 and 1530 km s-1 clouds, assuming that they have a similar spin temperature and velocity width as the 1420 km s-1 cloud. Large angle sky surveys such as Bajaja et al. (1985) and Hulsbosch & Wakker (1988) search for Galactic HVCs down to a detection limit of - cm-2, so it is questionable whether the 1370 and 1530 km s-1 clouds would be detected in such a survey if they were located near the Milky Way. The combined Bajaja et al. (1985) and Hulsbosch & Wakker (1988) surveys find a covering factor for Galactic HVCs, as seen from Earth, of (Wakker & van Woerden, 1991). Thus, if NGC 3067 has the same covering factor of HVCs as the Milky Way, there is a probability of intercepting at least one cloud with along the sightline to 3C 232, assuming that the clouds are randomly distributed. Thus the coincidence of one strong HVC and two weak ones in this sightline is consistent with the expectations from our Galaxy’s HVC population.
Recently, Thilker et al. (2004) have discovered an extensive population of H I clouds surrounding M 31 with the Green Bank Telescope. They find discrete clouds within 50 kpc of the M 31 disk that they believe are analogs to Galactic HVCs. The M 31 clouds have radial velocities comparable to the velocity of the outer disk of M 31 and masses of - M☉ (Thilker et al., 2004). Additionally, Thilker et al. find a filamentary halo component concentrated near the M 31 systemic velocity that extends at least 30 kpc from its nucleus. If the extensive H I cloud systems of the Milky Way and M 31 are ubiquitous in the low- Universe then it is no surprise that we have detected similar clouds around NGC 3067.
3.2 Spin Temperature and Cloud Size
Our dataset allows us to make several estimates of the spin temperature of the H I in the clouds. From our VLBA observations (§2.1) we have calculated a column density for H I absorption toward 3C 232 of cm-2 K-1. Combining this result with the column density of H I emission ( cm-2) found by CvG (see Figure 6), we calculate a spin temperature of K for the strongest H I component seen on the line of sight to 3C 232. By fitting a Voigt profile to the Ly absorption associated with NGC 3067 in our HST/STIS spectrum of 3C 232 (§2.3), we have found a column density of cm-2 for the 1420 km s-1 cloud, yielding a spin temperature of K when combined with the VLBA measurement. A third value is obtained by comparing the single-dish Arecibo optical depth with the Ly column density: K. While this latter value has the smallest statistical errors, the radio and UV beam sizes against which the absorption is measured are not as good a match (radio continuum size mas; UV continuum size mas). In contrast, the VLBA value uses only the core of 3C 232, which has a size of mas. However, within the rather large measurement errors, all of these values agree.
Unfortunately, very little is known about the spin temperatures of Galactic HVCs, but Akeson & Blitz (1999) have measured a lower limit of -320 K on the line of sight toward one Galactic HVC. The spin temperature measurements of the strongest absorbing cloud near NGC 3067 are clearly consistent with this lower limit. On the other hand, H I clouds in the Outer Arm of the Galactic disk (-20 kpc) have spin temperatures that are much lower than those calculated for the 1420 km s-1 cloud (typically -150 K, c.f., Akeson & Blitz, 1999), further indicating that this cloud is not associated with the disk of NGC 3067.
We can also estimate the kinetic temperature () of the H I using the width of the 21 cm absorption profile. This profile has a FWHM of km s-1 in the Arecibo data, which corresponds to a -value of km s-1 and yields K. If one performs the same calculation starting with the FWHM of the VLBA 21 cm absorption profile then K. These estimates agree with the spin temperature measurements above to within the errors, suggesting that and are coupled. To our knowledge, this extragalactic cloud is the first for which both and have been measured and found to be approximately equal. Particle collisions naturally drive the spin temperature of a gas toward the kinetic temperature. Using the collisional de-excitation rate coefficients of Allison & Dalgarno (1969), a particle density of is required for collisions to be the dominant source of temperature coupling at this kinetic temperature (Kulkarni & Heiles, 1988). T (99) found a density of for the NGC 3067 clouds from photoionization modeling, smaller than the density required for particle collisions to couple and .
Resonant scattering of Ly photons can also drive the spin temperature to the kinetic temperature, since the radiation field exchanges energy with the gas during the scattering process through atomic recoil (Field, 1958, 1959). This interaction causes to approach the color temperature of the radiation, which is equal to if enough scatterings have occurred (i.e., the optical depth is large enough; Field, 1959; Deguchi & Watson, 1985). Deguchi & Watson (1985) found that Ly scattering dominates the excitation of low-density extragalactic clouds if the Ly optical depth () is . Using Equation 7 of Wolfe (1979), in the NGC 3067 clouds is . Since the optical depth is so large, the Ly photons cannot penetrate easily into the cloud from an external source; thus, the Ly photons must be generated inside the cloud itself from the recombination of electrons and protons to form H I (Deguchi & Watson, 1985; Kulkarni & Heiles, 1988). In statistical equilibrium, the recombination rate is equal to the ionization rate of H I by cosmic rays and EUV and soft X-ray photons that are capable of penetrating to the cloud’s interior. For resonant Ly scattering to drive to within 10% of at this kinetic temperature, an ionization rate of ionizations per hydrogen atom per second is required (Deguchi & Watson, 1985). Watson & Deguchi (1984) found an ionization rate of ionizations per hydrogen atom per second for penetrating radiation from the extragalactic 1-10 keV X-ray flux. The true ionization rate in the NGC 3067 clouds is likely sufficient to couple and (i.e., ) when one includes the contributions of cosmic rays, soft X-rays produced in NGC 3067, the extragalactic X-ray background, and some Lyman continuum photons escaping from NGC 3067.
The diversity of our observational data also allows us to estimate the size of the strongest absorbing cloud. Since absorption from the 1420 km s-1 cloud is present to comparable optical depths in the spectra of both the core and jet regions of 3C 232 (see Figure 1), the absorbing cloud must be larger than the separation between the two regions, 20 mas (see Table 1). At the redshift of NGC 3067 this angular distance corresponds to a physical distance of 2 pc. Since our estimates of using either the Ly value or the H I 21 cm emission value (CvG, ) agree to within errors, there is little evidence for clumping on angular scales smaller than the VLA beam size of . Otherwise, one would expect a significant discrepancy between the calculated from the large VLA beam and the STIS pencil beam due to the filling factor of the gas. Finally, a visual examination of Figure 6 reveals no noticeable clumping in H I emission or H I velocity on angular scales slightly larger than . Thus, a reasonable estimate of the angular size of the absorbing clouds is , which corresponds to a physical size of 5 kpc at the distance of NGC 3067. This characteristic size yields a mean physical density for this cloud of , remarkably similar to the -0.006 cm-3 found from photoionization modeling by T (99). This agreement is further evidence that the absorbing cloud is rather uniform on a 5 kpc scale.
It is surprising that a spherical cloud with a 5 kpc radius would have a line width that is purely thermal with no contribution from turbulent or bulk motions. Galactic HVCs tend to have larger line widths than that found in H I 21 cm absorption for the 1420 km s-1 cloud; the -value for a typical Complex C sightline is km s-1 for low ions like H I O I, Fe II, and S II (see Collins, Shull, & Giroux, 2003; Sembach et al., 2004). It is unclear why the H I 21 cm line width in the 1420 km s-1 cloud is so narrow ( km s-1). Perhaps the cloud is sheet-like rather than spherical such that it is smaller along the line of sight than in the transverse direction.
Based upon new H emission detections, Putman et al. (2003) find that most Galactic HVCs lie within kpc of the Galaxy and are not extragalactic members of the Local Group. The Galactic HVC Complex C spans on the sky and lies at a distance of 2-14 kpc (depending on the spiral arm with which one assumes the HVC is associated; Putman et al., 2003), yielding a physical size of 3-22 kpc. This result implies that the absorbing clouds around NGC 3067 not only lie at comparable galactocentric distances as Galactic HVCs but also have comparable physical sizes.
3.3 Ionization Balance
T (99) found that all of the low and intermediate ionization species in the 3C 232 sightline could be explained by a photoionization model with an extragalactic ionizing flux of photons cm-2 s-1 assuming a power-law spectrum with index 1.8 and no ionizing flux from NGC 3067 (if one allows a significant contribution from NGC 3067 then it becomes impossible to constrain the extragalactic radiation field; T, 99). T (99) also placed an upper limit on the escape fraction of ionizing photons from NGC 3067 () based on H images of the 3C 232/NGC 3067 system. This value is comparable to the escape fraction for Galactic HVCs (-0.02) measured by Putman et al. (2003). The photoionization model of T (99), which fits all of the low ions (Na I through Mg II and Fe II) predicts C IV and Si IV equivalent widths of mÅ, which would be undetectable in the G140M spectra presented here. Thus, the easily detected higher ions are much more likely to be collisionally-ionized by shocks or some other process despite sharing the same kinematics with the lower ions.
In addition, the photoionization modeling of T (99) sets a modest lower limit on metallicity for the ensemble of all three of these clouds of (). This limit is specifically derived from the Si II 1304 Å line (see Table 3) but is consistent with the observed strengths of other detected lines. This limit was derived assuming the extreme case of a purely extragalactic ionizing spectrum with an ionizing flux of as inferred by T (99); however, if we assume the opposite extreme of an ionizing spectrum that comes purely from ionizing photons escaping the plane NGC 3067 with , the metallicity limit does not change appreciably. The metallicity limit for the NGC 3067 clouds of is comparable to recently measured metallicities of Galactic HVCs. Tripp et al. (2003) used a STIS echelle spectrum of the background quasar 3C 351 to find a metallicity of -0.3 for Complex C and Sembach et al. (2002) used a Far Ultraviolet Spectroscopic Explorer (FUSE) spectrum of the background quasar Ton S120 to find a 3 metallicity limit of (O/H solar for the compact high velocity cloud CHVC 224.083.4197. Collins, Shull, & Giroux (2004) find similar metallicities of and for the highly ionized HVCs detected toward PKS 2155304 at velocities of and km s-1, respectively.
Highly ionized gas has been detected in several Galactic HVCs. Fox et al. (2004) have detected Complex C in a similar range of ionic species to those we detect for the clouds toward 3C 232. Using spectra from HST/STIS and FUSE, they found that O VI, Si II, and H I are all coincident in velocity, mimicking the ionization structure that we see in the NGC 3067 clouds. By modeling the high ion column density ratios (Si IV)/(O VI), (C IV)/(O VI), (N V)/(O VI), Fox et al. conclude that neither a single collisional ionization equilibrium nor photoionization equilibrium model can produce the highly ionized gas observed in Complex C. They hypothesize that the highly ionized gas is a collisionally ionized skin that forms in the conductive or turbulent interfaces that arise when the predominantly photoionized cloud moves through a surrounding hot medium. Given the similar ionization structure between Complex C and the NGC 3067 clouds, it is plausible that the same phenomena produce the ions in both; i.e., the low ions observed by S (91) and the intermediate ions observed by T (99) have strengths and ratios consistent with a single photoionization model but not the Si IV and C IV, which require another ionization source. While Fox et al. discuss several alternative hypotheses for the observed ionization structure, the analogy between Complex C and these clouds is retained. We note that the inferred velocities of the three HVC-like clouds in NGC 3067 relative to a static halo in that galaxy yield shock temperatures easily sufficient to produce large amounts of C IV and Si IV.
Lehner, Keenan, & Sembach (2001) have detected the Galactic HVC 291.241.2+80 along the line of sight to the Magellanic Bridge star DI 1388 in several species that we have detected toward 3C 232, including C II, O I, Si II, Si III, Si IV, and S III. However HVC 291.241.2+80 has not been detected in H I to a 5 limit of cm-2 (Lehner et al., 2001), which suggests that this Galactic HVC is analogous to the 1370 and 1530 km s-1 clouds around NGC 3067. Using the C II/Si II and O I column densities to trace the hydrogen column of HVC 291.241.2+80 yields estimated column densities of and , respectively, which Lehner et al. argue indicates that much of the hydrogen is ionized since C II and Si II trace both neutral and singly-ionized gas whereas O I traces only neutral gas. These Galactic analogs suggest that the 1370 and 1530 km s-1 clouds could also be significantly ionized and not predominantly neutral as is the case for HVCs with higher H I column densities.
The highly ionized HVCs detected by Sembach et al. (1999) toward the QSOs Mrk 509 and PKS 2155304 have a different ionization structure than the NGC 3067 clouds or HVC 291.241.2+80 in that they are detected exclusively in high ions such as C IV, Si IV, and N V with no detectable absorption from low or intermediate ions (e.g., Si II or C II) or H I 21 cm emission at corresponding velocities. A search for 21 cm emission near these sightlines revealed H I HVCs at comparable velocities to the highly ionized clouds within of the sightlines (the H I HVC with the highest column density has ; Sembach et al., 1999), which suggests that the highly ionized gas traces the extended ionized regions of the H I HVCs in much the same way as the highly ionized skin proposed by Fox et al. (2004) for Complex C. Sembach et al. also find that the lack of intermediate ions in their highly ionized HVCs argues against collisional ionization as the primary ionization mechanism for these clouds; instead they prefer a photoionization model in which the source possesses a hard QSO-like spectrum as the principle photoionization mechanism, although they don’t rule out a contribution to the ionization balance from collisionally ionized gas. The requirement of a QSO-like source in their photoionization models implies that the highly ionized HVCs of Sembach et al. lie at large distances from the Galactic plane (30-200 kpc if the highly ionized HVCs and their H I counterparts are in thermal pressure equilibrium; Sembach et al., 1999) where they are exposed to the extragalactic radiation field.
Subsequent observations of these HVCs with FUSE (Sembach et al., 2003) and STIS (Shull, Tumlinson, & Giroux, 2003; Kraemer et al., 2003) have changed the initial interpretation of the Sembach et al. (1999) GHRS data. Strong O VI absorption was found in the FUSE spectra of these HVCs at column densities that are too large for reasonable photionization models to accomodate. Many intermediate ions are detected in the STIS spectra, including Si II, Si III, C II, and C III; H I was even detected in two HVCs toward PKS 2155304 at to (Collins et al., 2004). Collins et al. (2004) argue that the O VI in these HVCs is collisionally ionized and the presence of absorption in ions ranging from H I to C IV, Si IV, and O VI suggests that these HVCs are multiphase. They propose that the high ions in these clouds arise from hot gas that is potentially produced behind bow shocks from clumps falling toward the Galactic plane. This interpretation is remarkably similar to that of Fox et al. (2004) for Complex C and suggests a similar source for the high ions detected in the NGC 3067 clouds.
4 Conclusions
We have presented sensitive new radio and ultraviolet spectra to determine if the multiple velocity components ( km s-1) found in Na I and Ca II by S (91) and Mg I, Mg II, and Fe II by T (99) toward 3C 232 are also present in H I Ly, Si IV, and C IV. Our H I 21 cm data from the VLBA and Arecibo show evidence for only the strongest (1420 km s-1) velocity component and set upper limits, , on the column density of the other two components. The 1420 km s-1 absorber is a Lyman limit system with a column density of based on Voigt profile fitting of the Ly absorption feature in our STIS G140M spectra. Lyman limit systems are generally associated with the halos of luminous galaxies (Steidel, 1995, 1998; Stocke et al., 2005), and indeed our best value of the measured spin temperature for this absorber ( K) is significantly larger than the spin temperatures ( K; Akeson & Blitz, 1999) found in the Galactic disk and comparable to the lower limit of -320 K found toward one Galactic high velocity cloud (HVC; Akeson & Blitz, 1999). The Na/Ca ratio for these absorbers is not consistent with gas in the Galactic disk either (S, 91), further suggesting that these absorbers are located in the halo, not the extended disk, of NGC 3067.
While the 1420 km s-1 component is still the only component detected in H I, we did detect all three velocity components in both lines of the Si IV and C IV doublets in our STIS G140M spectra. The presence of all three velocity components in various metal species and ionization states implies that the highly ionized gas is spatially coincident with the neutral and singly ionized gas. We hypothesized that the three velocity components correspond to three clouds of gas kpc from the nucleus of NGC 3067 that are analogous to Galactic HVCs. We have found several lines of evidence that support this argument:
-
•
We find that galactocentric radial velocities of the NGC 3067 clouds ( to +65 km s-1) lie in the velocity range expected for a Galactic HVC with km s-1.
-
•
Assuming a cloud location along the minor axis of NGC 3067 and purely radial motion, the most likely kinematic solution for the cloud and the underlying disk of NGC 3067 require this cloud to be falling toward the disk as frequently observed for Galactic HVCs.
-
•
Our estimated cloud size of 5 kpc is comparable to the estimated size of the Galactic HVC Complex C.
-
•
The spin temperature of the NGC 3067 clouds ( K) is consistent with the lower limits found for Galactic HVCs ( K; Akeson & Blitz, 1999).
-
•
The photoionization modeling of T (99) places a lower limit on the metallicity of the NGC 3067 cloud ensemble of , which is similar to the metallicities derived along several sightlines toward Galactic HVCs.
-
•
We detect the same intermediate ions in the NGC 3067 clouds (e.g., C II, Si II) that are detected in many highly ionized Galactic HVCs.
-
•
The upper limit on the escape fraction of UV radiation to these clouds is comparable to that found from the Galaxy to Galactic HVCs (Putman et al., 2003). A much larger escape fraction would be expected along the minor axis of a starburst wind (see Dove, Shull, & Ferrara, 2000; MacLow & Ferrara, 1999).
Thus, the overall physical picture of the 3C 232/NGC 3067 system is that of a Galactic “fountain”, not an outflowing starburst wind.
We find no evidence that halo gas along this sightline is escaping the galaxy’s gravitational potential, despite the fact that NGC 3067 is a modest starburst with a star formation rate of 1.4 M☉ yr-1. The 3C 232 sightline is located near the minor axis of NGC 3067, which is where one would expect to find signatures of an outflowing starburst wind (e.g., Heckman et al., 1990). Nevertheless, regardless of whether we assume that the halo gas shares the rotation direction of the disk, the deprojected velocities of the NGC 3067 clouds are all less than the escape velocity from the gravitational potential well if they are travelling on purely radial orbits along the minor axis of NGC 3067. Furthermore, the most consistent analysis of the disk/halo gas kinematics from a detailed H I emission map (CvG, ) determines that two of these clouds (including the H I 21 cm detected cloud) are infalling. For either kinematic solution (halo gas rotating or counter-rotating) the system is gravitationally bound to NGC 3067. Thus, if these clouds truly are analogous to Galactic HVCs, one would expect that Galactic HVCs are also bound to the Galactic gravitational potential rather than that of the Local Group and that Galactic HVCs are located closer to the Galaxy than the Local Group barycenter.
If instead we take the perspective that at least one of the velocity components observed in NGC 3067 towards 3C 232 is an outflowing starburst wind, do we observe what might be expected for such a circumstance? Almost certainly not. First, we might expect the higher ions to have different kinematics from the low ions; the latter would be expected to be seen at lower galactocentric velocities as cool clumps in a hotter, more highly ionized wind. While the kinematic solution does strictly allow an outflowing, even escaping wind if the geometry is just right (e.g., ejection nearly along the plane of the sky), the more straightforward kinematic solution is that two of the clouds are infalling, certainly not expected in a starburst wind scenario. The limit on the escape fraction of ionizing radiation from NGC 3067 () is also much lower than expected in a situation where an outflowing starburst wind would be expected to clear away almost all of the neutral material above the disk (Dove et al., 2000; MacLow & Ferrara, 1999). The large inferred size of 5 kpc for the neutral cloud is far larger than might be expected for a cool clump in a starburst wind; i.e., this size is nearly half of the cone opening angle () suggested by Heckman et al. (1990). Thus, a starburst model is a poor match to many of the observations for these clouds described in this paper.
This result also suggests that the superwinds produced by other comparably massive local starbursts (e.g., NGC 253, NGC 4945) might not be capable of escaping their galaxy’s potential well either. However, starburst winds may escape the shallower gravitational potential wells of less massive galaxies (; Martin, 2003; Stocke et al., 2004). Even though all of the low, intermediate, and high ions detected in these putative HVCs share the same kinematics, there remains the possibility that even more highly ionized gas could possess different kinematics that trace a wind escaping from NGC 3067. Unfortunately, at F Å- Å-1, 3C 232 is too faint in the far-UV to be observed easily with FUSE, which could be used to test this hypothesis by observing the O VI 1032, 1038 absorption lines at high signal to noise ratio.
The QSO/galaxy pair PKS 1327-206/ESO 1327-2041 shares many characteristics with the 3C 232/NGC 3067 system. PKS 1327-206 and ESO 1327-2041 have a projected separation of 13 kpc (CvG, ). ESO 1327-2041 has a similar luminosity to NGC 3067 (; Lauberts & Valentijn, 1989; Marzke et al., 1994) and was noted by Giraud (1986) and CvG to possess a polar ring of extraplanar gas. Thus, it is worthwhile to re-examine the gas kinematics and morphology of this QSO/galaxy pair in light of the HVC interpretation presented here for the similar 3C 232/NGC 3067 system.
The results we present here strongly support the model for Galactic HVCs that places them within a few kpc of the disk of the Milky Way (e.g., Bland-Hawthorn & Maloney, 2002; Putman et al., 2003) and not at Mpc as “extragalactic clouds” within the Local Group (Blitz et al., 1999). In the case of NGC 3067 there is little doubt that these absorbers are within a few kpc of its galactic plane and have remarkably similar properties to those of Galactic HVCs. Deep H I 21 cm searches for HVC analogs in nearby galaxy groups (Verheijen et al., 2001; Zwaan, 2001) and in non-targeted H I surveys (Zwaan & Briggs, 2000) have failed to find extragalactic H I clouds, which would be expected if the Blitz et al. (1999) hypothesis were correct. The present result adds to the significant evidence against the extragalactic evidence for HVCs. However, CvG note that the very extended H I in NGC 3067 and the possibly complex kinematics of the extra-planar H I are quite similar to the H I morphologies seen in interacting galaxy systems (e.g., M 51 & Mrk 348), although NGC 3067 has no obvious close companion. Could it be that the Milky Way and M 31 are also unusual in possessing such an extensive system of extra-planar H I clouds?
References
- Aguirre et al. (2004) Aguirre, A., Schaye, J., Kim, T.-S., Theuns, T., Rauch, M., & Sargent, W. L. W. 2004, ApJ, 602, 38
- Akeson & Blitz (1999) Akeson, R. L. & Blitz, L. 1999, ApJ, 523, 163
- Allison & Dalgarno (1969) Allison, A. C. & Dalgarno, A. 1969, ApJ, 158, 423
- Bajaja et al. (1985) Bajaja, E., Cappa de Nicolau, C. E., Cersosimo, J. C., Loiseau, N., Martin, M. C., Morras, R., Olano, C. A., & Pöppel, W. G. L. 1985, ApJS, 58, 143
- Bland-Hawthorn & Maloney (2002) Bland-Hawthorn, J. & Maloney, P. R. 2002, in ASP Conf. Ser 254, Extragalactic Gas at Low Redshift, ed. J. S. Mulchaey & J. T. Stocke (San Francisco: ASP), 267.
- Blitz et al. (1999) Blitz, L., Spergel, D. N., Teuben, P. J., Hartmann, D., & Burton, W. B. 1999, ApJ, 514, 818
- Boksenberg & Sargent (1978) Boksenberg, A. & Sargent. W. L. W. 1978, ApJ, 220, 42
- Briggs et al. (1980) Briggs, F. H., Wolfe, A. M., Krumm, N., & Salpeter, E. E. 1980, ApJ, 238, 510
- Burbidge et al. (1971) Burbidge, E. M., Burbidge, G. R., Solomon, P. M., & Strittmatter P. A. 1971, ApJ, 170, 233
- (10) Carilli, C. L. & van Gorkom, J. H. 1992, ApJ, 399, 373 (CvG)
- Churchill et al. (2000) Churchill, C. W., Mellon, R. R., Charlton, J. C., Jannuzi, B. T., Kirhakos, S., Steidel, C. C., & Schneider, D. P. 2000, ApJ, 543, 577
- Collins, Shull, & Giroux (2003) Collins, J. A., Shull, J. M., & Giroux, M. L. 2003, ApJ, 585, 336
- Collins et al. (2004) Collins, J. A., Shull, J. M., & Giroux, M. L. 2004, ApJ, 605, 216
- Condon et al. (1998) Condon, J. J., Cotton, W. D., Greisen, E. W., Yin, Q. F., Perley, R. A., Taylor, G. B., & Broderick, J. J. 1998, AJ, 115, 1693
- Crawford, Barlow, & Blades (1989) Crawford, I. A., Barlow, M. J., & Blades, J. C. 1989, ApJ, 336, 212
- Deguchi & Watson (1985) Deguchi, S. & Watson, W. D. 1985, ApJ, 290, 578
- de Vaucouleurs et al. (1991) de Vaucouleurs, G., de Vaucouleurs, A., Corwin, H. G., Buta, R. J., Paturel, G., & Fouque, P. 1991, Third Reference Catalogue of Bright Galaxies (Berlin: Springer-Verlag)
- De Young (1978) De Young, D. S. 1978, ApJ, 223, 47
- Dove et al. (2000) Dove, J. B., Shull, J. M., & Ferrara, A. 2000, ApJ, 531, 846
- Field (1958) Field, G. B. 1958, Proc. IRE, 46, 240
- Field (1959) Field, G. B. 1959, ApJ, 129, 551
- Fox et al. (2004) Fox, A. J., Savage, B. D., Wakker, B. P., Richter, P., Sembach, K. R., & Tripp, T. M. 2004, ApJ, 602, 738
- Giraud (1986) Giraud, E. 1986, A&A, 161, 206
- Grimm, Gilfanov, & Sunyaev (2003) Grimm, H.-J., Gilfanov, M., & Sunyaev, R. 2003, MNRAS, 339, 793
- Haschick & Burke (1975) Haschick, A. D. & Burke, B. F. 1975, ApJ, 200, L137
- Heckman et al. (1990) Heckman, T. M., Armus, L., & Miley, G. K. 1990, ApJS, 74, 833
- Heckman (1998) Heckman, T. M. 1998 in ASP Conf. Ser. 148, Origins, ed. C. E. Woodward, J. M. Shull, & H. A. Thronson (San Francisco: ASP), 127
- Heckman et al. (2000) Heckman, T. M., Lehnert, M. D., Strickland, D. K., Armus, L. 2000, ApJS, 129, 493
- Heckman et al. (2001) Heckman, T. M., Sembach, K. R., Meurer, G. R., Strickland, D. K., Martin, C. L., Calzetti, D., & Leitherer, C. 2001, ApJ, 554, 1021
- Hulsbosch & Wakker (1988) Hulsbosch, A. N. M. & Wakker, B. P. 1988, A&AS, 75, 191
- Kraemer et al. (2003) Kraemer, S. B., et al. 2003, ApJ, 582, 125
- Kulkarni & Heiles (1988) Kulkarni, S. R. & Heiles, C. 1988, in Galactic and Extragalactic Radio Astronomy, ed. G. L. Verschuur & K. I. Kellermann (Berlin: Springer-Verlag), 95
- Lanzetta et al. (1995) Lanzetta, K. M., Bowen, D. V., Tytler, D., & Webb, J. K. 1995, ApJ, 442, 538
- Lauberts & Valentijn (1989) Lauberts, A. & Valentijn, E. A. 1989, The Surface Photometry Catalogue of the ESO-Uppsala Galaxies (Garching: European Southern Observatory)
- Lehner et al. (2001) Lehner, N., Keenan, F. P., & Sembach, K. R. 2001, MNRAS, 323, 904
- MacLow & Ferrara (1999) MacLow, M.-M. & Ferrara, A. 1999, ApJ, 513, 142
- Martin (1999) Martin, C. L. 1999, ApJ, 513, 156
- Martin, Kobulnicky, & Heckman (2002) Martin, C. L., Kobulnicky, H. A., & Heckman, T. M. 2002, ApJ, 574, 663
- Martin (2003) Martin, C. L. 2003, in The IGM/Galaxy Connection, ed. J. Rosenberg & M. Putman (Dordrecht: Kluwer), 205
- Marzke et al. (1994) Marzke, R. O., Huchra, J. P., & Geller, M. J. 1994, ApJ, 428, 43
- Misiriotis et al. (2004) Misiriotis, A., Papadakis, I. E., Kylafis, N. D., & Papamastorakis, J. 2004, A&A, 417, 39
- Morton, York, & Jenkins (1986) Morton, D. C., York, D. G., & Jenkins, E. B. 1986, ApJ, 302, 272
- Putman et al. (2003) Putman, M. E., Bland-Hawthorn, J., Veilleux, S., Gibson, B. K., Freeman, K. C., & Maloney, P. R. 2003, ApJ, 597, 948
- Rubin et al. (1982) Rubin, V. C., Thonnard, N. T., & Ford, W. K., Jr. 1982, AJ, 87, 447
- Schaye et al. (2003) Schaye, J., Aguirre, A., Kim, T.-S., Theuns, T., Rauch, M., & Sargent, W. L. W. 2003, ApJ, 596, 768
- Sembach et al. (1999) Sembach, K. R., Savage, B. D., Lu, L., & Murphy, E. M. 1999, ApJ, 515, 108
- Sembach et al. (2002) Sembach, K. R., Gibson, B. K., Fenner, Y., & Putman, M. E. 2002, ApJ, 572, 178
- Sembach et al. (2003) Sembach, K. R., et al. 2003, ApJS, 146, 156
- Sembach et al. (2004) Sembach, K. R., et al. 2004, ApJS, 150, 387
- Shapley et al. (2001) Shapley, A., Fabbiano, G., & Eskridge, P. B. 2001, ApJS, 137, 139
- Shull, Tumlinson, & Giroux (2003) Shull, J. M., Tumlinson, J., & Giroux, M. L. 2003, ApJ, 594, L107
- Simcoe, Sargent, & Rauch (2004) Simcoe, R. A., Sargent, W. L. W., & Rauch, M. 2004, ApJ, 606, 92
- Steidel (1995) Steidel, C. C. 1995, in QSO Absorption Lines, ed. G. Meylan (Garching: Springer), 139
- Steidel (1998) Steidel, C. C. 1998, in ASP Conf. Ser. 136, Galactic Halos, ed. D. Zaritsky (San Francisco: ASP), 167
- Steidel et al. (2002) Steidel, C. C., Kollmeier, J. A., Shapley, A. E., Churchill, C. W., Dickinson, M., & Pettini, M. 2002, ApJ, 570, 526
- S (91) Stocke, J. T., Case, J., Donahue, M., Shull, J. M., & Snow, T. P. 1991, ApJ, 374, 72 (S91)
- Stocke et al. (2004) Stocke, J. T., Keeney, B. A., McLin K. M., Rosenberg, J. L., Weymann, R. J., & Giroux, M. L. 2004, ApJ, 609, 94
- Stocke et al. (2005) Stocke, J. T., Shull, J. M., & Penton, S. V. 2005, to appear in Planets to Cosmology, ed. M. Lirio (Garching: Springer), in press (astro-ph/0407352)
- Thilker et al. (2004) Thilker, D. A., Braun, R., Walterbos, R. A. M., Corbelli, E., Lockman, F. J., Murphy, E., & Maddalena, R. 2003, ApJ, 601, L39
- Tripp et al. (2003) Tripp, T. M. et al. 2003, AJ, 125, 3122
- T (99) Tumlinson, J., Giroux, M. L., Shull, J. M., & Stocke, J. T. 1999, AJ, 118, 2148 (T99)
- Verheijen et al. (2001) Verheijen, M. A. W., Trantham, N., Tully, B., & Zwaan, M. A. 2001, in ASP Conf. Ser. 240, Gas and Galaxy Evolution, ed. J. E. Hibbard, M. Rupen, & J. H. van Gorkom (San Francisco: ASP), 507
- Wakker & van Woerden (1991) Wakker, B. P. & van Woerden, H. 1991, A&A, 250, 509
- Wakker & van Woerden (1997) Wakker, B. P. & van Woerden, H. 1997, ARA&A, 35, 217
- Watson, Stanger, & Griffiths (1984) Watson, M. G., Stanger, V. & Griffiths, R. E. 1984, ApJ, 286, 144
- Watson & Deguchi (1984) Watson, W. D. & Deguchi, S. 1984, ApJ, 281, L5
- Wolfe (1979) Wolfe, A. M. 1979, in Proc. NATO Advanced Study Institute, Active Galactic Nuclei, ed. C. Hazard & S. Mitton (Cambridge: Cambridge Univ. Press), 159
- Zwaan & Briggs (2000) Zwaan, M. A. & Briggs, F. H. 2000, ApJ, 530, L61
- Zwaan (2001) Zwaan, M. A. 2001, MNRAS, 325, 1142