Hubble Space Telescope and Ground-Based Observations of SN 1993J and SN 1998S: CNO Processing in the Progenitors11affiliation: Based in part on observations obtained with the Hubble Space Telescope, which is operated by AURA, Inc., under NASA contract NAS 5-26555.
Abstract
Ground-based and Hubble Space Telescope observations are presented for SN 1993J and SN 1998S. SN 1998S shows strong, relatively narrow circumstellar emission lines of N III-V and C III-IV, as well as broad lines from the ejecta. Both the broad ultraviolet and optical lines in SN 1998S indicate an expansion velocity of . The broad emission components of Ly and Mg II are strongly asymmetrical after day 72 past the explosion, and differ in shape from H. Different models based on dust extinction from dust in the ejecta or shock region, in combination with from a circumstellar torus, are discussed. It is concluded, however, that the double-peaked line profiles are more likely to arise as a result of optical depth effects in the narrow, cool, dense shell behind the reverse shock, than in a torus-like region. The ultraviolet lines of SN 1993J are broad, with a box-like shape, coming from the ejecta and a cool dense shell. The shapes of the lines are well fitted with a shell with inner velocity and outer velocity . For both SN 1993J and SN 1998S a strong nitrogen enrichment is found, with N/C in SN 1993J and N/C in SN 1998S. From a compilation of all supernovae with determined CNO ratios, we discuss the implications of these observations for the structure of the progenitors of Type II supernovae.
1 INTRODUCTION
The nature of the progenitors of the different types of supernovae (SNe) is still debated. One of the main unknowns is the amount of mass loss suffered by the progenitor before the explosion. The extent of the mass loss, driven either by stellar winds in single stars or by binary evolution, causes widely different progenitor structures. Because the supernova light curve and spectrum to a large extent are functions of the mass of the hydrogen and helium envelope, the mass-loss history is a key ingredient in understanding the various observational signatures, manifested in the many separate classes of core-collapse SNe. Mass loss affects the chemical composition of the ejecta; hence, detailed spectral studies of the different types of SNe and their environments can shed some light on this issue.
A large number of SNe have now shown various types and degrees of circumstellar interaction; see Filippenko (1997) for a recent review. Both of the “Type II-linear supernovae” (SNe II-L) 1979C and 1980K showed evidence for circumstellar interaction in their radio emission (Weiler et al., 1986), as well as in the ultraviolet (UV) emission in the case of SN 1979C (Panagia et al., 1980; Fesen et al., 1999). The circumstellar medium most likely originates from the dense, slow superwind of the red supergiant progenitor. Type Ib and Ic SNe are believed to have lost most of their hydrogen envelope prior to exploding. They in general show both radio emission and X-ray emission caused by circumstellar interaction. Because of the high wind speed () of the Wolf-Rayet (WR) progenitor, the wind in this case is considerably less dense compared to that of SNe II-L and II-P.
SN 1993J provided a link between SNe II and SNe Ib in that it underwent a transition from a Type II spectrum at early epochs to a Type Ib-like spectrum at days (Filippenko, Matheson, & Ho, 1993; Filippenko, Matheson, & Barth, 1994; Finn et al., 1995; Barbon et al., 1995); see Filippenko & Matheson (2004) for a recent review. At early epochs it already showed the typical signatures of circumstellar interaction at radio (Van Dyk et al., 1994), UV (Fransson, & Sonneborn, 1994), and X-ray (Zimmermann et al., 1994) wavelengths. After about one year, the optical spectrum became dominated by emission lines excited by the circumstellar interaction (Filippenko, Matheson, & Barth, 1994; Patat, Chugai, & Mazzali, 1995; Matheson et al., 2000a, b).
Type IIn supernovae (e.g., Filippenko 1997) have optical spectral signatures of a circumstellar medium (CSM) present already at early phases. Although they show considerable variation from object to object, the common characteristics are strong, relatively narrow emission lines after a few weeks, or perhaps earlier; these lines are thought to be produced by the interaction between the supernova ejecta and the CSM. In extreme cases (e.g., SN 1988Z; Turatto et al. 1993; Chugai & Danziger 1994) the CSM is clearly very dense and extensive, and the interaction lasts for many years. Occasionally (e.g., SN 1994W; Chugai et al. 2004) there is evidence that much of the CSM was produced just a short time before the explosion. Also, the light curves of SNe IIn have a large variation in terms of the relative importance of the radioactive heating and energy input from circumstellar interaction. However, the nature and relation of the SNe IIn to other SN types are not clear (for a discussion, see Nomoto, Iwamoto, & Suzuki, 1995). SN 1998S represents one of the best-studied examples of this type of supernova.
In contrast to SN 1993J, the optical spectrum of SN 1998S was dominated by circumstellar interaction even at early epochs. Bowen et al. (2000) found that many low-ionization UV lines had a narrow P-Cygni component, which they interpret as a wind with velocity , as well as a more highly ionized component with velocity . This was later confirmed from ground-based observations by Fassia et al. (2001). Chugai (2001) argued that the narrow core and smooth high-velocity wings of the H line at early epochs could be understood as a result of electron scattering in a dense circumstellar shell extending from the supernova. While the observations during the first months showed fairly symmetrical line profiles, the lines changed character after days: H, as well as He I , displayed a highly asymmetrical triple-peaked structure (Gerardy et al., 2000). Infrared observations showed evidence for CO formation at days, and dust formation at days (Fassia et al., 2000; Gerardy et al., 2002). The supernova also showed strong X-ray emission at late epochs (Pooley et al., 2002). No radio emission was seen at early epochs. However, by 310 days emission was detected at 8.46 GHz, and subsequently also at 1.47 GHz and 4.89 GHz (Pooley et al., 2002). The late turn-on and its frequency dependence may be understood as a result of strong free-free absorption by the circumstellar gas.
One of the most important indicators of the extent of mass loss is the relative abundances of the CNO elements. Depending on the mass lost and the degree of mixing, CNO burning products may be seen in either the circumstellar medium or the outer parts of the progenitor, and therefore in the supernova (e.g., Meynet & Maeder, 2000; Heger & Langer, 2000; Wellstein & Langer, 1999). Evidence for such CNO processing has earlier been seen in SN 1979C (Fransson et al., 1984), SN 1987A (Fransson et al., 1989), and SN 1995N (Fransson et al., 2002). In this paper we add two more cases.
SN 1993J and the Type IIn SN 1998S are among the best-observed circumstellar interactors to date. In this paper we report on UV observations of these two SNe, and on their implications for the abundances of the CNO elements. Early-epoch Hubble Space Telescope (HST) observations of both SNe have previously been discussed, but mainly in the context of the outer regions of the supernova ejecta (Jeffery et al., 1994; Houck & Fransson, 1996; Lentz et al., 2001). In this paper we concentrate on the late-epoch observations, where most of the indicators of circumstellar interaction are present. In addition to the HST observations, we also add new ground-based observations. Based on the complete evolution of the line profiles, we discuss implications of the shapes of these for the physics of the interaction region. The analysis in this phase is simplified by the basically nebular conditions of the line-emitting gas.
SN 1993J was discovered on 1993 March 28.9 (Ripero et al., 1993), while SN 1998S was discovered on 1998 March 2.68 UT (Li et al. 1998; Qui et al. 1998). Here we adopt explosion dates of 1993 March 27.5 for SN 1993J (Lewin et al., 1994), and 1998 March 2 for SN 1998S. The true explosion date of SN 1998S was probably somewhat earlier, of course, but by a negligible amount given the late-time phases studied here. Richmond et al. (1994) discuss the reddening of SN 1993J and argue for a most likely value of mag, which we adopt. For SN 1998S Leonard et al. (2000) find a reddening of mag. The distance to SN 1993J is 3.63 Mpc (Freedman et al., 1994) and the recession velocity is (Vladilo et al., 1994). The recession velocity of SN 1998S is (Fassia et al., 2001), and we adopt a distance of 17 Mpc (Tully, 1988).
2 OBSERVATIONS
The HST observations in this paper were obtained with the Faint Object Spectrograph (FOS) and the Space Telescope Imaging Spectrograph (STIS). Tables 1 and 2 give the journal of observations of SN 1993J and SN 1998S (respectively), including exposure times, gratings used, their dispersion, and the wavelength ranges covered. The FOS spectra were obtained with the G160L, G270H, and G400H gratings, while the STIS spectra were obtained with gratings G140L, G230L, and G430L. All spectra were calibrated by the FOS and STIS pipelines at the Space Telescope Science Institute. The region in the FOS spectra of SN 1993J on days 1063 and 1399 is dominated by the geocoronal , so it is not used in this paper. In the STIS spectra on days 1792–2585 this component could be subtracted successfully.
To complement the HST observations, optical low-dispersion spectra of SN 1998S for days 29, 75, 257–258, 431, and 440 were obtained with the FAST spectrograph (Fabricant et al., 1998) on the 1.5-m Tillinghast telescope at the Fred L. Whipple Observatory (FLWO). The FAST spectrograph employs a pixel Loral CCD with a spatial scale of 1.1 pixel-1 in the binning mode used for these observations. Details of the exposures are given in Table 3. The data were reduced in the standard manner with IRAF111IRAF is distributed by the National Optical Astronomy Observatories, which are operated by the Association of Universities for Research in Astronomy, Inc., under cooperative agreement with the National Science Foundation. and our own routines. Wavelength calibration was accomplished with He-Ne-Ar lamps taken immediately after each supernova exposure. Small-scale wavelength adjustments derived from night-sky lines in the supernova frames were also applied. Spectrophotometric standards used in the reductions are listed in Table 3. We attempted to remove telluric lines using the well-exposed continua of the spectrophotometric standards (Matheson et al., 2000a). The FLWO spectra were observed, in general, within of the parallactic angle to minimize losses from atmospheric dispersion (Filippenko, 1982).
To complete the temporal coverage of the optical spectra of SN 1998S we have also included spectra up to day 494 from Lick Observatory, published by Leonard et al. (2000); see Table 3. In addition to these, two spectra on days 643 and 653 were also obtained at the Keck II 10-m telescope with LRIS (Oke et al., 1995), and one very late-time spectrum (day 2148) was obtained with the MMT 6.5-m telescope using the Blue Channel spectrograph (Schmidt, Weymann, & Foltz, 1989). All data were reduced in a manner similar to that described above for the FLWO spectra. For the spectra on days 643 and 2148 the conditions were such that a proper background subtraction was difficult. These spectra may therefore be contaminated by the galaxy background and the fluxes may be correspondingly uncertain. Note that our spectrum from day 653 is also shown in the compilation in Pozzo et al. (2004).
Details of the Keck observations of SN 1993J on days 670, 976, 1766, and 2454, included in this paper, are given by Matheson et al. (2000a). In addition, we have included one spectrum of SN 1993J taken with MMT on 1997 April 8 (day 1473).
3 RESULTS
3.1 SN 1993J
HST observations of SN 1993J at early phases were discussed in Jeffery et al. (1994) and Baron, Hauschildt, & Branch (1994). In this paper we limit ourselves to the nebular phase, when the spectrum is dominated by the circumstellar interaction, and the line profiles are easier to identify and analyze.
Figure 1 shows the HST spectra of SN 1993J from January 1995 to April 2000 (days 670 to 2585), where we have noted the positions of some of the strongest spectral features. As will be discussed below, however, some of these are likely to be blends of several lines. Note that the overlap region of the short-wavelength and long-wavelength UV detectors in the range 1600–1700 Å is affected by an increased noise level.
During this whole time in the nebular phase, the spectrum is remarkably constant. The far-UV region is dominated by the strong Ly emission line, probably blended with N V . The region shortward of Å forms a pseudo-continuum of blended lines of highly ionized nitrogen, carbon, and oxygen, which we discuss in more detail below. The well-defined line at Å is most likely due to N II] . The presence of this prominent line indicates a strong nitrogen enrichment, as we will confirm later. The plateau longward of Å is probably formed mainly of Fe II resonance lines, although a blend of C II] 2323.5–2328.1, O III] 2320.9–2331.4, and Si II] is likely to explain the feature at Å. Finally, the near-UV region is dominated by the prominent Mg II doublet.
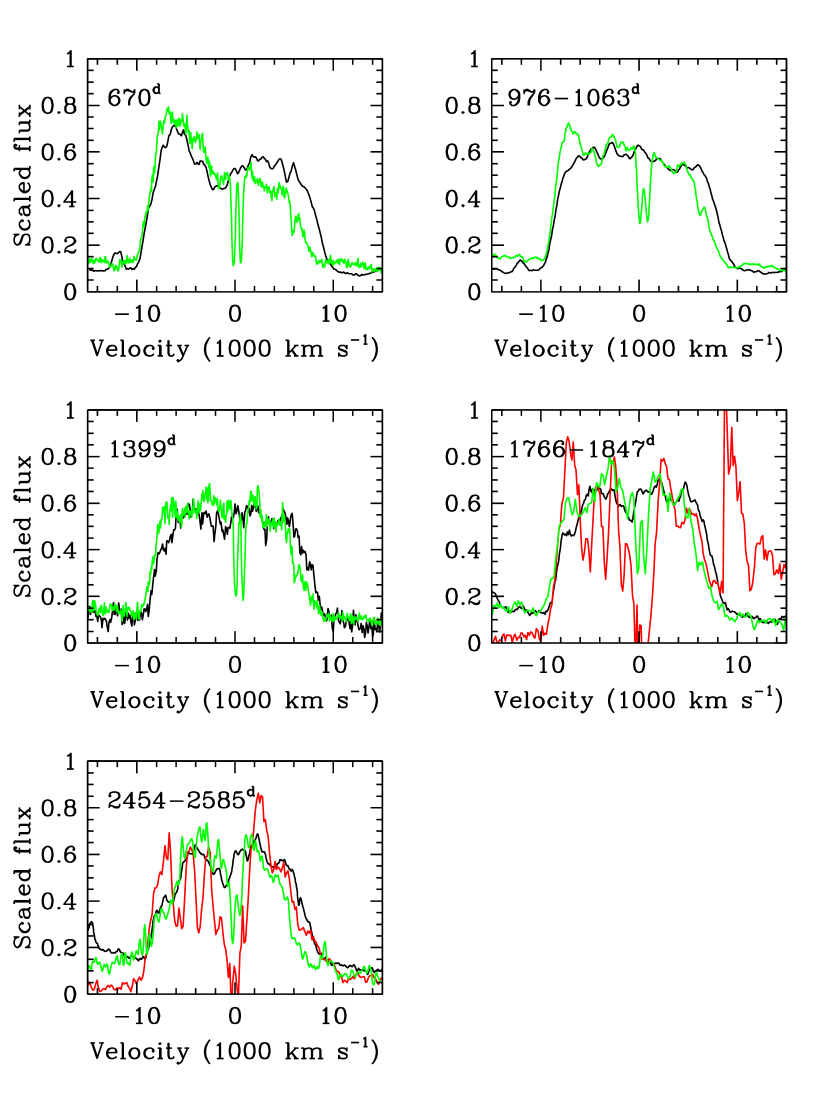
The most interesting temporal change is in the shape of the Mg II line. This evolution is similar to that seen in H (Matheson et al., 2000a). In Figure 2 we compare the Ly, H, and Mg II line profiles. The H profiles are taken from Matheson et al. (2000a). From the figure we see that the shapes of both the H and Mg II lines change in concordance with each other. On day 670 both lines are clearly asymmetric, with the blue side of Mg II a factor of stronger than the red. The asymmetry of H is considerably smaller, with a blue-to-red intensity ratio of . By day 1063 this asymmetry has decreased for both lines, and for the later epochs the two sides have nearly equal strength. The Ly line is strongly affected by geocoronal emission, which makes a comparison with the other lines uncertain.
As has been previously noted (e.g., Filippenko, Matheson, & Barth, 1994; Finn et al., 1995; Patat, Chugai, & Mazzali, 1995; Matheson et al., 2000b), the line profiles after year, in particular that of H, can be best described as box-like. This strongly indicates that the emission comes from a relatively thin shell in the expanding gas. Matheson et al. (2000b) found during this period a maximum velocity of –10,600 for the blue edge of the H line, and a slightly lower velocity for the red edge.
Of the UV lines, only the Mg II and [N II] lines are unblended and have sufficiently high signal-to-noise ratio (S/N) to warrant a detailed line fit. As is seen from Figure 1, the UV spectrum does not change appreciably from January 1996 to February 1997. To increase the S/N, we therefore average the day 1063 and day 1399 spectra. We then fit these line profiles, as well as the H profile from the Keck spectrum on day 976, with a shell having inner velocity and outer velocity ; see Fransson (1984a) for details. The variation of the emissivity within the shell is of minor importance; as long as the shell is reasonably thin, it only affects the wings of the lines (for ).
In Figure 3 we show a fit for the three lines with and . Given the simplicity of the model, the fits are surprisingly good, especially that of H. There is a minor asymmetry in the H line, where the red side would be better fit with and . There is some indication that the [N II] line has a somewhat smaller width than H, with . Because of the lower S/N compared to H, however, this is hardly significant.
Part of deficit on the red side of Mg II is caused by the interstellar Mg I absorption line from the host galaxy of SN 1993J (M81) and the Milky Way (see de Boer et al., 1993). This is, however, unlikely to explain the entire asymmetry. Additional interstellar Fe II absorption lines may possibly contribute, but these should not be stronger than the Mg I absorption, and therefore they only marginally affect the line. It is also difficult to understand the red deficit as a result of an intrinsic asymmetry of the Mg II-emitting region, since this should coincide with the H line, which does not show such a pronounced effect. In Section 4.2 we discuss a different explanation based on optical-depth effects in the emitting region.
Of the other UV lines, only N IV] is isolated enough for blending not to be important. The noise, however, makes the profile of this line uncertain. With this caveat, the line can be fit with the same line profile as for H.
For the region below 2000 Å, which is of most interest for the CNO abundance analysis, the blending of the lines requires a detailed spectral synthesis to derive accurate line fluxes. Because of the higher S/N of the N III]—C III] region compared to the N IV]—C IV region, we concentrate on the former. Based on line identifications in UV spectra of other supernovae and other photoionization-dominated objects, we have added lines from all ions in the interval 1600–2000 Å at the appropriate wavelengths and adjusted the relative fluxes to provide a best fit. The lines included are He II , O III] , N III] –1754.0, Ne III] , Si III] , and C III] . The relative intensities of the individual multiplet components are calculated for K and , values typical of the conditions in the outer ejecta. From models of the ejecta one also expects Al III to have a substantial fractional abundance. Because Al III are resonance lines, they in general have high optical depths, causing a scattering of lines blueward of Al III (especially the N III and Ne III] lines) to longer wavelengths. We calculated this scattering by a Monte Carlo procedure, taking the doublet nature of the lines into account. For all lines we assume a boxy line profile determined from N II] (see above). The Al III scattering is assumed to take place in the same region.
To increase the S/N in the abundance analysis we again use the averaged day 1063 and day 1399 spectrum. The result of the best-fit model is shown in Figure 4, and the individual line fluxes relative to the total flux of the N III] multiplet are given in Table 4. Because of blending and resonance scattering, the resulting spectrum has a complicated form. We note that most of the feature at 1620–1680 Å is due to He II, rather than to O III]. The latter flux is uncertain, and we can only give a conservative upper limit of times the N III] flux. The best fit in Figure 4 has an O III] flux only times the N III] flux. The peak at Å is caused by resonance scattering of Ne III] by Al III . The scattered Ne III] flux gives rise to some of the emission at Å. The uncertainties in the fluxes of the individual lines are difficult to quantify, but we estimate the N III] and the C III] fluxes to be accurate to .
Finally, we comment on the N IV] and C IV lines (see Fig. 1). While the N IV] line is clearly seen, the C IV doublet is unfortunately swamped by the continuum, as well as affected by the interstellar absorption. We can therefore only give a lower limit to the (N IV] )/(C IV ) ratio of . This limit is conservative, because we have assumed a lower continuum for C IV than for N IV]; it is likely that the true ratio is considerably higher.
3.2 SN 1998S
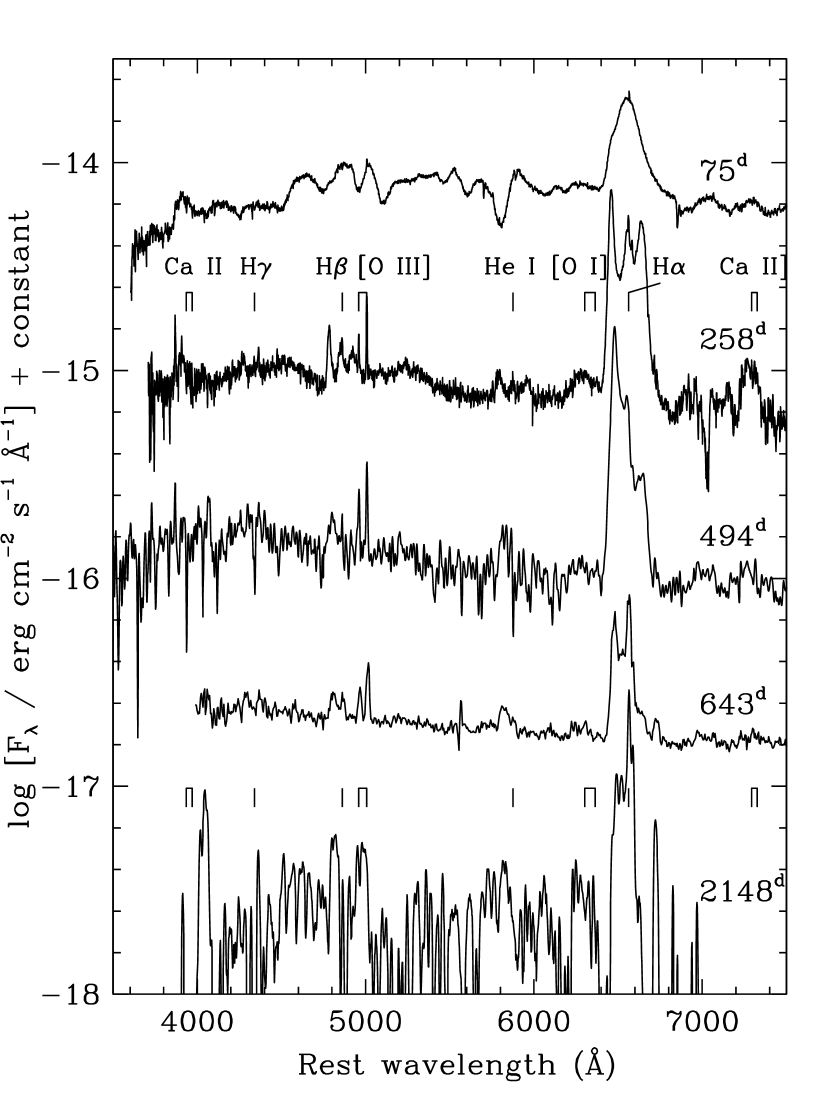
In Figure 5 we show the full spectral evolution of SN 1998S for the epochs where HST observations exist, while in Figure 6 the important far-UV region is shown in more detail. Finally, we show in Figure 7 the spectral evolution in the optical range for the nebular phase. This complements the observations in Leonard et al. (2000) by adding the very late spectra at 643 and 2148 days.
The spectrum during the first 1–2 months is mainly a continuum with superimposed P-Cygni lines, as discussed by Lentz et al. (2001). By day 72 several strong emission lines have emerged. The lines can be divided into narrow lines with full-width at half-maximum (FWHM) , and broad lines extending up to (half-width near zero intensity; HWZI); they are likely to originate in the circumstellar medium and in ejecta gas, respectively.
3.2.1 Broad Lines
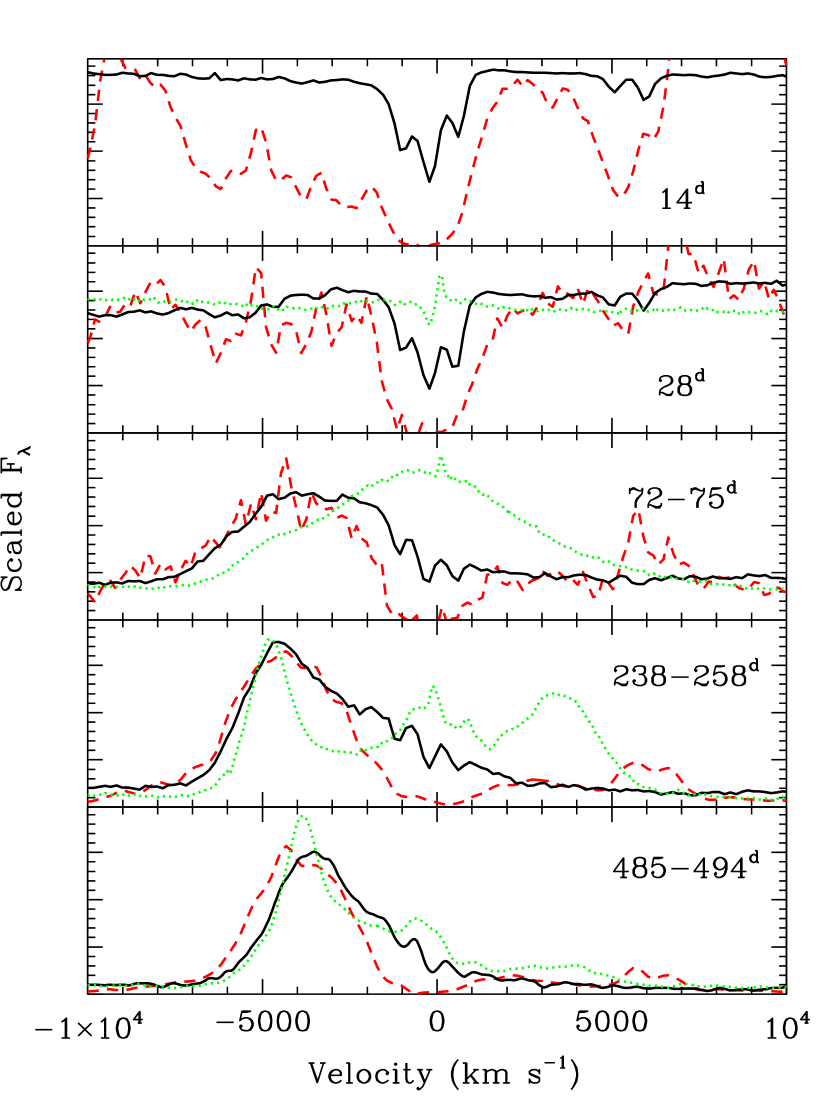
The strongest of the broad lines are Ly, H, and Mg II . In Figure 8 we compare their profiles throughout the course of the HST observations. The flux scale is linear and varies for the different lines and dates to facilitate a comparison. During the first two epochs only the central absorptions of Ly and Mg II are visible. These features are shown in detail in high-resolution spectra published by Bowen et al. (2000), where both a Galactic and a host-galaxy component are seen, in addition to a component from the circumstellar medium of SN 1998S. Ly is even more affected by interstellar absorptions. Because of the large H I column density, these lines show strong damping wings, extending Å from the line center.
On day 72 and later, both Ly and Mg II have developed a strong blue emission component. The shapes of the Ly and Mg II lines are similar within the uncertainties, with the blue wing at least a factor of 10 stronger than the red. The lines extend on day 72 to (HWZI). In the later spectra a marginal decrease in this velocity can be seen.
We immediately note the difference between the H line profile on the one hand and Ly and Mg II on the other hand. While the former line up to the 238–258 day spectrum shows a fairly strong red component, this is missing for the latter. Further, in the day 72–75 spectrum the H line is peaked at , and extends to zero velocity. The flux of both Ly and Mg II, however, drops close to zero already at . As is seen from the earlier spectra, one reason for this difference is likely to be interstellar Ly and Mg II absorption from our Galaxy and from the host galaxy. Even considering this, the low fluxes in the red wings of Ly and Mg II make them distinctly different from H.
The evolution of the shape of the H line has been discussed in several papers (Leonard et al., 2000; Gerardy et al., 2000; Fassia et al., 2001; Pozzo et al., 2004). Our observations, however, cover a longer time interval. In Figure 9 we show the temporal evolution of the H line from day 75 to day 2148. From being symmetric during the first months, as seen in the day 75 spectrum, the line developed a clear asymmetry by day 100, with the blue wing considerably fainter than the red. By day 200 the line again changed character, now with a considerably fainter red wing compared to the blue, as seen in the day 258 spectrum (see also Fig. 4 in Gerardy et al., 2000). This evolution continued, and by day 653 the red wing was almost gone. In the very late spectrum on day 2148 the blue peak had almost disappeared, and instead the central peak was strong. The red part of the line is still much weaker than the blue. The absolute level, however, is uncertain due to the difficulty of an accurate background subtraction.
A central peak is seen in the spectra at several epochs. It is, however, not clear that this peak is of supernova origin. The flux of this peak relative to the rest of the line is sensitive to the subtraction of the background emission from the galaxy, and therefore to the atmospheric seeing. In particular, the reality at the last epochs is questionable. In these the background [N II] lines at and , respectively, can clearly be seen, which shows that there is contamination from the background. The fact that a peak is not seen in the Mg II line, observed with HST, further strengthens this conclusion.
From Figure 9 we note the clear decrease in the velocity of the blue peak from 4,300–4,700 on days 108–258 to on days 494 and 653. The maximum blue velocity decreases marginally from , to . In addition to the dramatic change in the line profile, the large Balmer decrement is of special interest, as noted earlier by Leonard et al. (2000), who argue that this strongly implies an origin in gas of very high density.
By day 72 the Mg II line already showed a strong red-blue asymmetry, which persisted throughout the duration of the remaining observations, but there is no indication of a red peak in this line. The Ly line, however, shows an indication of a red peak in the spectra after day 72. Gerardy et al. (2000) propose that the fading of the red peak relative to the blue can be explained as a result of dust formation. The fact that the red wings of Mg II and Ly are suppressed earlier than H is consistent with this interpretation, as is the dust signature seen in the infrared (Gerardy et al., 2002). For a standard extinction curve, the optical depths at Mg II and Ly are related to that at H by and .
Other broad lines at , 1344, 1380, 1790, and 1880 Å are less obvious to identify. We note, however, the similar profiles of these lines to that of the Mg II line. Based on the velocity shift of the blue peak, we find that a consistent set of line profiles can be obtained if we identify these lines as O I –1306.0, O I –1358.5, Si IV , [Ne III] , and C III] –1908.7, respectively. The presence of broad O I lines in the UV is not surprising in view of the broad O I –7775.4 features identified by Fassia et al. (2001); both sets of lines probably arise as a result of recombination. We return to the implications of the presence of these lines in §4.1.
In Figure 10 we show the day 72–75 optical and UV line profiles on a common velocity scale. There is some indication for a broad component of C IV , but this is marginal. For N V , N IV] , and N III] –1754.0 there is no evidence for any broad components above the noise. From the figure we note that there is marginal evidence for a somewhat smaller extension of the blue wing of H (to ) compared to Mg II. The Ly, C III], Si IV, and O I lines have velocities consistent with the Mg II line. The [O I] lines seem to be considerably narrower, but their shape is affected by neighboring lines, as well as by the large separation of the doublet components.
The [O III] region is similarly complicated by the doublet nature, as well as by the neighboring line. In the spectra from 75–137 days, there is a clear feature at approximately the position of the [O III] lines (Figure 7). The peak is redward of the rest wavelength, but this is also approximately the case for . To test this more quantitatively we have used the profile to create a synthetic spectrum, including and [O III] , adjusting the line strengths so as to give a best fit to the 4700–5200 Å region. The result of this, however, gives a peak that is too blue, at Å. In addition, the [O III] component gives a too shallow red wing of the line. We therefore conclude that the feature at Å in the early spectra is unlikely to be due to [O III], but is probably an Fe II line with Å. In the spectra later than days there is a faint line at the [O III] wavelength, best seen in the last spectrum at 2148 days, which is most likely from [O III]. The line profile of the [O III] line is, within the errors, similar to that of , with a heavily absorbed red component.
Other lines in the optical spectrum in Figure 7 are discussed by Gerardy et al. (2000), Leonard et al. (2000), Fassia et al. (2001), and Pozzo et al. (2004). We only remark that in our last two spectra on days 643–653 and 2148 we see the same lines as in the earler spectra, in particular H, He I , [O I] , and [O III] .
3.2.2 Narrow Lines
Because of the relative lack of blending, the identification and flux measurements of the narrow circumstellar lines are considerably simplified compared to the broad lines. This is particularly true when we compare with the flux measurements of the far-UV lines of SN 1993J, where we had to use a complicated deblending procedure.
In Table 5 we give the fluxes of the narrow lines below 2300 Å. Because of the strong continuum and the influence of P-Cygni absorptions of several lines, the day 28 fluxes are uncertain. The noise level of the days 238 and 485 spectra are such that the fluxes are also very uncertain for many of the lines. In the subsequent abundance analysis we therefore restrict ourselves to the day 72 spectrum, which has a suitable combination of high S/N and well-defined emission lines (see Fig. 6).
In Figure 11 we show the day 72 spectrum shortward of 2000 Å in greater detail, together with line identifications. Based on their observed rest wavelengths in the day 72 spectrum, 1394.0 Å and 1403.1 Å, we identify these lines as coming from Si IV rather than O IV. The FWHM of N IV] is consistent with being unresolved, noting that the resolution is at this wavelength. High-resolution optical and UV observations during the first month showed two low-velocity components (Fassia et al., 2001; Bowen et al., 2000). While [O III] , for example, had a FWHM of 50–60 , the intermediate-velocity H absorption component extended to . Unfortunately, the limited resolution of our spectra prevents us from relating the narrow emission lines to one or the other of these components. The C IV doublet is clearly resolved in the day 72 spectrum. Also, the Si IV and the N V doublets are resolved in the same spectrum. The intensity ratio (N V )/(N V ) is . In the region longward of 2000 Å, narrow lines of [N II] are clearly present, as well as C II] –2328.8.
For the following discussion we note that the uncertainties in the fluxes in the day 72 spectrum are 7–9% for all lines, except for the N III] lines (%). For the other dates the uncertainties are considerably larger. These values only include the noise, estimated in the neighborhood of each line. In addition, there may be systematic errors originating from the assumed level of the continuum, as well as from line blending; in contrast to SN 1993J, however, these errors are likely to be small because of the well-defined line profiles.
As for SN 1993J, the high noise level in the 1600–1700 Å region prevents us from giving a reliable O III] flux. As an upper limit to the flux we find .
4 DISCUSSION
4.1 Origin of the Emission Lines
As has been discussed elsewhere (e.g., Chevalier & Fransson, 1994, 2003), the origin of the broad lines seen in SN 1993J and SN 1998S can be explained as a result of photoionization by X-rays and UV emission from the radiative reverse shock propagating into the supernova ejecta. The reprocessed radiation from the low-density, unshocked ejecta emerges mainly as UV lines of highly ionized species like C III-IV, N III-V, and O III-VI. Because of cooling, a dense shell is formed behind the reverse shock — that is, between the reverse shock and the contact discontinuity. The high density in this region causes the reprocessed radiation to emerge mostly as emission from neutral or singly ionized ions, such as H I lines, Mg II, and Fe II.
While the box-like line profiles in SN 1993J (Fig. 3) are consistent with those coming from a narrow, spherical shell, the geometry of the line-emitting region in SN 1998S is less clear. Gerardy et al. (2000) interpret the double-peaked H line profile as a result of the interaction of the ejecta with a circumstellar ring (see also Chugai & Danziger, 1994). The centrally peaked profile is explained by a separate component — a spherical distribution of shocked circumstellar clouds. Similar ideas are proposed by Leonard et al. (2000), who relate this picture to a binary scenario, reminiscent of that discussed for SN 1987A.
Although there is no quantitative discussion of this hypothesis, some features in this scenario may be understood from the general picture in Chevalier & Fransson (1994). The broad wings would then represent the emission from the ejecta, while the narrow component is from the shock propagating into the ring, and possibly also the reverse shock, in case this is radiative. Most of the UV and optical line emission is then produced as a result of photoionization of the ejecta, as well as the ring and the cool postshock gas. The ingoing fraction will mainly be absorbed by ejecta gas close to the reverse shock, explaining the ring-like emission also from the ejecta component. The density distribution of the ejecta is likely to be more uniform with respect to polar angle, possibly resembling the non-spherical models of Blondin, Lundqvist, & Chevalier (1996). We return to this scenario in the next section.
In SN 1995N (Fransson et al., 2002), there was a clear distinction in the line widths of the hydrogen and Mg II lines compared with those of the high-ionization UV metal lines. While the former had smoothly declining line profiles with velocities (HWZI) up to , the latter were box-shaped with HWZI . No such distinction is obvious either for SN 1993J or SN 1998S.
The strong O I recombination lines present in SN 1998S resemble those seen in SN 1995N. In Fransson et al. (2002), it was argued that in order to explain their strengths relative to the hydrogen lines, they had to originate in processed gas with a high abundance of oxygen. We believe the same is true for SN 1998S as well, which indicates that some of the gas giving rise to the broad metal lines comes from processed gas. SN 1993J also has strong metal lines in the UV, as well as in the optical, which grow stronger with time relative to H (Matheson et al., 2000b). Hence, there cannot be a large mass of hydrogen present between the reverse shock and the oxygen-rich core. It is likely that SN 1993J, SN 1995N, and SN 1998S had lost most of their hydrogen-rich gas, and the helium and oxygen core is therefore efficiently illuminated by the X-rays from the reverse shock.
The origin of the relatively narrow lines seen in SN 1998S, and in other SNe IIn, is less clear. Given their small velocity width, they must arise in circumstellar gas. This can either be unshocked gas in front of the shock, or dense regions shocked by the blast wave.
4.2 Asymmetric Emission and Dust Formation in SN 1998S
As mentioned in §1, there are several indicators of dust present in SN 1998S, both from the line profiles and from the strong infrared excess (Gerardy et al., 2002; Pozzo et al., 2004). In addition, the double-peaked line profiles provide a very interesting clue to the nature of the line-emitting region. Gerardy et al. (2000), in particular, attribute this to emission by a torus-like region. In this section we discuss the dust and the geometry of the line-emitting region.
The location and nature of the dust is not clear. An obvious candidate is dust formed in the heavy-element enriched ejecta. If most of the line emission comes from a shell close to the reverse shock, the dust in the core will primarily absorb the high-velocity emission from the receding ejecta, in agreement with the observations. This is the scenario favored by Gerardy et al. (2000) for the asymmetric line profiles. Gerardy et al. (2002), however, find that the same dust cannot explain the excess emission seen in the infrared. Instead, they attribute this to an echo from pre-existing dust.
Another interesting possibility is that the dust absorption, as well as the emission, takes place in the cool dense shell (hereafter CDS) in the shock region (Deneault, Clayton, & Heger, 2003). This is a favorable place for dust formation because of its high density and low temperature (Fransson, 1984b; Chevalier & Fransson, 1994). Whether it is cool enough, given the X-ray heating from both shocks, remains to be demonstrated quantitatively. The fact that the gas swept up by the shocks may be enriched by heavy elements may be important in this context. Indications for metal enrichment in SN 1998S are also presented from X-ray observations by Pooley et al. (2002). The temperature of the emission should be close to the condensation temperature, which agrees with the Gerardy et al. (2002) temperature estimate of the dust emission, 700–1400 K. Recently, Pozzo et al. (2004) find that the luminosity and temperature of the IR emission gives a blackbody radius corresponding to a velocity of at 330–400 days. This is comparable to the velocity of the blue and red peaks of the line at this time. Later, the blackbody velocity of the dust receeds to , indicating a thinning of the dust.
A problem with this idea is that the dust is likely to condense behind the zone relative to the reverse shock where H, Mg II, and other low-ionization lines are formed. If the CDS is formed behind the reverse shock (in the Lagrangian sense), this means that both the front and back side line emission will be absorbed by the dust, contrary to the observations. A solution to this may come from the fact that hydrodynamical mixing may give rise to a clumpy CDS (Chevalier & Blondin, 1995). This could lead to a covering factor of the dust less than unity, and allow some of the to penetrate.
An alternative, related possibility, discussed for SN 1993J by Fransson, Lundqvist, & Chevalier (1996), is that the forward shock is radiative. In this case the line emission from the receeding part of the shell (red wing) will be absorbed by the dust shell, while the line emission from the front (blue wing) can emerge freely. Although dismissed for SN 1993J, a high circumstellar density, as may be the case for SN 1998S, may make this a real possibility. Alternatively, there may be a combination of ejecta dust absorption and emission from dust created in the CDS. The latter then has to be either clumpy or optically thin, in order to not block the line emission from the shell.
Finally, we note that emission from perhaps 2–4 of cold dust from Cas A has recently been claimed by Dunne et al. (2003). This estimate of the amount of dust, however, has been questioned by Dwek (2004), who finds that a more reasonable mass of only is needed, if the dust is in the form of conducting, metallic needles. This illustrates the sensitivity of the mass estimate to the nature of the dust. But the most interesting result of Dunne et al. (2003) is that the dust emission in Cas A is concentrated in the region between the reverse and forward shocks. This is consistent with the scenario above where the dust is formed in the CDS during the first years after the explosion.
To study the different scenarios for the dust absorption above in more detail, as well as the effects of an asymmetric emission, we have calculated several models for the line profiles. In particular, we have considered the different possibilities discussed above for the location of the dust-absorbing region.
To explain the double-peaked nature of the H line, we assume in this section that the emission originates in a torus-like region, similar to that proposed by Gerardy et al. (2000). Some support for this also comes from the polarization data for SN 1998S presented by Leonard et al. (2000). This region is characterized by the inner and outer velocities ( and , respectively), the angular thickness from the equatorial plane (), and the inclination of the torus relative to the line of sight (, where is an edge-on torus). We assume the emissivity within this region to be constant in both the radial and polar directions. The line is assumed to be optically thin.
To model the dust absorption we consider three different locations, either inside the ejecta, behind the reverse shock, or behind the circumstellar shock. We assume the dust to be opaque, but vary the total areal covering factor, .
In Figure 12 we first show line profiles without absorption, but at four different inclination angles (, and ) and for several values of the angular thickness from the equatorial plane of the torus. We see here that widely different line profiles may result, depending on the inclination and angular thickness of the torus. In particular, both double-peaked profiles and centrally peaked profiles may arise — the former mainly at low inclinations, while the latter occur for high inclinations and high angular extent of the torus.
By varying the angular thickness of the torus we can create a sequence of line profiles, which approximately resembles the observed evolution of the line. In principle, one could therefore think of an evolutionary time sequence from a large angular thickness to a smaller one. This could, for example, result from the interaction of the supernova with a flattened circumstellar environment, of which a thick disk is the most extreme example. As the supernova expands, the angular extent of the torus would then decrease, and the above evolution in would result. We believe this to be the most promising of the torus models.
To this emission we can now add dust absorption according to the various possibilities discussed above. The cases with dust absorption outside of the -emitting region all have the problem that the red wing is considerably stronger than the blue wing. This conclusion is independent of the inclination, the angular thickness, and the covering fraction of the dust. Because this is in contradiction to the observations, we do not further consider these cases.
If we instead assume that the dust absorption occurs inside of the -emitting region, as would be the case for a radiative forward shock, the line profiles are more similar to those observed. As an example, we show in Figure 13 a model with , , , and different values of the angular extent . The line profile with has an approximate resemblance to the profiles on days 75–137 in Figure 9, while the profiles at the later epochs resemble those of smaller .
A major problem with this picture, however, is that the extent in velocity of the blue wing is expected to decrease by a factor of about two with time during this evolution, as shown in Figure 13. The reason is simply that the velocity along the line of sight decreases as the thickness decreases, and is difficult to avoid. Also, the extent of the flat, weak red wing is difficult to reproduce in this model.
Finally, we consider the case with absorption from dust formed in the ejecta. A total obscuration by this dust is not compatible with the presence of a weak, but finite red wing of the lines. A partial dust obscuration, like the one in SN 1987A (Lucy et al., 1991) is, however, both more realistic and compatible with the observations. To explain the temporal evolution from a centrally peaked profile to a double-peaked profile, we must refer to a situation similar to that in Figure 13. Although the red part of the line may be better reproduced by this configuration, it has the same problem with a too rapidly decreasing line width as the model above. In addition, it is difficult to reproduce the central peak without an additional component, like the one invoked by Gerardy et al. (2000). The reality of this peak is, however, not clear.
In summary, we find it difficult to reproduce the observed evolution of the line profiles with an emitting region in the form of a torus. This is independent of the dust absorption, although more complicated models cannot definitely be ruled out.
4.3 Line Formation in the Cool Dense Shell
While the line profiles of the broad lines in SN 1998S are very clear cases of double-peaked profiles, this also applies to the , Mg II, and lines in SN 1993J (see Figure 2). In the case of SN 1993J there are no indications of major non-spherical structures. On the contrary, VLBI imaging shows a basically spherical shell (Marcaide et al., 1997; Bietenholz, Bartel, & Rupen, 2001), which excludes a flattened structure unless we are very close to the axis of symmetry. Therefore, the torus model for the peaks in the line profile is in the case of SN 1993J unlikely also for this reason.
An alternative explanation, applying to both SN 1993J and SN 1998S, is based on the fact that both the and Mg II lines are resonance lines, and therefore optically very thick. This is in most cases true also for (Chevalier & Fransson, 1994). If, in addition, the line-emitting region is geometrically sufficiently thin, the Sobolev approximation will break down and photons from the emitting shell may be absorbed locally, giving rise to a tilted or double-peaked line (e.g., Rottenberg, 1952; Kunasz & Hummer, 1974; Bertout & Magnan, 1987; Cid Fernandes & Terlevich, 1994). Because both the hydrogen and Mg II lines are likely to be dominated by emission from the narrow CDS between the reverse shock and the contact discontinuity (see §4.1), this region may be too narrow for the Sobolev approximation to be valid.
Bertout & Magnan (1987) have discussed this case and find that “M-shaped” profiles result if three conditions are met: (1) The medium must be optically thick in the line. (2) The shell must be thin enough for the velocity gradient over the shell to be small compared to the thermal velocity. (3) The macroscopic velocity must be larger than the thermal velocity. The reason for the high velocity peaks may be traced back to the fact that the projected area contributing to a frequency interval in this limit is proportinal to , where is the rest ferquency of the line.
As we discuss above, the first of these conditions is true for and Mg II, and in most cases also for . The second condition is interesting. Lines coming from the ejecta, for example, are generally formed over a fairly large velocity range (Chevalier & Fransson, 1994), and are therefore expected to have flat-topped profiles. Lines coming from the CDS, on the other hand, arise in a very narrow shell, no larger than a few times cm (Chevalier & Fransson, 1994). If we assume that (which is not strictly valid in the CDS, but will provide a conservative estimate), a velocity gradient equal to the thermal velocity () corresponds to a distance cm. Here is the atomic weight of the ion, is the radius of the CDS, and the electron temperature in the CDS. Therefore, the velocity gradient in the CDS is likely to be small enough for the the second condition to be valid. This may, however, vary from case to case, as well as over time. A “microturbulence” in the shell should have the same effect. Condition (3) is fulfilled in all interesting cases. Double-peaked line profiles can therefore be expected in cases where the CDS is sufficiently narrow.
The fact that the line in SN 1998S evolves from a centrally peaked line profile (before days) to the double-peaked profile at late epochs may be a result of the fact that the width of the CDS at early epochs was large enough for the Sobolev case to apply (note that ). In this case, a nearly constant velocity in the shell implies a parabolic line profile.
We therefore conclude that it is likely that the double-peaked profiles in SN 1998S and, to a less dramatic extent, SN 1993J arise as result of the extremely small thickness of the CDS, in combination with a high optical depth. Because the width of the CDS is a function of the mass-loss rate and reverse-shock velocity (Chevalier & Fransson, 1994), the line profiles provide a useful diagnostic of the conditions behind the reverse shock.
The asymmetry of the red and blue wings of the lines may be caused by either dust or bound-free absorption by the Balmer and Paschen continua from the ejecta and circumstellar interaction region, as discussed in Section 4.2. In the latter case, the larger asymmetry for the Mg II line compared to H in SN 1993J would then be a result of the larger optical depth in the Balmer continuum. Dust absorption from the same region would have the same effect. While bound-free absorption should decrease with decreasing wavelength, dust absorption would increase. This could be checked by comparison with the [N II] profile. Unfortunately, there are no observations of SN 1993J in the far-UV region on day 670, when the Mg II asymmetry is largest. Given that there is strong evidence for dust emission, the dust interpretation seems most likely.
The origin of the central peak, if coming from the supernova rather than the background H II regions, is not clear. Gerardy et al. (2000) suggested emission from shocked circumstellar clumps, but it may also be possible to explain it as an effect of the line formation process in the cold, dense shell.
We remark that this model does not naturally explain the polarization seen in SN 1998S (Leonard et al., 2000; Wang, Howell, Höflich, & Wheeler, 2001). The origin of this may, however, be in the density distribution of the ejecta inside of the interaction region. A non-spherical cold dense shell, giving rise to the polarization, would also be compatible with the line profile.
4.4 CNO Ratios in SN 1993J and SN 1998S
The strong N III] and N IV] lines in both SN 1993J and SN 1998S indicate nitrogen enrichment in the supernova ejecta and in the circumstellar gas. To quantify this we make a nebular analysis similar to that in Fransson et al. (1989). Assuming that the ionization zones of the corresponding C and N ions coincide, which is reasonable (see Fransson, 1984b; Fransson et al., 1989, and references therein), one can calculate the N III/C III and N IV/C IV ionic ratios as a function of temperature and density. Because reasonable densities are considerably less than the critical values for these ions (), the density is unimportant for the result. Further, because of the similar excitation potentials of these lines, the temperature is only of minor importance (see below). For the calculations below we use a temperature of K and an electron density of . In the analysis we have used collision strengths and transition probabilities from the compilation by Pradhan & Peng (1995). For SN 1998S we have used a reddening of mag and for SN 1993J, mag (Richmond et al., 1994; Leonard et al., 2000).
For SN 1998S we find N III/C III and N IV/C IV , where the errors have been estimated from the uncertainties given in §3.2.2, and do not include systematic errors. From the O III] limit, we find a lower limit of N III/O III . In Table 6, we give the correction factors for these ionic ratios for other temperatures and densities. We see that these never exceed 20%, and are therefore of the same order as the uncertainties in the flux measurements.
For the N/C ratio we take a weighted average of the N III/C III and N IV/C IV ratios, and obtain N/C . In addition, there are systematic errors from the uncertainty in the temperature and the differences in the extents of the ionization zones. From Table 6, the former can be estimated to be at most 15%. The ionization structure depends on the ionizing source, which may be either the X-rays from the shock wave, or possibly the flux in connection to the breakout of the shock through the photosphere, similar to the situation for the ring of SN 1987A. In that case Lundqvist & Fransson (1996) found that a detailed time-dependent photoionization model resulted in N/C and N/O ratios which were % lower than those resulting from a simple nebular analysis along the lines in this paper. As a realistic estimate of the N/C ratio we therefore take N/C .
Similarly, we obtain for SN 1993J from the N III]/C III] ratio in Table 4 the value N III/C III . From the lower limit of the N IV] /C IV ratio of 1.5 we obtain N IV/C IV , which is compatible with the N III/C III ratio. We therefore take N/C . The limit of N III] –1754.0/O III] translates into N III/O III , which we also take as a limit to the N/O ratio. As we pointed out in §3.1, the feature at Å is more compatible in wavelength with He II than with the O III] line, and it is therefore likely that the N/O ratio is larger than the lower limit given above.
Because of the complex deblending procedure in SN 1993J, as well as its lower S/N, the errors in abundances are larger than for SN 1998S, and we estimate that these may be ; thus, N/C and N/O .
To illustrate the level of carbon depletion in SN 1993J, we have calculated a synthetic spectrum with solar ratios of C, N, and O. This is shown as the dashed line in Figure 4, where we have kept the N III] flux at the same level. The flux of the C III] line has increased by a factor .
4.5 Comparison with CNO Processing in Other Supernovae
CNO abundance ratios have now been measured for a number of SNe. The SN II-L 1979C was the first supernova shown to exhibit enhanced nitrogen abundances; Fransson et al. (1984) find N/C = and N/O . The best-studied case to date is the ring of SN 1987A, from which narrow emission lines of C III-IV, N III-V, and O III-IV were observed. Using a nebular analysis similar to the one presented in this paper, Fransson et al. (1989) found that N/C and N/O . Their analysis was later improved using a self-consistent model of the ring emission, yielding N/C = and N/O (Lundqvist & Fransson, 1996). The discrepancy between these abundance ratios gives a reasonable estimate of the systematic errors due to differences in the ionization zones, as well as the temperature of the gas. SN 1995N was the first SN IIn to have a C/N ratio determined, from a spectral analysis of broad ejecta lines similar to that of SN 1979C and SN 1993J. In Table 7, we summarize CNO ratios for SN 1979C, SN 1987A, SN 1993J, SN 1995N, and SN 1998S. Because of blending, the broad-line determinations are affected by a larger uncertainty, compared to values from the narrow circumstellar emission lines in SN 1987A and SN 1998S. This applies especially to SN 1995N.
From Table 7 we see that in all cases where CNO abundances have been measured, the N/C ratio is considerably larger than the solar value, N/C (Grevesse & Sauval, 1998). The N/O ratio is more uncertain due to the problems with O III] . The only well-determined case is SN 1987A, where N/O , again much larger than the solar value N/O .
All supernova progenitors in Table 7 are believed to have undergone extensive mass loss prior to the explosion. Models of SN 1987A suggest that , out of the original hydrogen envelope mass, were lost before the explosion (e.g., Shigeyama & Nomoto, 1990). This may be characteristic for Type II-P progenitors, although one should keep in mind that the SN 1987A progenitor was not typical for a Type II-P, and that the progenitor mass was relatively high. For the other Type II subclasses, Nomoto, Iwamoto, & Suzuki (1995) have proposed a binary scenario, where the SNe II-L and SNe IIn have lost a moderate amount of the hydrogen envelope, while SNe IIb have an envelope mass . Type Ib and Ic SNe have lost all of their hydrogen envelope, and in the case of SNe Ic also the helium mantle. As we discussed in §4.1, for SN 1993J, SN 1995N, and SN 1998S there is strong evidence that the progenitors had lost most of their hydrogen envelopes before the explosion.
With this background, it is tempting to see the nitrogen enrichment in these SNe as being a result of this mass loss. A more quantitative comparison is, however, not straightforward. Stellar evolutionary models of massive stars, including effects of mass loss, rotation, and binarity, have been calculated by several groups. In particular, rotation can have a large effect on the CNO abundances by increasing the mixing from the CNO burning region already in the main-sequence phase (Meynet & Maeder, 2000; Heger & Langer, 2000). Binary mass exchange produces a result which, unfortunately, is not easily distinguished from that of rotation (Wellstein & Langer, 1999).
The nitrogen enrichment in SN 1987A has put considerable constraints on progenitor models (for reviews see Podsiadlowski, 1992; Woosley, Heger, & Weaver, 2002). Here the problem is to explain the blue progenitor, the red-to-blue supergiant ratio in the LMC, and the CNO ratios in a consistent model. To fulfill all these constraints has turned out to be difficult in single-star scenarios. For example, Saio, Nomoto, & Kato (1988) had to artificially invoke complete mixing of the hydrogen envelope.
Hillebrandt & Meyer (1989), Podsiadlowski, Joss, & Rappaport (1990), and Ray, Singh, & Sutaria (1993) have argued that binary models, in particular merger models, should be more successful in these respects. The nitrogen enrichment is then a natural consequence of the merger or accretion process, which adds both angular momentum and energy; this may in turn induce large-scale mixing of the envelope. In addition, the triple-ring structure may be more naturally explained in this kind of scenario. A problem may be that such models require some fine tuning of the precise epoch when the merger takes place (see, e.g., Woosley, Heger, & Weaver, 2002).
Of the remaining SNe, the N/C ratio of SN 1993J may be the easiest one to explain. Light-curve calculations (Nomoto et al., 1993; Woosley et al., 1994) and spectral models (Patat, Chugai, & Mazzali, 1995; Houck & Fransson, 1996) have shown that the hydrogen envelope of SN 1993J must have had a mass of less than at the time of the explosion. For this to occur without too much fine tuning, a binary model is most natural. Both of these properties make mixing of CNO-processed products to the surface natural.
Nitrogen enrichment has also been found in older supernova remnants, most notably in Cas A. Chevalier & Kirshner (1978) discovered an overabundance of nitrogen by an order of magnitude in the quasi-stationary flocculi, presumably originating from the clumpy wind of the progenitor. Lamb (1978) explained this enrichment as a result of CNO burning in combination with mass loss from a progenitor of 15–25 . Moreover, Fesen & Becker (1991) and Fesen (2001) identified fast-moving knots rich in both hydrogen and nitrogen. Some of these were found outside the main blast wave. These must have been expelled from the photosphere of the progenitor at the time of the explosion, showing that the progenitor had at least a thin nitrogen-enriched hydrogen envelope. Based on these observations Chevalier & Oishi (2003) have suggested that the progenitor of Cas A was a Type IIb or IIn supernova. The broad wings seen in H for both SN 1998S and SN 1995N (Fransson et al., 2002) may have originated in comparable high-velocity clumps, which have penetrated the supernova blast wave. The narrow component may be similar to the quasi-stationary flocculi. Finally, for Cas A we have already noted the possibility of a similar scenario for the dust formation as for SN 1998S.
5 CONCLUSIONS
The most important result of the observations presented here is the strong indication of nitrogen enrichment in both SN 1993J and SN 1998S. This, together with similar evidence from other SNe II, puts strong constraints on their progenitors. The CNO enrichment also gives independent support for mass loss from the progenitors. The line profiles and the presence of high-ionization lines are direct indicators of the ionizing effects from the reverse shock wave, in qualitative agreement with that expected from models of circumstellar interaction. The double-peaked nature of the line profiles is interpreted as a result of the emission from the cool dense shell behind the reverse shock, rather than a torus, and can serve as an important diagnostic of the former. The quantitative features of this, however, remain to be demonstrated. From the asymmetry of the line profiles in SN 1998S we find additional support for dust formation in the ejecta.
References
- Anupama, Sivarani, & Pandey (2001) Anupama, G. C., Sivarani, T., & Pandey, G. 2001, A&A, 367, 506
- Barbon et al. (1995) Barbon, R., Benetti, S., Cappellaro, E., Patat, F., Turatto, M., & Iijima, T. 1995, A&AS, 110, 513
- Baron, Hauschildt, & Branch (1994) Baron, E., Hauschildt, P. H., & Branch, D. 1994, ApJ, 426, 334
- Bertout & Magnan (1987) Bertout, C., & Magnan, C. 1987, A&A, 183, 319
- Bietenholz, Bartel, & Rupen (2001) Bietenholz, M. F., Bartel, N., & Rupen, M. P. 2001, ApJ, 557, 770
- Blondin, Lundqvist, & Chevalier (1996) Blondin, J. M., Lundqvist, P., & Chevalier, R. A. 1996, ApJ, 472, 257
- Bowen et al. (2000) Bowen, D. V., Roth, K. C., Meyer, D. M., & Blades, J. C. 2000, ApJ, 536, 225
- Chevalier & Blondin (1995) Chevalier, R., & Blondin, J. M. 1995, ApJ, 444, 312
- Chevalier & Fransson (1994) Chevalier, R. A., & Fransson, C. 1994, ApJ, 420, 268
- Chevalier & Fransson (2003) Chevalier, R. A., & Fransson, C. 2003, in Supernovae and Gamma-Ray Bursts, ed. K. W. Weiler (New York: Springer-Verlag), p. 171
- Chevalier & Kirshner (1978) Chevalier, R. A., & Kirshner, R. P. 1978, ApJ, 219, 931
- Chevalier & Oishi (2003) Chevalier, R. A., & Oishi, J. 2003, ApJ, 593, L23
- Chugai (2001) Chugai, N. N. 2001, MNRAS, 326, 1448
- Chugai & Danziger (1994) Chugai, N. N., & Danziger, I. J. 1994, MNRAS, 268, 173
- Chugai et al. (2002) Chugai, N. N., Blinnikov, S. I., Fassia, A., Lundqvist, P., Meikle, W. P. S., & Sorokina, E. I. 2002, MNRAS, 330, 473
- Chugai et al. (2004) Chugai, N. N., Blinnikov, S. I., Cumming, R. J., Lundqvist, P., Bragaglia, A., Filippenko, A. V., Leonard, D. C., Matheson, T., & Sollerman, J. 2004, MNRAS, in press
- Cid Fernandes & Terlevich (1994) Cid Fernandes, R. C., & Terlevich, R. 1994, in Violent Star Formation, From 30 Dorados to QSOs, ed. G. Tenorio-Tagle (Cambridge: Cambridge Univ. Press), p. 365
- de Boer et al. (1993) de Boer, K. S., Pascual, P. R., Wamsteker, W., Sonneborn, G., Fransson, C., Bomans, D. J., & Kirshner, R. P. 1993, A&A, 280, L15
- Deneault, Clayton, & Heger (2003) Deneault, E. A.-N., Clayton, D. D., & Heger, A. 2003, ApJ, 594, 312
- Dunne et al. (2003) Dunne, L., Eales, S., Ivison, R., Morgan, H., & Edmunds, M. 2003, Nature, 424, 285
- Dwek (2004) Dwek, E. 2004, ApJ, in press, astro-ph/0401074
- Fabricant et al. (1998) Fabricant, D., Cheimets, P., Caldwell, N., & Geary, J. 1998, PASP, 110, 79
- Fassia et al. (2000) Fassia, A., et al. 2000, MNRAS, 318, 1093
- Fassia et al. (2001) Fassia, A., et al. 2001, MNRAS, 325, 907
- Fesen (2001) Fesen, R. A. 2001, ApJS, 133, 161
- Fesen & Becker (1991) Fesen, R. A., & Becker, R. H. 1991, ApJ, 371, 621
- Fesen et al. (1999) Fesen, R. A., et al. 1999, AJ, 117, 725
- Filippenko (1982) Filippenko, A. V. 1982, PASP, 94, 715
- Filippenko (1997) Filippenko, A. V. 1997, ARA&A, 35, 309
- Filippenko & Matheson (2004) Filippenko, A. V., & Matheson, T. 2004, in Supernovae: 10 Years of SN 1993J, ed. J. M. Marcaide and K. W. Weiler (New York: Springer-Verlag), in press
- Filippenko, Matheson, & Barth (1994) Filippenko, A. V., Matheson, T., & Barth, A. J. 1994, AJ, 108, 2220
- Filippenko, Matheson, & Ho (1993) Filippenko, A. V., Matheson, T., & Ho, L. C. 1993, ApJ, 415, L103
- Finn et al. (1995) Finn, R. A., Fesen, R. A., Darling, G. W., Thorstensen, J. R., & Worthey, G. S., 1995, AJ, 110, 300
- Fransson (1984a) Fransson, C. 1984a, A&A, 132, 115
- Fransson (1984b) Fransson, C. 1984b, A&A, 133, 264
- Fransson et al. (1984) Fransson, C., Benvenuti, P., Wamsteker, W., Gordon, C., Hempe, K., Reimers, D., Palumbo, G. G. C., & Panagia, N. 1984, A&A, 132, 1
- Fransson et al. (1989) Fransson, C., Cassatella, A., Gilmozzi, R., Kirshner, R. P., Panagia, N., Sonneborn, G., & Wamsteker, W. 1989, ApJ, 336, 429
- Fransson, Lundqvist, & Chevalier (1996) Fransson, C., Lundqvist, P., & Chevalier, R. A. 1996, ApJ, 461, 993
- Fransson, & Sonneborn (1994) Fransson, C., & Sonneborn, G. 1994, in Frontiers of Space and Ground-Based Astronomy, ed. W. Wamsteker, M. S. Longair, & Y. Kondo (Dordrecht: Kluwer), p. 249
- Fransson et al. (2002) Fransson, C., et al. 2002, ApJ, 572, 350
- Freedman et al. (1994) Freedman, W. L., et al. 1994, ApJ, 427, 628
- Gerardy et al. (2000) Gerardy, C. L., Fesen, R. A., Höflich, P., & Wheeler, J. C. 2000, AJ, 119, 2968
- Gerardy et al. (2002) Gerardy, C. L., et al. 2002, ApJ, 575, 1007
- Grevesse & Sauval (1998) Grevesse, N., & Sauval, A. J. 1998, Space Science Reviews, 85, 161
- Heger & Langer (2000) Heger, A., & Langer, N. 2000, ApJ, 544, 1016
- Hillebrandt & Meyer (1989) Hillebrandt, W., & Meyer, F. 1989, A&A, 219, L3
- Houck & Fransson (1996) Houck, J. C., & Fransson, C. 1996, ApJ, 456, 811
- Jeffery et al. (1994) Jeffery, D. J., et al. 1994, ApJ, 421, L27
- Kunasz & Hummer (1974) Kunasz, P. B., & Hummer, D. G. 1974, MNRAS, 166, 57
- Lamb (1978) Lamb, S. A. 1978, ApJ, 220, 186
- Lentz et al. (2001) Lentz, E. J., et al. 2001, ApJ, 547, 406
- Leonard et al. (2000) Leonard, D. C., Filippenko, A. V., Barth, A. J., & Matheson, T. 2000, ApJ, 536, 239
- Lewin et al. (1994) Lewis, J. R., et al. 1994, MNRAS, 266, L27
- Liu et al. (2000) Liu, Q.-Z., Hu, J.-Y., Hang, H.-R., Qiu, Y.-L., Zhu, Z.-X., & Qiao, Q.-Y. 2000, A&AS, 144, 219
- Lucy et al. (1991) Lucy, L. B., Danziger, I. J., Gouiffes, C., & Bouchet, P. 1991, In Supernovae, ed. S. E. Woosley (New York: Springer-Verlag), p. 82
- Lundqvist & Fransson (1996) Lundqvist, P., & Fransson, C. 1996, ApJ, 464, 924
- Marcaide et al. (1997) Marcaide, J. M., et al. 1997, ApJ, 486, L31
- Matheson et al. (2000a) Matheson, T., Filippenko, A. V., Ho, L. C., Barth, A. J., & Leonard, D. C. 2000, AJ, 120, 1499
- Matheson et al. (2000b) Matheson, T., et al. 2000, AJ, 120, 148
- Meynet & Maeder (2000) Meynet, G., & Maeder, A. 2000, A&A, 361, 101
- Nomoto, Iwamoto, & Suzuki (1995) Nomoto, K., Iwamoto, K., & Suzuki, T. 1995, Phys. Rep., 256, 173
- Nomoto et al. (1993) Nomoto, K., Suzuki, T., Shigeyama, T., Kumagai, S., Yamaoka, H., & Saio, H. 1993, Nature, 364, 507
- Oke et al. (1995) Oke, J. B., et al. 1995, PASP, 107, 375
- Panagia et al. (1980) Panagia, N., et al. 1980, MNRAS, 192, 861
- Patat, Chugai, & Mazzali (1995) Patat, F., Chugai, N., & Mazzali, P. A. 1995, A&A, 299, 715
- Podsiadlowski (1992) Podsiadlowski, P. 1992, PASP, 104, 717
- Podsiadlowski, Joss, & Hsu (1992) Podsiadlowski, P., Joss, P. C., & Hsu, J. J. L. 1992, ApJ, 391, 246
- Podsiadlowski, Joss, & Rappaport (1990) Podsiadlowski, P., Joss, P. C., & Rappaport, S. 1990, A&A, 227, L9
- Pooley et al. (2002) Pooley, D., et al. 2002, ApJ, 572, 932
- Pozzo et al. (2004) Pozzo, M., Meikle, W. P. S., Fassia, A., Geballe, T., Lundqvist, P., Chugai, N. N., & Sollerman, J. 2004, MNRAS, in press, astro-ph/0404533
- Pradhan & Peng (1995) Pradhan, A. K., & Peng, J. 1995, in The Analysis of Emission Lines, ed. R. E. Williams & M. Livio (Cambridge: Cambridge Univ. Press), p. 8
- Pun et al. (2002) Pun, C. S. J., et al. 2002, ApJ, 572, 906
- Rottenberg (1952) Rottenberg, J. A. 1952, MNRAS, 112, 125
- Schmidt, Weymann, & Foltz (1989) Schmidt, G., Weymann, R., & Foltz, C. 1989, PASP, 101, 713
- Ray, Singh, & Sutaria (1993) Ray, A., Singh, K. P., & Sutaria, F. K. 1993, Jour. Astrophys. & Astron., 14, 53
- Richmond et al. (1994) Richmond, M. W., Treffers, R. R., Filippenko, A. V., Paik, A. Y., Leibundgut, B., Schulman, E., & Cox, C. V. 1994, AJ, 107, 1022
- Ripero et al. (1993) Ripero, J., et al. 1993, IAU Circ. 5731
- Saio, Nomoto, & Kato (1988) Saio, H., Nomoto, K., & Kato, M. 1988, Nature, 334, 508
- Shigeyama & Nomoto (1990) Shigeyama, T., & Nomoto, K. 1990, ApJ, 360, 242
- Turatto et al. (1993) Turatto, M., Cappellaro, E., Danziger, I. J., Benetti, S., Gouiffes, C., & Della Valle, M. 1993, MNRAS, 262, 128
- Tully (1988) Tully, R. B. 1988, Cambridge and New York, Cambridge University Press, 1988,
- Van Dyk et al. (1994) Van Dyk, S. D., Weiler, K. W., Sramek, R. A., Rupen, M. P., & Panagia, N. 1994, ApJ, 432, L115
- Vladilo et al. (1994) Vladilo, G., Centurion, M., de Boer, K. S., King, D. L., Lipman, K., Stegert, J. S. W., Unger, S. W., & Walton, N. A. 1994, A&A, 291, 425
- Wang, Howell, Höflich, & Wheeler (2001) Wang, L., Howell, D. A., Höflich, P., & Wheeler, J. C. 2001, ApJ, 550, 1030
- Weiler et al. (1986) Weiler, K. W., Sramek, R. A., Panagia, N., van der Hulst, J. M., & Salvati, M. 1986, ApJ, 301, 790
- Wellstein & Langer (1999) Wellstein, S., & Langer, N. 1999, A&A, 350, 148
- Woosley et al. (1994) Woosley, S. E., Eastman, R. G., Weaver, T. A., & Pinto, P. A. 1994, ApJ, 429, 300
- Woosley, Heger, & Weaver (2002) Woosley, S. E., Heger, A., & Weaver, T. A. 2002, Reviews of Modern Physics, 74, 1015
- Zimmermann et al. (1994) Zimmermann, H.-U., et al. 1994, Nature, 367, 621


| UT Date | EpochaaBased on an assumed explosion date of 27.5 March 1993 UT. | GratingbbFOS, 1995–1997; STIS, 1998–2000. | Dispersion | Exposure | Range |
|---|---|---|---|---|---|
| (days) | (Å pixel-1) | (s) | (Å) | ||
| 26 January 1995 | 670 | G270H | 2.05 | 3600 | 2221–3301 |
| G400H | 3.00 | 2600 | 3240–4822 | ||
| 23 February 1996 | 1063 | G160L | 6.64 | 8200 | 1140–2508 |
| G270H | 2.05 | 4800 | 2221–3301 | ||
| 24 January 1997 | 1399 | G160L | 6.64 | 22200 | 1140–2508 |
| G270H | 2.05 | 6400 | 2221–3301 | ||
| 21 February 1998 | 1792 | G230L | 1.58 | 9300 | 1568–3184 |
| 17 April 1998 | 1847 | G140L | 0.60 | 20200 | 1140–1730 |
| 18 April 2000 | 2579 | G140L | 0.60 | 19500 | 1140–1730 |
| 24 April 2000 | 2585 | G230L | 1.58 | 3000 | 1570–3180 |
| UT Date | EpochaaFrom the date of discovery on 2 March 1998 UT (see text). | Grating | Dispersion | Exposure | Range |
|---|---|---|---|---|---|
| (days) | (Å pixel-1) | (s) | (Å) | ||
| 16 March 1998 | 14 | G140L | 0.60 | 2160 | 1140–1730 |
| G230L | 1.58 | 3920 | 1570–3180 | ||
| G430L | 2.73 | 180 | 2900–5700 | ||
| 30 March 1998 | 28 | G140L | 0.60 | 6860 | 1140–1730 |
| G230L | 1.58 | 2400 | 1570–3180 | ||
| G430L | 2.73 | 300 | 2900–5700 | ||
| 13 May 1998 | 72 | G140L | 2.05 | 6860 | 1140–1730 |
| G230L | 2.05 | 5200 | 1570–3180 | ||
| G430L | 3.00 | 300 | 2900–5700 | ||
| 26 Oct 1998 | 238 | G140L | 2.05 | 6730 | 1140–1730 |
| G230L | 2.05 | 5000 | 1570–3180 | ||
| G430L | 3.00 | 700 | 3240–4822 | ||
| 30 Jun 1999 | 485 | G140L | 2.05 | 5500 | 1140–1730 |
| G230L | 2.05 | 11600 | 1570–3180 |
| UT Date | EpochaaFrom the date of discovery on 2 March 1998 UT (see text). | Instrument | Range | Resolution | P.A. | Parall. A. | airmass | Standard star | seeing | slit | Exposure |
|---|---|---|---|---|---|---|---|---|---|---|---|
| (day) | (Å) | (Å) | (deg) | (deg) | (′′) | (′′) | (s) | ||||
| 1998-03-31 | 29 | FLWO | 3720–7521 | 7.0 | 90 | 65 | 1.12 | Feige 34 | 2-3 | 3 | 3 300 |
| 1998-05-16 | 75 | FLWO | 3720–7540 | 7.0 | 90 | 177 | 1.04 | Feige 34 | 1-2 | 3 | 660 |
| 1998-06-18 | 108 | Lick | 3300–5400 | 8 | 66 | 69 | 1.83 | Feige 34 | 1.5 | 2 | 2 300 |
| 1998-06-18 | 108 | Lick | 5100–10400 | 12 | 66 | 69 | 1.83 | HD 84937 | 1.5 | 2 | 2 300 |
| 1998-07-17 | 137 | Lick | 3300– 5400 | 8 | 71 | 71 | 1.74 | BD +284211 | 2.0 | 2 | 900 |
| 1998-07-17 | 137 | Lick | 5200–10400 | 12 | 71 | 71 | 1.74 | BD +262606 | 2.0 | 2 | 900 |
| 1998-07-23 | 143 | Lick | 4300–7050 | 10 | 73 | 72 | 1.68 | BD +262606 | 1.5 | 2 | 900 |
| 1998-07-23 | 143 | Lick | 3280–5420 | 6 | 73 | 72 | 1.78 | BD +284211 | 1.5 | 2 | 720 |
| 1998-07-23 | 143 | Lick | 6050–8050 | 7 | 73 | 72 | 1.78 | BD +262606 | 1.5 | 2 | 720 |
| 1998-11-14 | 257 | FLWO | 3720–7521 | 7.0 | 90 | 81 | 1.19 | Feige 34 | 3 | 3 | 2 1200 |
| 1998-11-15 | 258 | FLWO | 3720–7521 | 7.0 | 90 | 83 | 1.22 | Feige 34 | 2-3 | 3 | 3 1200 |
| 1998-11-25 | 268 | Lick | 5200–10200 | 12 | 88 | 87 | 1.25 | BD +174708 | 2.2 | 2 | 1272+2000 |
| 1999-01-06 | 310 | Keck2 | 4360–6860 | 6 | 175 | 184 | 1.13 | HD19445 | 1.2 | 450 | |
| 1999-01-10 | 314 | Lick | 3350–5500 | 8 | 180 | 38 | 1.02 | BD +284211 | 1.5 | 2 | 2 1800 |
| 1999-01-10 | 314 | Lick | 5200–10500 | 12 | 180 | 38 | 1.02 | BD +74408 | 1.5 | 2 | 2 1800 |
| 1999-03-12 | 375 | Lick | 3276–5400 | 8 | 185 | 115 | 1.06 | Feige 34 | 1.8 | 2 | 1800 |
| 1999-03-12 | 375 | Lick | 5250–10500 | 12 | 185 | 115 | 1.06 | HD 19445 | 1.8 | 2 | 1800 |
| 1999-05-07 | 431 | FLWO | 3720–7521 | 7.0 | 0 | 175 | 1.04 | Feige 66 | 1-2 | 3 | 3 1200 |
| 1999-05-16 | 440 | FLWO | 3720–7540 | 7.0 | 90 | 127 | 1.12 | Feige 34 | 1-2 | 3 | 4 1200 |
| 1999-07-09 | 494 | Lick | 3290–5400 | 8 | 70 | 71 | 1.7 | Feige 34 | 2.3 | 3 | 2 1500 |
| 1999-07-09 | 494 | Lick | 5156–10550 | 12 | 70 | 71 | 1.7 | BD +262606 | 2.3 | 3 | 2 1500 |
| 1999-12-05 | 643 | Keck2 | 4000–10000 | 15 | 50 | 51 | 1.2 | HD 84937 | 1.8 | 1.0 | 900 |
| 1999-12-15 | 653 | Keck2 | 5644–6935 | 2.5 | 65 | 65 | 1.37 | HD 84937 | 1 | 1.0 | 300+600 |
| 2004-01-18 | 2148 | MMT | 3270–8460 | 8.0 | 130 | 122 | 1.07 | Feige 34/HD 84937 | 1.5 | 2 | 2 1800 |
| Line | Relative fluxaaFluxes relative to N III]. |
|---|---|
| He II 1640.4 | 0.50 |
| O III] 1660.8, 1666.1 | |
| N III] 1746.8–1753.4 | 1.00 |
| Ne III] 1814.6 | 1.00 |
| Si III] 1882.7, 1892.0 | 0.12 |
| C III] 1906.7, 1909.6 | 0.63 |
| Line | Rest | Observed | Day 28 | Day 72 | Day 238 | Day 485 |
|---|---|---|---|---|---|---|
| wavelength | wavelength | 30 March | 13 May | 26 October | 30 June | |
| (Å) | (Å) | 1998 | 1998 | 1998 | 1999 | |
| N V | 1238.8, 1242.8 | 1238.5 1240.6 | 3.0: | 1.10 | 1.6 | 1.4 |
| Si IV | 1393.8 | 1394.0 | 19.1 | 0.88 | ||
| Si IV | 1402.8 | 1403.1 | 26.1 | 1.27 | ||
| N IV] | 1483.3–1487.9 | 1486.3 | 5.8 | 2.49 | 1.40: | 2.16 |
| C IV | 1548.9, 1550.8 | 1549.2 | 2.66 | 0.91 | 1.03 | |
| N III] | 1746.8–1753.4 | 1751.1 | 18.2: | 2.47 | ||
| C III] | 1906.7, 1909.6 | 1909.3 | 36.5: | 3.77 | 1.43 | 0.41: |
| C II] | 2322.7–2328.8 | 2325.0 | 1.7 | 1.3 |
| Temperature | Density | N III/C III | N IV/C IV | N III/O III |
|---|---|---|---|---|
| (K) | (cm-3) | |||
| 10,000 | 1.16 | 1.09 | 0.70 | |
| 15,000 | 1.04 | 1.02 | 0.88 | |
| 20,000 | 1.04 | 1.00 | 1.06 | |
| 20,000 | 1.00 | 1.00 | 1.00 | |
| 20,000 | 0.96 | 1.00 | 0.93 | |
| 30,000 | 0.95 | 1.00 | 1.16 |
| Supernova | Type | environment | N/C | N/O | Notes |
|---|---|---|---|---|---|
| SN 1979C | II-L | ejecta | 8 | ||
| SN 1987A | II-P | circumstellar | 7.8 | 1.6 | nebular analysis |
| 5.0 | 1.1 | photoionization model | |||
| SN 1993J | IIb | ejecta | 12.4 | ||
| SN 1995N | IIn | ejecta | 3.8 | 0.2 | uncertain |
| SN 1998S | IIn | circumstellar | 6.0 |