Abstract
Very sensitive HI absorption spectra ( over 1 km/s) toward high latitude QSOs have revealed a population of tiny discrete features in the diffuse ISM with peak of 0.1 – 2% and core line-widths corresponding to temperatures as low as 20 K. Imaging detections confirm linear dimensions of a few 1000 AU. We suggest these structures may be formed by the stellar winds of intermediate mass stars. A more speculative origin might involve molecular “dark matter”.
Tiny HI Clouds in the Local ISM
Tiny Atomic Clouds
1 Introduction
Over the past decades there have been several lines of evidence suggesting a surprising degree of small-scale structure in the atomic interstellar medium. One of the first of these was the observation of spatially variable HI absorption seen toward compact radio sources (eg. Dieter et al. [1976], Davis et al. [1996], Faison et al. [1998], Faison & Goss [2001]). In the most extreme cases, for example toward 3C138, there is good evidence for a variation in the HI opacity, , of as much as = 0.1 on 20 AU transverse scales (Faison et al. [1998]). The “simplest” interpretation of these observations are very large variations in the volume density, n cm-3, assuming that all of the other relevant variables (specifically pathlength, s, and temperature, T) are kept fixed. However, as argued by Deshpande ([2000]), realistic ISM structure functions can lead to large variations of with small angular offsets simply from the statistical fluctuations in the effective pathlength with position. Another line of evidence for small-scale atomic structure came from searches for time variability in the HI absorption seen toward pulsars (eg. Frail et al. [1994], Johnston et al. [2003], Stanimirovic et al. [2003]). However, the early claims for ubiquitous and significant time variations in have not been confirmed in the recent careful studies. A third line of evidence has come from observations of Na I observation toward nearby pairs of stars (Watson & Meyer [1996], Lauroesch et al. [1998]). These observations have revealed strong evidence for discrete absorption features in the local ISM which have highly variable properties on 100’s of AU scales. Since discrete features are being probed by these observations, rather than simply the projection along a long line-of-sight, the structure function arguments of Deshpande do not seem to apply.
2 Observations
We have undertaken a series of extremely sensitive HI absorption observations toward bright background QSOs near the North Galactic Pole (NGP) utilizing the Westerbork Synthesis Radio Telescope (WSRT). The initial motivation for these observations was detection of HI absorption from a Warm Neutral Medium (WNM), even if it’s temperature was as high as 104 K. Such an experiment was prompted by the detection of HI absorption by Kanekar et al. ([2003]) at velocity widths extending at least as high as an equivalent temperature of 3500 K, which corresponded to the sensitivity limit of those data. The NGP region was chosen since it was expected that the lines-of-sight through our Galaxy disk might be as short as possible and therefore relatively simple. Sensitive data were acquired toward 3C286 (14.7 Jy), 3C287 (7 Jy), 4C+32.44 (5 Jy) and B2 1325+32 (1.4 Jy) by observing in an in-band frequency-switching mode utilizing a 1 MHz throw every 5 minutes inside a 2.5 MHz total bandwidth with 0.5 km/s channel width. The in-band frequency switching allowed exceptionally good band-pass calibration while providing 100% of the observing time on-source. For the brightest sources we achieve an RMS over only 1 km/s, making these the most sensitive HI (21cm) absorption measurements of which we are aware.
3 Results
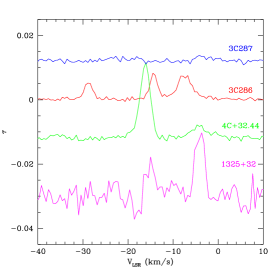
Rather than detecting only the simple, broad and shallow absorption profile of the WNM toward these high latitude lines-of-sight, we were surprised to find instead that multiple narrow absorption features were detected at discrete line-of-sight velocities with peak opacities in the range 0.1 to 2%. The detection of discrete absorption features was particularly surprising since the peak emission brightness seen in these directions (with the 35 arcmin total power beam) was only between about 2 and 5 K. The four observed lines-of-sight are compared in Figure 1. Since many of the absorption lines are detected with high signal-to-noise it is possible to say with confidence that the profiles of individual features are non-Gaussian, and instead appear to be semi-Lorentzian with very narrow line-cores that merge smoothly into broader wings. Of course it is always possible to represent each feature with a sum of coincident Gaussians, but such a procedure appears to be quite arbitrary and it is far from clear what physical interpretation might be attached to such an arbitrary decomposition.
 ,
,
Moderately near-by lines-of-sight show essentially uncorrelated absorption features and only weakly correlated total power emission features. Only in the case of 4C+32.44 and B2 1325+32 which have an angular separation of only 15 arcmin is there some possibility of similar velocity components having been detected.
4 Analysis
Motivated by the non-Gaussian line profiles we have explored some simple spherically symmetric, iso-baric cloud models of the form:
| (1) |
| (2) |
where we further relate volume density to temperature using the thermal pressure which was assumed to be constant at = 1500 cm-3K. The temperature was allowed to vary between T and T, yielding an assumed thermal velocity dispersion of . The predicted HI absorption and total power emission spectra were calculated for a “cloud” placed at the central velocity of each observed feature in an attempt to simultaneously reproduce the observed spectra shown in Fig. 1. The most important free parameters in this process were the cloud scale-length, , the cloud distance, (which most strongly influences the predicted total power emission) and an impact parameter, . This last parameter was used to allow for the likely circumstance that each spherical model cloud may not be penetrated exactly on-axis by the background absorber. The two power-law indices of the scaled distance, and determine the characteristic line-shape in the cold core and warm halo respectively. Although these were in principle also free parameters, it was found that only minor variations from “standard” values of about =1/4 and =1/8 were needed.
 ,
,

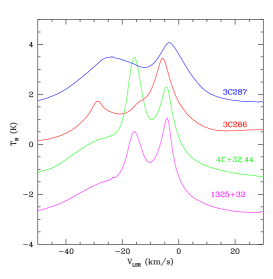
An illustration of the simultaneous emission and absorption line fitting is shown in Fig. 2 for the 3C286 line-of-sight. No fitting has actually been carried out, but merely a -by-eye to illustrate the possibilities of this approach. The entire set of density and temperature profiles for the required clouds along all four lines-of-sight is also shown in the Figure. This illustrates the basic similarities of the modelled features, although the apparent scale-lengths do vary by about an order of magnitude. The apparent distances used in reproducing the spectra was about 10 pc, and the typical half-density radius was 100 AU, although these were not very well-constrained given the very low angular resolution of our total power data (35 arcmin). These modelling results can be easily scaled to other assumed thermal pressures by a linear scaling of together with an inverse linear scaling of both and . For example, with a typical thermal pressure of only 150 cm-3K, comparable fits would be obtained at apparent distances of 100 pc and typical half-density radii of 1000 AU. Variations from the idealized spherical cloud symmetry would have a similar impact on apparent distances and sizes.
 ,
,
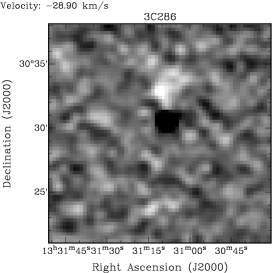
We also have more concrete information regarding the nature of these features, since the same WSRT observations that provided the absorption spectra also allow an imaging search for emission counterparts. Cubes of HI line emission were produced at a range of angular resolutions (15, 30, 60 and 120 arcsec). Obtaining sufficient brightness sensitivity to achieve detections in emission typically required smoothing to 60 arcsec. At those velocities where total power emission exceeding about 1 K is seen in Fig. 1 compact emission clumps of 2–3 K brightness are detected at apparently random locations in the field superposed on the poorly-sampled diffuse background emission. One such emission clump, immediately adjacent to the 3C286 line-of-sight is shown in Fig. 3. The intrinsic angular size of these clumps appears to be about 30 arcsec, while their FWHM line-widths are 1–2 km/s, corresponding to the thermal linewidths of 20–80 K HI. A representative detected column density for the clumps in the 3C286 field is Ncm-2. At an assumed distance of say, 100 pc, the clump size would correspond to 3000 AU and the central volume density would be about 100 cm-3.
 ,
,
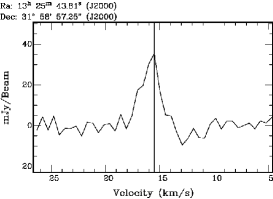
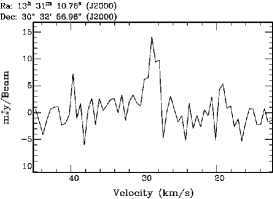
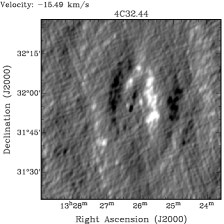
A more interesting emission structure is detected in the 4C+32.44 field. The line-of-sight toward this background source appears to intersect a 15 arcmin diameter shell of HI emission as shown in Fig.4. Although it may be a chance super-position, this apparent shell includes the G0III star HD 116856 at = (13:25:55.835,+31:51:40.629). The measured parallax of this star places it at 10511 pc, where the shell would have a 0.45 pc diameter. The stellar proper motion = (+14.73,43.40) mas/yr is directed predominatly toward the South. Peak column densities in this structure reach Ncm-2 with FWHM line-widths of 2–3 km/s.
5 Discussion
Although more work needs to be done to fully characterize the type and quantity of sub-structure in the “diffuse” ISM, it is already becoming clear that even the most diffuse regions are populated by tiny distinct structures of very high density- and temperature-contrast. For example, the low scale-size end of the turbulent power spectrum is predicted (Deshpande [2000]) to have HI opacity fluctuations of only 10-5 on spatial scales of 1000 AU. In fact, we measure more than two orders of magnitude larger opacity fluctuations of on these scales. There appears to be substantial injection of fluctuation power on very small scales. The physical origin of these tiny structures is not yet clear, but it seems conceivable that the stellar winds of intermediate mass stars may play an important role in their formation, whenever such stars find themselves within a diffuse atomic structure. A more speculative origin might be some relation to molecular “dark matter” (eg. Pfenniger & Combes [1994]). New observations should test various scenarios.
References
- [1996] Davis, R. J., Diamond, P. J., Goss, W. M., 1996, MNRAS, 283, 1105
- [2000] Deshpande, A. A., 2000, MNRAS, 543, 227
- [1976] Dieter, N. H., Welch, W. J., Romney, J. D., 1976, ApJ, 206, L113
- [1998] Faison, M., Goss, W. M., Diamond, P. J., Taylor, G. B., 1998, AJ, 116, 2916
- [2001] Faison, M., Goss, W. M., 2001, AJ, 121, 2706
- [1994] Frail, D. A., Weisberg, J. M., Cordes, J. M., Mathers, C., 1994, ApJ, 436, 144
- [2003] Johnston, S., Koribalski, B., Wison, W., Walker, M., 2003, MNRAS, 341, 941
- [2003] Kanekar, N., Subrahmanyan, R., Chengalur, C., Safouris, V. 2003, MNRAS, 346, L57
- [1998] Lauroesch, J. T., Meyer, D. M., Watson, J. K., Blades, J. C. 1998, ApJ, 507, L89
- [1994] Pfenniger, D., Combes, F., 1994, A&A, 285, 94
- [2003] Stanimirovic, S., Weisberg, J. M., Hedden, A. et al. 2003, ApJ, 598, 23
- [1996] Watson, J. K., Meyer, D. M., 1996, ApJ, 473, L127