Is M82 X-1 Really An Intermediate-Mass Black Hole? X-ray Spectral and Timing Evidence
Abstract
Ultra-luminous X-ray sources (ULXs) with apparent luminosities up to 100’s of times the Eddington luminosity for a neutron star have been discovered in external galaxies. The existence of intermediate mass black holes has been proposed to explain these sources. We present evidence for an intermediate-mass black hole in the ULX M82 X-1 based on the spectral features and timing (QPO) properties of the X-radiation from this source. We revisited XMM Newton and RXTE data for M82 X-1 obtained in 2001 and 1997 for XMM and RXTE respectively. We show for these observations that the source is either in transition or in a high/soft state with photon spectral indices 2.1 and 2.7 respectively. We confirm the early determination of the QPO frequency mHz in this source by Strohmayer & Mushotzky and identify this as the low frequency QPO for the source. We apply a new method to determine the BH mass of M82 X-1. The method uses the index-QPO low frequency correlation that has been recently been established in galactic black hole candidates GRS 1915+105, XTE J1550-564, 4U 1630-47 and others. Using scaling arguments and the correlation derived from consideration of galactic BHs, we conclude that M82 X-1 is an intermediate BH with a mass of the order of 1000 solar masses.
1 Introduction
A number of external galaxies, notably ones with active star formation regions, have revealed the presence of so called ultra-luminous X-ray sources (ULXs) which one can operationally define as an X-ray source, which is not coincident with the nucleus of its host galaxy and which has an apparent luminosity in excess of an order of magnitude above the Eddington luminosity for a neutron star ( erg s-1). The high luminosity of ULXs have led to speculation that these objects may be intermediate ( BHs [e.g. Colbert & Mushotzky 1999; Strohmayer & Mushotzky 2003, hereafter SM03; Shrader & Titarchuk 2003, hereafter ST03; Miller et al. 2003] or, more conservatively, beamed sources of lower mass (King et al. 2001). However, due to their distances the prospects for dynamical measurement of the mass of ULXs are poor and other means must be sought to identify their masses.
ST03 present the analysis of observational data for representative objects of several classes: GBHs, narrow-line Seyfert galaxies (NLS1s) and ULXs. They apply a methodology, which uses the spectral characteristics of the X-ray source radiation, to determine the mass. Using a color temperature from the bulk motion Comptonization (BMC) model ST03 calculate the mass of several GBHs. Their results are in agreement with the masses obtained by optical or other methods when available. ST03 also calculate masses in ULXs for seven sources. The most compelling cases for the presence of intermediate-mass objects are NGC 1313 and NGC 5408 objects for which respectively.
There is suggestions in the literature (see King et al. 2001) that the radiation from some of ULXs sources is beamed and thus the real luminosity is much smaller than the Eddington luminosity for a solar mass BH (or neutron star). In fact, King et al. do not exclude the possibility that individual ULX’s may contain extremely massive BH. But they emphasize that the formation of large number of ultramassive BHs is problematic in terms of evolutionary scenario of binary systems. The recent discovery of the fast variability [quasiperiodic oscillation (QPO)] of the X-ray radiation in ULX M82 by SM03, suggests that the X-ray emission area is quite compact in this particular source. In fact, for a jet of a typical size about cm one cannot expect the QPO frequency mHz that is observed by SM03 in M82 X-1. Thus, if the radiation from these variable sources is isotropic, then the high inferred luminosity of M82-X1 requires an intermediate-mass BH, i.e. a BH more massive than one that can be formed in the collapse of a single normal star.
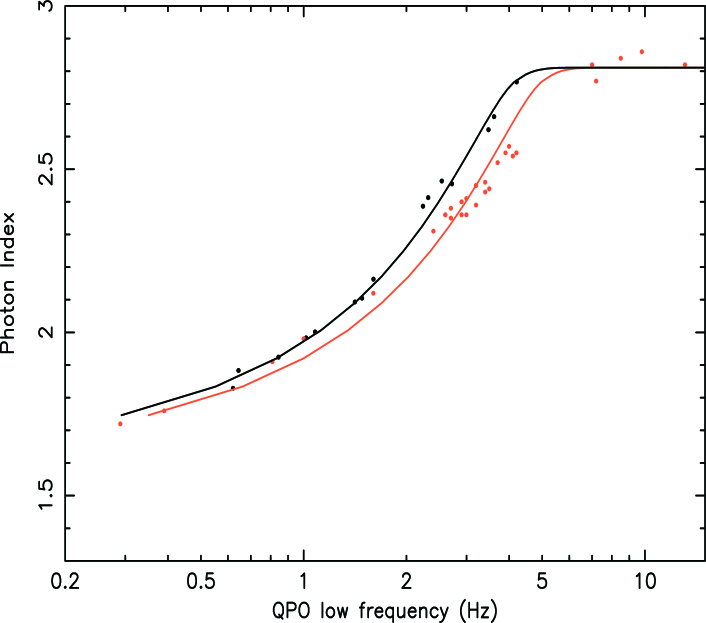
If ULXs are indeed accreting BHs with properties presumably similar to GBHs, similar observable properties, in particular, correlations of the X-ray spectral indices and QPO frequencies in ULXs should be seen [see Vignarca, et.al. (2003); Titarchuk and Fiorito (2004), hereafter TF04; Titarchuk, Lapidus & Muslimov (1998)]. TF04 show how the mass of one GBH source can be used to determine that of another, e.g. GRS 1915+105 and XTE J1550-564 which exhibit remarkably similar QPO frequency-index correlation curves (shown here as Fig. 1). Once the mass of one object (e.g. GRS 1915+105) is determined by a fit of theory to the measured QPO frequency-index correlation curve, the mass of the other (XTE J1550-564) can be found by simply scaling, i.e. sliding the correlation curve for GRS 1915+105 along the frequency axis until it coincides with the correlation curved of XTE J1550-564, in this case by the factor 12/10. Thus the inferred mass of XTE J1550-564 is 10/12 times less than that of GRS 1915+105. The mass determination using the QPO frequency-index correlation fit is consistent with X-ray spectroscopic and dynamical mass determinations for these sources (see references in ST03). Since QPO frequencies are inversely proportional to the mass of the central object one can, in principle, determine the mass of a ULX using the same kind of scaling as described above for GBHs. It is important to note that the BH mass determination method using the QPO-index correlation is independent of the orientation of source. In fact, the photon index of the Comptonization spectrum is a function of the Comptonization parameter only which is a product of the mean energy change at any photon scattering and the mean number of scatterings in the Compton cloud (corona) (see e.g. Sunyaev & Titarchuk 1980).
In §2 we present the results of our spectral and timing analysis of archival XMM and RXTE data from the ULX source M82 X-1. In §3 we discuss our results of the data, compare it to that presented by SM03 and employ our results to estimate the mass of M82 X-1. Conclusions also follow in §3.
2 DATA ANALYSIS and RESULTS
We have revisited archival spectral and timing XMM and RXTE data from the ULX source M82 X-1, which has been previously investigated by SM03 and Rephaeli and Gruber (2002) hereafter RG02. We analysed four archival observations: (1) the XMM EPIC PN and MOS data from the 30 ks observation May 5, 2001 (OBSIDS 0112290201) and (2) RXTE PCA data from 1997 archival observations of RG03 {OBSIDS: 20303-02-02(2.5 ks), 20303-02-03(4.76ks) and 20303-02-04(2.5 ks)}. The latter two observations show the presence of QPOs and a power law (PL) component in their energy spectra, which we have reanalyzed in terms of the transition layer model previously applied by us to the study of galactic black hole sources (TF04). We were not able to identify the QPO reported by SM03 for OBSID 20303-02-02(2.5 ks).
2.1 Energy spectra
XMM data.– We extracted the spectrum of M82 X-1 from both the EPIC MOS and PN images of M82 in a circle of 18′′ in radius around the bright source (M82 X-1), using the latest version of the SAS data reduction software and response matrices. We focused our attention on the energy range 3.3 keV - 10 keV where interference from the soft diffuse component surrounding the bright source is minimized. We find that this energy range gives more consistent results for the spectral modeling and timing analysis than that used by SM03 (2-10 keV), i.e. increasing the lower energy value from 2 to 3.3 keV produced the lowest value of resuduals in our energy spectral fits (), and had virtually no effect on the and parameter values of our fits to the power spectrum when compared those using the energy range 2-10 keV. Using XSPEC (version 11.3), we find that an absorbed power law model with a Gaussian iron line component and the Bulk Comptonization model (BMC) (Titarchuk et al. 1997) with a Gaussian iron line component fixed at 6.5 keV and a line width of 0.4 keV, give equally good fits (), when the column density is left as a free parameter. Since the real column density is unknown, because of the obscuration effect of the surrounding diffuse emission surrounding M82 X-1, we allow this parameter to be free. The , and fitted parameters showed little change with temperature up until keV. In order to obtain the index, normalization and column density, we therefore fixed the value of kT below this value, i.e. keV. We found that for the best fit spectrum the contribution of the Comptonized component in the BMC spectrum is dominant. The BMC model spectrum is a sum of the (disk) black-body component and Comptonized black-body component, where is a relative weight of the Comptonized component. Because all values of parameter are consistent with observations we fixed to 5. With these constraints we find that the power law index and column densities from the PL and BMC fits give close to the same results for all the observations investigated by us. We also also noticed that an absorbed multi-temperature thermal disk model (diskBB) with a Gaussian, provides a statistically good fit but that a high disk temperature keV) is required in agreement with the results of SM03. An example of a fit to our reduced PN data using the BMC-Gaussian Fe Line model is given in Figure 2. A comparison of fits to our reduced data for the PL and BMC with that produced by SM03 for the energy band (3.3-10 keV) produces nearly identical results. Fits to the MOS data [similar data is mentioned but not presented in (SM03)] gives close to the same fitted parameters as the PN data fits.
RXTE data.–Spectra from M82 was also obtained from the archival observations of RG02 (using PCA Standard Products and the Epoch 3 response matrix). A comparison of the free spectral fit parameters for the XMM EPIC PN, MOS and RXTE PCA data is given in Table 1. Based on the photon indices obtained from the XMM PN observation we conclude that the source was in a transition from hard to soft state , i.e. characterized by an index between 1.5 and 2.5, for the time period of the XMM observation and that for the period of the RXTE data reported here the source was in a soft state (i.e spectral index ).
2.2 Timing Analysis
XMM data.–We extracted a light curve from the EPIC PN instrument selected, from the same area A described in §2.1 in the energy band 3.3-10 keV with a 1 sec time bin and one 30 ks window which includes all the PN data. From this light curve we computed the power spectra using the current release of the XRONOS program. The power spectrum was rebinned a factor of 256 to obtain the results shown in Figure 3 (left panel) which exhibits a clear QPO. The high error in the red noise portion of the power spectra below 30mHz does not allow a determination of the expected break frequency below the QPO frequency. Thus we can not reliably identify the break frequency which is usually found with the QPO low frequency in GBHs source from the XMM data (see Wijnands & van der Klis 1999). The data suggests but does not confirm the presence of a peak at approximately 100mHz, but the statistics are too poor to positively identify this frequency. (see also the XMM data of SM03). Because of the severity of the red noise below 30 mHz we have, following SM03 chosen to fit the power spectrum with a model consisting of a constant to account for the Poisson noise, a simple power law to account for the red noise and a Lorentzian to account for the presence of the QPO. Our fit to the data using this model gives a good fit for 58 dof, mHz, mHz and which are in good agreement with the more accurate results obtained by SM03 using all three EPIC instruments. Here represents the total rms power in the QPO, and is the FWHM of the QPO. We checked the significance of the QPO by observing that when the QPO was excluded from the model. For this value of using the F test one finds that a probability for a random occurance of the QPO feature. These results give us great confidence that the QPO is observed by the PN instrument (cf. SMO3).
RXTE data.–We extracted a light curve using good time intervals and 3-10 keV energy selected power density spectra from the three RXTE OBSIDs listed above, employing a 128 Hz sampling rate and only the top xenon layers of the operating PCU’s for each observation time interval. The IDL program RADPS, written by C. Markwardt was used to produce the power density spectrum (PDS) averaged over several 1024 second intervals for each light curve. We clearly identified single QPO’s in the PDS for two of the three OBSIDs studied by SM03. We fit our PDS data to a sum of two Lorentzian peaks, the lowest or zero order Lorentzian was picked to identify the red noise break frequency of the PDS. A clearly identifiable break frequency at mHz with confirmed by a plot of frequency time power vs frequency, coincident with a QPO at mHz and was observed for OBSID 20303-02-04. A QPO at mHz and was also observed for OBSID 20303-02-03, but a clearly definable break frequency was not observed for this OBSID. Lorentzian line fits to the PDS for the former case is presented in Figure 3 (right panel). We also looked for variation of the total variability as a function of energy by observing the variability in two energy bands: 3-6 keV and 6-10 keV, but no variation was observed.
3 Discussion and Conclusions
The spectral data for M82 X-1 definitely show the spectral features of high/soft spectral phase when the photon indices are in the range of . For XMM PN OBSID and RXTE 20303-02-04 OBSID we find and respectively; the former value is characteristic of transition to the high/soft state, and the later to the high/soft state. In these observations two QPO frequencies mHz and mHz have been identified. We interpret and identify the observed mHz as the fundamental low frequency and mHz as its first harmonic. We note that the presence of one predominant QPO, i.e. 50 or 100 mHz in different observations is not an unusual occurrence (see e.g. TF04) and can be explained as the result of the local driving frequency conditions in the coronal region; i.e. a resonance condition is established for one particular eigenmode of the compact coronal region so that this mode is predominantly observed. In other cases, for example in GRS 1915+105 (Fiorito et al. 2003) the fundamental and first harmonics of the low frequency QPO (along with break frequencies) are simultaneously observed. Such features are seen in a variety of other GBH sources as well. Also the proximity of the inferred fundamental mHz to the observed break frequency, mHz is similar to what is observed in GBH’s.
If we identify mHz as the low frequency QPO frequency keeping in mind that and Hz for 10 solar masses (see Fig. 1, for the index-QPO frequency correlation in XTE 1550-564) and the fact that is inversely proportional to , we calculate solar masses. As we show above (see also TF04) this scaling have been observed for galactic black holes but this is the first time it has been applied to a ULX source (M82 X-1) to estimate the BH mass. This value of BH mass is consistent with mass evaluations obtained using the absolute normalization and color temperature of other ULXs (NGC 253, NGC 1399 X-2, X-4 and IC 342 X-1) which have been analyzed by ST03. We note the possibility that the 50 mHz QPO may not be the lowest intrinsic QPO frequency and that a lower one, which may be obscured by the red noise at frequencies mHz may exist. Therefore the frequency should be interpreted as an upper limit and therefore the inferred mass as a lower limit.
To conclude, we have presented a reanalysis and new interpretation of XMM Newton and RXTE data obtained from M82 X-1. This analysis presents via the BMC model spectral photon indices 2.1-2.7 which are seen in the high/soft states of extragalactic and galactic black holes and identification of mHz as an observable upper limit on the low frequency QPO for M82-X1. Using this value for the low QPO frequency, the predominantly observed spectral index and the index-QPO frequency correlation recently obtained for GBHs establishes a lower limit the mass of M82 X-1 of the order 1000 solar masses. The demonstrated application of our method which uses the low QPO frequency and the index of the power-law component of the spectra presents a new, potentially powerful tool for determing the nature and mass of ULXs. However, the confirmation of a ULX as an intermediate BH awaits either the simultaneous application of the two independent methods we have described above, i.e. the ST03 method and QPO low frequency-index correlation or direct dynamical evidence.
R.F. gratefully acknowledges helpful discussions with T. Strohmayer, C. Markwardt and L. Angelini. L.T. acknowledges the support of this work by the Center for Earth Observing and Space Research of George Mason University.
References
- Colbert, & Mushotzky, (1999) Colbert, E. J. M., & Mushotzky, R. F. 1999, ApJ, 519, 89
- Fiorito et al. (2003) Fiorito, R., Markwardt, C., & Swank, J. 2003, HEAD meeting of AAS
- King et al. (2001) King, A.R., et al. 2001, ApJ, 552, L109
- Miller et al. (2003) Miller, J. et al., 2003, ApJ, 585, L37
- Rephaeli & Gruber (2002) Rephaeli, Y. & Gruber, D. 2002, A&, 389, 752
- (6) Remillard, R. et al. 2002a, ApJ, 580, 1030
- (7) Remillard, R. et al. 2002b, ApJ, 564, 962
- Shrader & Titarchuk (2003) Shrader, C., & Titarchuk, L.G. 2003, ApJ, 598, 168 (ST03)
- (9) Sobczak, G.J., et al. 1999, ApJ, 517, L121
- (10) Sobczak, G.J., et al. 2000, ApJ, 531, 537
- Strohmayer et al. (2001) Strohmayer, T. E., & Mushotzky, R.F. 2003, ApJ, 586, L61 (SM03)
- Sunyaev & Titarchuk (1980) Sunyaev, R.A. & Titarchuk, L.G. 1980, A&A, 86, 121
- Titarchuk, Mastichiadis & Kylafis, (1997) Titarchuk, L. G., Mastichiadis, A., & Kylafis, N. D. 1997, ApJ, 487, 834
- Titarchuk, & Fiorito (2004) Titarchuk, L.G. & Fiorito, R. 2004, ApJ, 612, (astro-ph/0405360) (TF04)
- Titarchuk, Lapidus & Muslimov (1998) Titarchuk, L., Lapidus, I.I., & Muslimov, A. 1998, ApJ, 499, 315 (TLM98)
- Vignarca et al. (2003) Vignarca, F., et al. 2003 A&A, 397, 729 (V03)
- Wijnands & van der Klis (1999) Wijnands, A.D. & van der Klis, M. 1999, ApJ, 514, 939
| OBSID | Instrument | |||||
|---|---|---|---|---|---|---|
| 011201 | XMM-PN | |||||
| 011201 | XMM-MOS | |||||
| 20303-02-02 | XTE-PCA | |||||
| 20303-02-03 | XTE-PCA | |||||
| 20303-02-04 | XTE-PCA |