Mini High Velocity Clouds
Abstract
Neutral hydrogen mapping of several small, very low column density High Velocity Clouds (HVC), using the Arecibo telescope, is reported. Some were found serendipitously superimposed at distinct velocities on larger HVCs; others were found to comprise the four most isolated low column density sources in the observations of Lockman et al. but proved to be individually much smaller than the Green Bank 140 Foot telescope beam. We call these clouds “mini-HVC” to distinguish them from the larger and denser Compact High Velocity Clouds (CHVC). Peak column densities are typically a few averaged over the Arecibo beam, and diameters to our detection limit range from to . These column densities and angular diameters overlap with those for CHVC, but are typically smaller. We consider three possiblities: (1) that most mini-HVC are related to the Magellanic Stream, (2) that most mini-HVC are part of M31’s retinue of CHVC, or (3) that the mini-HVC are simply the low column density tail of the distribution of CHVC. None of these possibilities can be rejected as yet, given the selection biases in our sample. We also discuss controversies about the amount of ionized hydrogen in CHVC and mini-HVC, which may be mainly ionized, and the implications of these small clouds for Lyman Limit Systems.
1 Introduction
The major High Velocity Cloud (HVC) complexes have appreciable angular sizes and are thought to lie mainly closer than the Large Magellanic Cloud (or, in the case of the Magellanic Stream, up to that distance), closer than most dwarf irregular galaxies (dIrr) in the Local Group. Compact High Velocity Clouds (CHVC) were first identified by Braun & Burton (1999) as HVC that are small () in angular extent and significantly removed from any of the major HVC complexes. Subsequent work by many researchers has shown that CHVC have lower metallicity than the major complexes (Sembach et al., 2002), kinematics that appear to center on the barycenter of the Local Group rather than the Milky Way (de Heij, Braun & Burton, 2002b), and internal structure consistent with their being supported by a combination of dark matter gravity and external pressure (Burton, Braun & Chengalur, 2001; de Heij, Braun & Burton, 2002a; Sternberg, McKee & Wolfire, 2002). Several lines of evidence point to distances of order 50-200 kpc for CHVC (Burton, Braun & de Heij, 2002; Maloney & Putman, 2003; Putman et al., 2003a), typical of many of the Local Group dIrr. Individual CHVC have central gas density apparently below the threshold for star formation, and careful searches for stars in several CHVC have found none (Simon & Blitz, 2002; Davies et al., 2002; Hopp, Schulte-Ladbeck & Kerp, 2003). CHVC may be good candidates for infall of (almost) primordial material into disk galaxies (Blitz et al., 1999; Braun & Burton, 1999), which would replenish hydrogen and provide some dynamical stirring to encourage star formation. This could be of interest for large and small disk galaxies, but more so for small dwarf irregular galaxies (dIrr) because of their larger ratio of surface area to volume. Two possible examples of such CHVC/dIrr mergers have been reported (Robishaw, Simon & Blitz, 2002; Hoffman et al., 2003).
We have previously reported Arecibo111The Arecibo Observatory is part of the National Astronomy and Ionosphere Center, which is operated by Cornell University under a management agreement with the National Science Foundation. mapping of one CHVC and one small HVC that did not quite meet the size and isolation requirements to be labelled a CHVC (Hoffman, Salpeter & Pocceschi, 2002). Burton, Braun & Chengalur (2001) show Arecibo mapping of several more CHVC to similar sensitivity. While the main purpose of those maps was to study the H I/H II ionization balance, a major surprise was our discovery of a small cloud of H I superimposed on WvW 491, differing in velocity by 66 km which is more than twice the FWHM of the H I profile of either WvW 491 or the cloudlet. We have dubbed such cloudlets “mini-HVCs.” Preliminary mapping of WvW 479 revealed two more such mini-HVC and led us to speculate that many of the low column density H I sources — at least those well removed from major HVC complexes — found by Lockman et al. (2002) (hereafter refered to as LMPU) using the 140 Foot telescope at Green Bank might be similar cloudlets, considerably smaller than the 21′ beam of that instrument. We undertook to map the four most isolated LMPU sources, those that appeared in their central beam but not in the preceding nor trailing reference beams. In this paper we report our mapping of these four LMPU fields along with the mapping of WvW 479 and WvW 413 (the latter apparently devoid of mini-HVCs).
Our Arecibo observing procedures are detailed in Sect. 2, with results presented in Sect. 3. In Sect. 4, we discuss the relationship among mini-HVC, CHVC and the major complexes (the Magellanic Stream in particular), consider photoionization mechanisms, explore the column density-diameter relationship for mini-HVC and CHVC, and ponder the possible connection between these systems and Lyman Limit Systems. Conclusions and a summary follow in Sect. 5.
2 Arecibo Observations
Preliminary mapping of WvW 413 and WvW 479 in driftscan mode was conducted in 2001 June-July. Using 16 driftscans separated in declination by and each 480 s long, we mapped an area about by . In the allocated time we were able to complete 6-10 repetitions of each declination strip which we averaged to achieve rms noise about 5 mJy in velocity channels 0.65 km wide. For features having FWHM about 20 km , this gave a minimum detectable flux integral of order 0.2 Jy km , sufficient to detect the core of each CHVC and any mini-HVC with central column density above a few .
Follow-up mapping of WvW 413 and WvW 479 was conducted in 2002 June-August, along with mapping of the four LMPU sources. To achieve greater sensitivity, we used position-switched mapping with longer integration times – 5-40 minutes on-source (with equal time on each reference beam) per point on sparsely sampled maps. We used 6.25 MHz bandwidth (0.65 km channels) and 9-level sampling. This produced rms noise 0.8-2 mJy, depending on integration time and zenith angle, and secure detections for narrow line features as low as . A noise diode was fired after each on-off pair. Calibration was provided by the NAIC staff.
WvW 413, for which preliminary mapping did not reveal any superimposed mini-HVCs, was mapped along two orthogonal diameters aligned with the cardinal Galactic directions. Points were spaced by one beamwidth, as shown in Fig. 1. Integration times varied from 5 minutes on-source at the core of the HVC to 20 minutes on-source at the outermost points.
Preliminary mapping for WvW 479 exposed two superimposed mini-HVCs. In follow-up work, we obtained longer integrations on the positions found in the preliminary map to have the highest column density for each, along the line joining those two centers both toward and away from the other mini-HVC center, with beams spaced by a beamwidth, and at four additional points around each center to complete a hexagon at beamwidth spacing from the center point, as shown in Fig. 5.
Each LMPU source was first mapped in an hexagonal pattern covering the 140 Foot beam with points spaced two Arecibo beamwidths apart. Integration times were limited to 5 minutes on-source for the first pass. Marginal detections were followed-up with longer integration times, up to 20 minutes on-source, giving a typical 3-sigma detection limit of about assuming a profile width of km . Once a clear detection was achieved, we mapped interstitial points to determine the highest column density reached in the core of the mini-HVC and continued to surrounding points to assess the full extent of the cloud. In the event that emission was detected in a reference beam, we confirmed that detection with a fresh on-off pair (the on beam in this case being centered on the putative detection) and then mapped around that position in a hexagonal pattern with beamwidth spacing just as if it had been detected within the LMPU field. The full complement of observed points is recorded in Fig. 7.
3 Results
Results from the Arecibo mapping are summarized in Table 1 and Figs. 1-8. The columns of Table 1 give, respectively, each object’s name, R.A. and Dec. (J2000), the peak observed flux, approximate major and minor diameters to the outermost detected point with an uncertainty of order half the beamwidth (i.e., ; indicates that our observations do not reach the detection limit on at least one side), an approximate position angle for the major axis, the peak column density, the systemic velocity (midpoint between velocities at which the spectrum from that central position falls to half its peak value), and the velocity width between those 50% points (i.e., the FWHM). In the subsections that follow, we elaborate on individual sources.
3.1 WvW 413
The drift scan mapping of the HVC WvW 413 disclosed a well-defined, approximately elliptical core centered near (B1950) which translate to the J2000 coordinates listed in Table 1. The outskirts appeared irregular, but the sensitivity was not high enough to determine whether the irregularity was intrinsic or due to noise. For follow-up studies, we chose to map along axes aligned with Galactic N-S and Galactic E-W to investigate whether the scalelengths of the H I emission were approximately equal in all directions as expected if the truncation is mainly due to photoionization by extragalactic UV sources, or more abrupt toward Galactic North as would be the case if the HVC (which resides in the southern Galactic hemisphere) is within a few kpc of the Milky Way’s disk and truncation is due to photoionization by Galactic sources or to collisions with hot halo gas.
The results of the follow-up mapping are shown in Figs. 1-4. Fig. 1 presents a map of the observed points, with numbers indicating observed H I column density in units of and exes indicating observed positions with no detected emission. Spectra obtained from the center beam and from beams near the outer ends of each diameter are shown in Fig. 2. Column density as a function of radius for each of the four cardinal Galactic directions is shown in Fig. 3, and the “rotation curve” of the HVC, a plot of systemic velocity vs. radius along both diameters, is shown in Fig. 4. The variation in velocity along the E-W axis is probably due to noise, but there does appear to be a systematic trend to the systemic velocity along the N-S axis, perhaps indicating rotation. The amplitude is less than the width of a typical profile, however.
The column density runs for Galactic north and west in Fig. 3 have distinctly steeper slopes than those for South and East. Since the HVC has Galactic coordinates , , Galactic North is toward the plane of the Milky Way and Galactic West is toward its center. This could be an indication that Galactic sources contribute a significant fraction of the ionizing UV, or that the HVC is moving in that direction relative to a hot external medium. The former would require that the HVC lie within a few kpc of the disk so that the UV flux from Galactic sources is not too weak. The latter requires either that the HVC lie within the Galaxy’s corona (and have space velocity toward Galactic NW) or that the hot gas extends far outside the Milky Way.
3.2 WvW 479 and Superimposed Mini-HVCs
The drift scan mapping of the HVC WvW 479 disclosed a well-defined, approximately elliptical core centered near (B1950) which translate to the J2000 coordinates listed in Table 1. Two mini-HVCs, one south and the other SE of the HVC’s core, were also apparent in the driftscan map. We have labeled these WvW 479 min1 and min2, respectively, even though they may be chance superpositions. The two mini-HVCs had nearly identical velocities, and respectively, so for follow-up studies we chose to map a one-beamwidth spaced hexagon around each core to verify that we had identified the maximum column density position in each, and along the line joining the two to determine whether or not they were connected at column densities below the sensitivity of the driftscan map.
The results of the follow-up mapping are shown in Figs. 5-6. Fig. 5 presents a map of the observed points with numbers indicating observed H I column density in units of and exes indicating non-detections. Spectra obtained from the centers of the two mini-HVCs are shown in Fig. 6. While the allocated time was not sufficient for us to map the entire distance between the two mini-HVCs, min1 was no longer detected in a 30 minute (on-source) scan at a point east of center. Along the westward track from min2, the column density fell smoothly to at the point from the core, but the next point outward unexpectedly rebounded to . We ran out of telescope time at that point and so do not know how much further the mini-HVC extends. It was not detectable in the draftscan mapping beyond that point, so we know the column density does not rise back above before min1 is reached.
3.3 LMPU Sources
3.3.1 LMPU025
Four mini-HVCs were found in and around the 140 Foot beam area for LMPU025, and two more were found in the reference beams to the east. The Arecibo beam positions for those in the 140 Foot beam area are shown in Figs. 7a-c, and those in the area of the reference beams are shown in Fig. 7d. Mini-HVC LMPU025-163, at velocity km , was found to span the southern third of the 140 Foot beam area and to extend a few arcmin beyond to the NE and SW as shown in Fig. 7a. The highest column density point (Fig. 8a) falls in the SE portion of the 140 Foot beam area, but the core of the mini-HVC is not well-defined. The signal-to-noise ratio in individual spectra is too low for us to determine if there are any systematic trends in systemic velocity from one end of the cloud to the other.
It may be possible that LMPU025-291 and LMPU025-335 are part of a single system, but the 44 km difference in systemic velocity and abrupt drop in systemic velocity from km for the points near (,) in the map to km for the points at R.A. offset makes that unlikely. Within each of the two there is no systematic trend in velocities. Spectra of the highest column density points of both mini-HVC are shown in the Fig. 8a.
Traces of emission at km were evident in a couple of the westernmost points in the 140 Foot beam area of LMPU025, so we traced the emission further west to disclose an unusually high column density mini-HVC lying just outside the 140 Foot area as shown in Fig. 7c. The spectrum obtained from the highest column density point is shown in Fig. 8a. There is no systematic trend to the velocities for most of this mini-HVC, but the two easternmost points have velocities km higher.
The allocated time did not permit a complete mapping of the two mini-HVCs found in the reference beam area, but we were able to locate the position of highest column density for each. The diameters listed in Table 1 are therefore more approximate — lower bounds, perhaps — than those for the mini-HVCs we mapped more completely. The spectra obtained from the highest column density points of each are shown in Fig. 8b. The close proximity in velocity of these two mini-HVC to two of those found in the main 140 Foot beam area suggests that perhaps they are connected by bridges of more completely ionized gas.
3.3.2 LMPU236
The single mini-HVC found in the 140 Foot beam area LMPU236 is the only mini-HVC detected in the northern Galactic hemisphere to date. It also is the only known positive velocity mini-HVC and has the lowest peak column density of all the mini-HVCs found so far. The map of observed points is shown in Fig. 7e; detectable emission spans only one-third of the 140 Foot beam area. The spectrum from the highest column density point is shown in Fig. 8c.
3.3.3 LMPU369
A single mini-HVC was found in the 140 Foot beam area of LMPU369, with its peak column density just outside the area as shown in Fig. 7f. The spectrum from the peak column density point is shown in Fig. 8d. However, another mini-HVC was found in the reference beam, in R.A. ( of arc) east of the northermost point in the LMPU369 area. The peak column density point was found to be one Arecibo beamwidth further north. Points with detectable emission are shown in Fig. 7g, and the spectrum from the highest column density point is shown in Fig. 8d.
3.3.4 LMPU387
Three mini-HVCs in addition to the northern end of the Magellanic Stream were found in the 140 Foot beam area of LMPU 387. LMPU387-230 and LMPU-297 are almost superimposed on one another in the SE edge of the area, as shown in Fig. 7h and 7i, but spectra (Fig. 8e) from those points show the two at clearly distinct velocities. LMPU387-275 lies to the NE of the 140 Foot beam area. All three have fairly well-defined edges, fill only one-third to one-half the 140 Foot beam area, and overlap its edge.
3.4 Statistics of Individual and Peak Column Densities
Not counting the CHVCs WvW 413 and WvW 479 themselves, we have detected flux in 229 individual locations spanning 14 distinct mini-HVCs. The 14 peak column densities are given in Table 1 and Fig. 9, and the distribution function for the 229 individual column densities is shown in Fig. 10. For the distribution function is roughly proportional to , somewhat similar to the distribution function of column densities for Lyman Limit Systems (see also Sect. 4.4). Detections in the lowest bin are highly incomplete, but few detections should be missing in the third bin ( to ). Thus the distribution function changes slope below , partly because the ratio of ionized to neutral hydrogen increases there (see also Sect. 4.3). For peak column densities of the mini-HVCs, there are only 3 with in to compared with 7 in to (see also Fig. 11).
Our observations of mini-HVCs were appreciably undersampled by the Arecibo beam, so the true peak could be larger than the observed peaks in Table 1 and Fig. 9. However, the typical true/observed ratios depend on how large flux fluctuations are in the vicinities of the peak locations. As can be seen in Figs. 5 and 7, these fluctuations are surprisingly small. For instance, there are practically no non-detections near the observed peaks. We have also looked at how many individual fluxes in each mini-HVC are above of the observed peak flux. The average number is 4.2. It is therefore unlikely that the true/observed flux ratio is above in very many cases. The near-constancy of the flux in the central regions is somewhat surprising, given the irregular shapes of the outermost regions and the rapid fall-off there.
4 Discussion
4.1 Distribution of Mini-HVCs on the Sky
Of the 15 mini-HVCs we have found to date, only one (LMPU236+242) is in the northern Galactic hemisphere. The three LMPU387 mini-HVCs are all superimposed on the northern extension of the Magellanic Stream (MS), but at velocities distinct from the MS at that point on the sky. The LMPU369 and LMPU369 OFF mini-HVCs are several degrees west of the MS, and the LMPU025 mini-HVCs along with those superimposed on WvW 491 and WvW 479 are spatially in the vicinity of the recently reported northern extension of the MS (Braun & Thilker, 2004; Stanimirović et al., 2002; Lockman et al., 2002), but at distinct velocities.
The moderate proximity of all but one of the as-yet-discovered mini-HVCs to the MS raises the question: Are most of the mini-HVC somehow associated with the MS in spite of the velocity difference? A bifurcation of the MS has already been noted by Stanimirović et al. (2002), although with a smaller difference in velocity.
A second possibility is that some of the mini-HVCs are the low column density tail of the retinue of CHVCs which surround M31 (Thilker et al., 2004) and M33 (Braun & Thilker, 2004), if that retinue extends about 200 kpc from M31 or M33. The physical H I diameters of mini-HVC would in that case be comparable to those of typical CHVCs since the mini-HVCs would be 3-4 times more distant. It would be necessary that there be some beam dilution of the cores of the mini-HVCs unless the M31 population of CHVCs has inherently lower column density cores than the Milky Way population. However, the cores of typical CHVCs span several Arecibo beams, which implies that beam dilution would be minimal if they were moved 3-4 times further away, and for our mini-HVC we observe similar column densities spanning 2-3 Arecibo beams around the maximum observed column density, suggesting that they have not suffered much beam dilution. Mapping, with adequate sensitivity, of the sky in the vicinity of M31 (as close as the northern limit of the Arecibo declination range permits) using the Arecibo L-band Feed Array should help distinguish between MS and M31/M33 affiliation. Telescopes with larger beams would suffer beam dilution of the mini-HVC cores, mandating longer integration times.
A third possibility is that the mini-HVCs have nothing to do with the MS on the one hand, nor with M31 or M33 on the other, and are just the low column density tail of the Milky Way’s CHVC population. This possibility becomes more attractive with the additional conjecture that distance from the Milky Way tends to increase with decreasing central column density . Typical CHVC distances might then be only 50 to 100 kpc and mini-HVC distances typically 200 kpc with little difference in absolute linear sizes. The concentration of the mini-HVCs discovered to date toward the MS and M31 would then just be a selection effect, a consequence of our having chosen HVCs mainly in that direction for edge mapping and of small number statistics in the LMPU isolated central beam sources. A prediction for very sensitive H I mapping from 50 to 200 kpc away from M31 and M33 is decreasing but little change in angular size.
4.2 Column Density-Diameter Relationship
The relation of peak column density to diameter for our 15 mini-HVCs is shown in the left-hand panel of Fig. 9 and compared to that for CHVC in the right-hand panel. Here we have simply taken the peak column density as recorded by whatever telescope was used. CHVC mapped only with Parkes or Dwingeloo may have central column densities reduced by beam dilution by comparison to those mapped at Arecibo. The diameters are also heterogeneous; most of the CHVC were not mapped to as low a column density as the few mapped at Arecibo. We have simply taken the diameter to the outermost point at which flux was detected. Therefore many of the HIPASS and LDS data points would move to the right and upward in the figure if those CHVC were remapped at Arecibo. For the mini-HVCs and CHVCs separately there is some trend toward lower column density for smaller angular diameter, but with a large scatter. According to the conjecture mentioned above (third possibility, Sect. 4.1), the small angular size may be due to larger distance rather than smaller linear size.
4.3 Photoionization Controversies
For hydrogen gas with volume density , ionized at rate by extragalactic UV plus collisions, there is a critical value of H I column density above which there is little H II (Corbelli & Bandiera, 2002; Corbelli, Salpeter & Bandiera, 2001; Sternberg, McKee & Wolfire, 2002). Below the neutral component decreases very rapidly with decreasing total hydrogen column density so the H I scalelength is a few times smaller than the scalelength for total hydrogen. The value of is proportional to the ratio . If were for a CHVC, the ionized hydrogen would contribute little and the total gas mass (assuming 200 kpc distance) would be about . If as for spiral galaxies, the true total hydrogen scalelength is much larger, and is or more. Similar reasoning must apply to the mini-HVC, although (if they lie in a similar ionization field) their smaller central neutral column density would imply an even larger fraction of ionized gas.
Observations of the outer disks of spiral galaxies suggest , as does our study of the dwarf irregular DDO154 (Hoffman, Salpeter & Carle, 2001). This agrees with the theoretical expectations if ionization is due solely to extragalactic UV. Similar values of are suggested for CHVC at 200 kpc distance (Sternberg, McKee & Wolfire, 2002). However, the recent detection of H in several CHVC by Tufte et al. (2002) and Putman et al. (2003a) exceeds that which could be produced solely by photoionization by extragalactic UV; if CHVC are outside the Milky Way halo they must be ionized collisionally by a hot intragroup medium (Burstein & Blumenthal, 2002), which increases appreciably. Highly ionized gas has been found around the major HVC Complex C (Fox et al., 2004) but it is unknown at this time whether the hot medium is an extended Galactic corona or one that pervades the Local Group. If the gas density were uniform this would raise appreciably as well. However, if pressures are slightly larger than previous estimates, the gas may be inhomogeneous with pockets of cold H I at densities times larger than the warm neutral medium. If so, could again be of order where collisional ionization is present (and much less where it is not).
4.4 Implications for Lyman Limit Systems
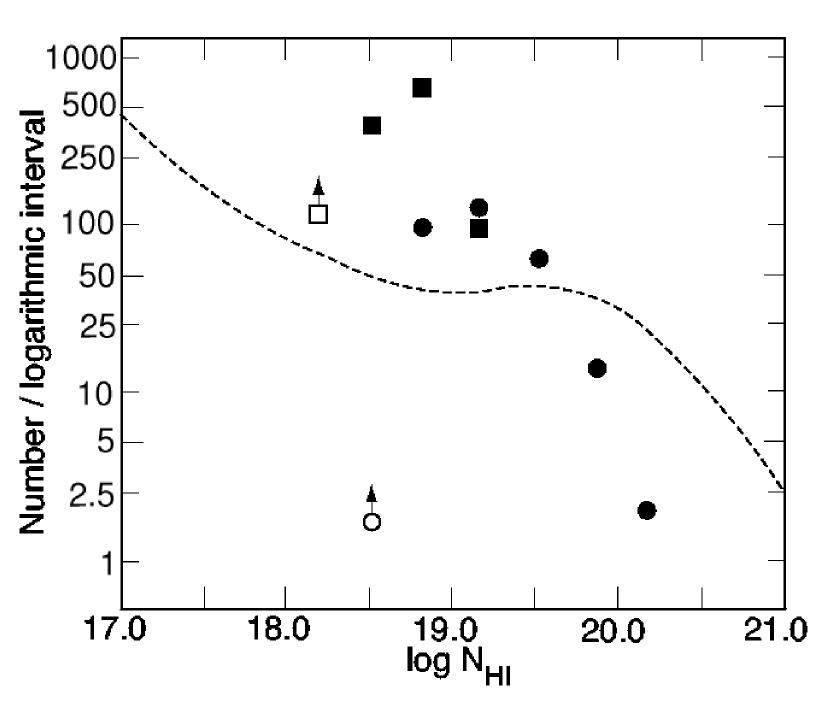
The distribution function of central column density from the northern hemisphere Leiden-Dwingeloo Survey (LDS) of de Heij, Braun & Burton (2002b) and the southern hemisphere Parkes survey (HIPASS) of Putman et al. (2002) is shown in Fig. 11, along with that for our mini-HVCs. We do not know yet what selection effects apply to the mini-HVCs; the areas searched with the necessary column density sensitivity may well be favorable one. So we do not know how many more mini-HVCs there might be on the whole sky. For illustrative purposes, in Fig. 11 we have simply multiplied the mini-HVC distribution by a factor of 100 to bring it into agreement with that for CHVC for near . If mini-HVCs were distributed around the sky similar to CHVCs, the factor would be much larger. If the factor of 100 proves to be of the right order of magnitude, Fig. 11 suggests that low-column density CHVC have been undercounted by the surveys and that there are many more in total.
There has been some controversy as to what extent Lyman Limit Systems are composed of small starless individual gas clouds. CHVC, and their lower column density extensions, are candidates for this purpose, especially if it turns out that low column density CHVC have been undercounted.
5 Conclusions and Summary
We have presented evidence of 14 very small, low column density H I clouds which we call “mini-HVC.” These have peak neutral hydrogen column densities (averaged over the Arecibo beam) and H I diameters to our minimum detectable column density in the range to . Both column density and diameter are considerably smaller than most Compact High Velocity Clouds (CHVC), but the mini-HVC fit smoothly onto the low column density tail of the CHVC in a plot of column density vs. diameter. Although our mapping undersamples the mini-HVCs, we find near-constant column densities around the observed peak. This suggests that shock activity cannot be prevalent and that there is no transition from the warm neutral to cold neutral phase in these clouds. The sensitivity of our detection survey for mini-HVC is considerable better than that for the CHVC catalogs, but only a very small fraction of the sky was covered. Consequently, we cannot compare number densities for the two surveys reliably. However, it is possible that the presently available CHVC catalogs are appreciably incomplete for H I column densities .
For CHVC recent surveys have given unexpectedly large values of H intensity (Tufte et al., 2002; Putman et al., 2003a). This has raised questions as to whether ionization by extragalactic UV photons is greatly supplemented by Galactic UV and/or by collisions with a hot intra-Local Group medium (Burstein & Blumenthal, 2002). The ratio of ionized to neutral hydrogen is therefore somewhat uncertain for CHVC. Because of the smaller H I column densities, this ratio is even more uncertain, and possibly quite large, for mini-HVC.
There remain two chief unknowns about mini-HVC: their distance from the Milky Way and their distribution around the sky. To determine the latter would require mapping much larger areas of the sky with the Arecibo L-band Feed Array (ALFA), but to much higher sensitivity than is planned for the ALFA consortium surveys. A distribution on the sky similar to that of CHVC would suggest that the mini-HVC are simply the low column density tail of the CHVC distribution. Although there continues to be much controversy on distances (Burton, Braun & de Heij, 2002; Maloney & Putman, 2003), typical CHVC may lie at distances of order 50-100 kpc and mini-HVCs at distances of order 200 kpc. One other possibility is a relationship to the Magellanic Stream, except for one mini-HVC which is nearly a hemisphere away. Recently, some gas clouds have been detected by Thilker et al. (2004) which seem to lie within about 50 kpc of M31. This raises the possibility that the mini-HVC are CHVC analogs within to 100 kpc from M31 rather than in a comparable volume around the Milky Way. However, in this case the M31 CHVC would have to have smaller column densities on average than the Milky Way CHVC.
References
- Blitz et al. (1999) Blitz, L., Spergel, D., Teuben, P., Hartmann, D., & Burton, W. B. 1999, ApJ, 514, 818
- Braun & Burton (1999) Braun, R., & Burton, W. B. 1999, A&A, 341, 437
- Braun & Thilker (2004) Braun, R., & Thilker, D. A. 2004, A&A, 417, 421
- Burton, Braun & Chengalur (2001) Burton, W. B., Braun, R., & Chengalur, J. 2001, A&A, 369, 616
- Burstein & Blumenthal (2002) Burstein, D., & Blumenthal, G. 2002, ApJ, 574, L17
- Burton, Braun & de Heij (2002) Burton, W. B., Braun, R., & de Heij, V. 2002, to appear in High Velocity Clouds, eds. van Woerden, Wakker, Schwarz & de Boer (astro-ph/0206359)
- Corbelli & Bandiera (2002) Corbelli, E., & Bandiera, R. 2002, ApJ, 567, 712
- Corbelli, Salpeter & Bandiera (2001) Corbelli, E., Salpeter, E. E., & Bandiera, R. 2001, ApJ, 550, 26
- Davies et al. (2002) Davies, J., Sabatini, S., Davies, L., Linder, S., Roberts, S., Smith, R., & Evans, Rh. 2002, MNRAS, 336, 155
- de Heij, Braun & Burton (2002a) de Heij, V., Braun, R., & Burton, W. B. 2002a, A&A, 391, 159
- de Heij, Braun & Burton (2002b) de Heij, V., Braun, R., & Burton, W. B. 2002b, A&A, 392, 417
- Fox et al. (2004) Fox, A. J., Savage, B. D., Richter, P., Sembach, K. R., & Tripp, T. M. 2004, ApJ, 602, 738
- Hoffman et al. (2003) Hoffman, G. L., Brosch, N., Salpeter, E. E., & Carle, N. J. 2003, AJ, 126, 2774
- Hoffman, Salpeter & Carle (2001) Hoffman, G. L., Salpeter, E. E., & Carle, N. J. 2001, AJ, 122, 2428
- Hoffman, Salpeter & Pocceschi (2002) Hoffman, G. L., Salpeter, E. E., & Pocceschi, M. G. 2002, ApJ, 576, 232
- Hopp, Schulte-Ladbeck & Kerp (2003) Hopp, U., Schulte-Ladbeck, R. E., & Kerp, J. 2003, MNRAS, 339, 33
- Lockman et al. (2002) Lockman, F. J., Murphy, E. M., Petty-Powell, S., & Urick, V. J. 2002, ApJS, 140, 331
- Maloney & Putman (2003) Maloney, P. R., & Putman, M. E. 2003, ApJ, 589, 270
- Murphy, Lockman, & Savage (1995) Murphy, E. M., Lockman, F. J., & Savage, B. D. 1995, ApJ, 447, 642
- Putman et al. (2002) Putman, M. E., et al. 2002, AJ, 123, 873
- Putman et al. (2003a) Putman, M. E., Bland-Hawthorn, J., Veilleux, S., Gibson, B. K., Freeman, K. C., & Maloney, P. R. 2003a, ApJ, 597, 948
- Putman et al. (2003b) Putman, M. E., Staveley-Smith, L., Freeman, K. C., Gibson, B. K., & Barnes, D. G. 2003b, ApJ, 586, 170
- Robishaw, Simon & Blitz (2002) Robishaw, T., Simon, J. D., & Blitz, L. 2002, ApJ, 580, L129
- Sembach et al. (2002) Sembach, K. R., Gibson, B. K., Fenner, Y., & Putman, M. E. 2002, ApJ, 572, 178
- Simon & Blitz (2002) Simon, J. D., & Blitz, L. 2002, ApJ, 574, 726
- Stanimirović et al. (2002) Stanimirović, S., Dickey, J. M., Krćo, M., & Brooks, A. M. 2002, ApJ, 576, 773
- Sternberg, McKee & Wolfire (2002) Sternberg, A., McKee, C. F., & Wolfire, M. G. 2002, ApJS, 143, 419
- Thilker et al. (2004) Thilker, D. A., Braun, R., Walterbos, R. A. M., Corbelli, E., Lockman, F. J., Murphy, E., & Maddalena, R. 2004, ApJ, 601, L39
- Tufte et al. (2002) Tufte, S. L., Wilson, J. D., Madsen, G. J., Haffner, L. M., & Reynolds, R. J. 2002, ApJ, 572, L153
| Object | RA(2000) | Dec(2000) | Peak Flux | Diameters | P.A. | Peak Column | ||
|---|---|---|---|---|---|---|---|---|
| (hhmmss.s) | (ddmmss) | (Jy km ) | (arcmin) | (deg) | () | (km ) | (km ) | |
| WvW 413 | 222135.6 | 254709 | 0.515 | 10 | 14.5 | 27 | ||
| WvW 479 | 012427.8 | 254003 | 2.370 | 40 | 66.9 | 21 | ||
| WvW479min1 | 012409.0 | 252403 | 0.164 | 4.6 | 27 | |||
| WvW479min2 | 012741.7 | 252715 | 0.212 | 6.0 | 29 | |||
| LMPU025-163 | 005305.9 | 291710 | 0.080 | 70 | 2.2 | 22 | ||
| LMPU025-291 | 005434.9 | 292158 | 0.276 | 160 | 7.8 | 25 | ||
| LMPU025-335 | 005331.3 | 292334 | 0.149 | 40 | 4.2 | 20 | ||
| LMPU025-395 | 005123.8 | 292022 | 0.571 | 0 | 16.1 | 21 | ||
| LMPU025 OFF-173 | 005944.0 | 293758 | 0.114 | 60 | 3.2 | 22 | ||
| LMPU025 OFF-293 | 005956.7 | 291710 | 0.129 | 3.6 | 27 | |||
| LMPU236+242 | 123955.5 | 093441 | 0.068 | 10 | 1.9 | 27 | ||
| LMPU369-210 | 213849.5 | 023140 | 0.289 | 60 | 8.2 | 49 | ||
| LMPU369 OFF-260 | 214545.0 | 030204 | 0.157 | 30 | 4.4 | 32 | ||
| LMPU387-230 | 225751.6 | 072649 | 0.169 | 60 | 4.8 | 23 | ||
| LMPU387-275 | 225740.4 | 075401 | 0.184 | 0 | 5.2 | 34 | ||
| LMPU387-297 | 225751.6 | 072337 | 0.318 | 20 | 9.0 | 27 |