Abundances and kinematics of a candidate sub-damped Lyman galaxy toward PHL 1226††thanks: Based on observations obtained at the German-Spanish Astronomical Center, Calar Alto, operated by the Max-Planck-Institut für Astronomie Heidelberg jointly with the Spanish National Commission for Astronomy
The spectrum of the quasar PHL~1226 is known to have a strong Mg ii and sub-damped Lyman (sub-DLA) absorption line system with cm-2 at . Using integral field spectra from the Potsdam Multi Aperture Spectrophotometer (PMAS) we investigate a galaxy at an impact parameter of 64 which is most probably responsible for the absorption lines. A fainter galaxy at a similar redshift and a slightly larger distance from the QSO is known to exist, but we assume that the absorption is caused by the more nearby galaxy. From optical Balmer lines we estimate an intrinsic reddening consistent with 0, and a moderate star formation rate of 0.5 M⊙ is inferred from the H luminosity. Using nebular emission line ratios we find a solar oxygen abundance and a solar nitrogen to oxygen abundance ratio . This abundance is larger than those of all known sub-DLA systems derived from analyses of metal absorption lines in quasar spectra. On the other hand, the properties are compatible with the most metal rich galaxies responsible for strong Mg ii absorption systems. These two categories can be reconciled if we assume an abundance gradient similar to local galaxies. Under that assumption we predict abundances and for the sub-DLA cloud, which is similar to high redshift DLA and sub-DLA systems. We find evidence for a rotational velocity of 200 km s-1 over a length of 7 kpc. From the geometry and kinematics of the galaxy we estimate that the absorbing cloud does not belong to a rotating disk, but could originate in a rotating halo.
Key Words.:
galaxies: abundances – galaxies: kinematics and dynamics – galaxies: quasars: individual: PHL 12261 Introduction
Metal absorption line systems in QSO spectra are frequently used to derive abundances of intervening neutral gas clouds of high column density. A classic definition divides strong QSO hydrogen absorption systems into different regimes: Lyman limit systems (LLS) with column densities of neutral hydrogen in the range cm-2, and damped Lyman systems (DLAs) having (H i) cm-2 (Wolfe et al. 1986). Sub-DLA systems with cm-2 also show broad absorption line wings characteristic for DLAs and contain a large fraction of the neutral hydrogen at high redshifts (Péroux et al. 2003). Strong hydrogen absorption lines in QSO spectra are believed to arise in gas-rich (proto)-galaxies, but any relation between absorption line systems and the galaxies responsible for these is not well understood. Deep imaging studies of the fields around QSOs which exhibit strong Ly absorption lines have revealed several absorbing galaxy candidates close to the line of sight (e.g. Le Brun et al. 1997). Follow-up spectroscopy is necessary to confirm the candidates as the corresponding absorbing galaxies.
To date only few (13) low-redshift DLAs and sub-DLA galaxies have been identified (Turnshek et al. 2001; Rao et al. 2003; Chen & Lanzetta 2003; Lacy et al. 2003, and references therein), while at high redshift even fewer confirmations exist (Møller & Warren 1993; Djorgovski et al. 1996; Fynbo et al. 1999; Møller et al. 2002; Christensen et al. 2004; Møller et al. 2004). Considering the difficulties of confirming the absorbing galaxies, alternative approaches have been carried out to determine which types of galaxies produce DLA systems. Through measurements of relative abundances of various elements, it has been suggested that DLA galaxies are likely dwarf galaxies (Pettini et al. 1999; Prochaska et al. 2003; Dessauges-Zavadsky et al. 2003; Nissen et al. 2004). Sub-DLAs show the same spread in metallicity as the DLA systems indicating a similar nature of the two samples (Péroux et al. 2003). Although metallicities of DLA and sub-DLA systems can be easily derived from the QSO spectra, the metallicity of the parent galaxy has only been determined for one DLA galaxy previously (Schulte-Ladbeck et al. 2004).
Studies have shown that Mg ii absorption systems arise in halos of a wide range of galaxy types (Bergeron & Boisse 1991; Steidel et al. 1994) and are typically associated with LLS. Mg ii systems have been suggested to be related to rotating disks (Charlton & Churchill 1998), while Steidel et al. (2002) found that Mg ii systems cannot be explained by simple disk models and suggested that the absorption occurs in rotating halos.
The quasar PHL 1226 (Q0151+045 at ) has a strong Mg ii absorption system at (Bergeron et al. 1988, hereafter B88). A column density of cm-2 was measured in a UV HST spectrum classifying the object as sub-DLA (Rao 2004, private communication). A bright 0.3 galaxy at a projected angular separation of 64 to the west of the QSO was identified as being responsible for the absorption system by B88, who named this galaxy G4. For a flat cosmological model with and km s-1 Mpc-1, which we use throughout the paper, an impact parameter of 64 corresponds to 17.6 kpc. An additional fainter galaxy, G3 () at a similar redshift, was found at an impact parameter 109 to the north of the QSO. Either galaxy could be responsible for the absorption system considering the scaling-law between Mg ii halo sizes and galaxy luminosities (Bergeron & Boisse 1991; Le Brun et al. 1993; Guillemin & Bergeron 1997). Optical spectroscopy of G3 and G4 is presented in Ellison et al. (2004).
In this paper we present a study of the galaxy G4 using integral field spectroscopy with the Potsdam Multi Aperture Spectrophotometer (PMAS Roth et al. 2000). We describe the data reduction in Sect. 2. Spectra and synthetic narrow-band emission line images are presented in Sect. 3 From the spectra we derive the intrinsic reddening, oxygen and nitrogen abundances, and star formation rate in Sect. 4. We analyse the kinematics of the galaxy itself in Sect. 5. A discussion is presented in Sect. 6, and the conclusions in Sect. 7.
2 Observations and data reduction
PMAS is an Integral Field Instrument developed at the Astrophysikalisches Institut Potsdam. It is currently installed at the Calar Alto Observatory 3.5m Telescope in Spain and has been available as a common user instrument since July 1, 2002. Observations using integral field units have the advantage of combining imaging and spectroscopy information in one dataset. In 2002, we started a project to use PMAS for the study of sub-DLA and DLA galaxies. The great advantage of using integral field spectroscopy for the investigation of the very few currently known sub-DLA and DLA galaxies is that they allow us to obtain data on the galaxies’ positions, velocity fields and star-forming properties all in one data cube. Such data are critical to derive the nature of the galaxies causing absorption systems in QSOs. It is our goal to use this new instrument to identify galaxies responsible for low- as well as high-redshift QSO absorbers, and to study their properties.
During the pilot observing run for this project, we observed two QSO fields. Observations for the DLA galaxy toward Q223+131 revealed an extended Lyman- emission nebula surrounding the galaxy responsible for the DLA; the analysis was presented in Christensen et al. (2004). A second object observed in the pilot study was PHL 1226 (Q0151+045). The 8″8″ PMAS field was targeted at the galaxy G4 because it is closer to the QSO than G3, and thus the more likely absorbing galaxy. An additional criterion was technical – G4 is more than a magnitude brighter than G3 which is farther than 8″ away from PHL 1226; its observation would have required another set-up and a large amount of observing time. Here, we report in detail on the results which can be obtained from the PMAS data of G4.
We obtained 41800s exposures of G4 divided over two nights on Sep. 5 and 8, 2002, using a grating with 300 lines mm-1 which resulted in a spectral resolution of 6.6 Å FWHM. The chosen grating angle allowed to cover the wavelength range 4575–7880 Å. The first night was photometric with a seeing of 1″, while the seeing was varying during the second night and the conditions were not photometric. A log of the observations is presented in Table 1.
The PMAS instrument has two cameras; one for the spectrograph, and an additional camera used for acquisition and guiding (A&G camera) which is equipped with a 1kk SITe CCD. Using data from the A&G camera, one can estimate the variations and the evolution of the sky quality during the night. Photometry of the guide star images taken during the spectral integrations, show variations with a standard deviation presented in column 5 of Table 1.
The spectrograph is coupled by 256 fibers to a 1616 element micro-lens array. During the observations each lens covered 0505 on the sky. The detector is a 2k4k SITe ST002A CCD which was read out in a 22 binned mode.
| date (UT) | exposure time (s) | airmass | seeing | (%) | S/N |
|---|---|---|---|---|---|
| Sep. 5 2002 02:48 | 1800 | 1.19 | 1″ | 0.5 | 5.9 |
| Sep. 5 2002 03:20 | 1800 | 1.19 | 1″ | 0.5 | 5.7 |
| Sep. 8 2002 00:03 | 1800 | 1.57 | 13–15 | 10 | 3.9 |
| Sep. 8 2002 00:36 | 1800 | 1.14 | 13–15 | 9 | 4.2 |
Data reduction was performed with IDL based routines written specifically for PMAS data (Becker 2002). After bias subtraction the spectra were extracted using information of the location of the 256 spectra on the CCD obtained from a calibration frame obtained with an exposure of a continuum emission lamp immediately before or after each target exposure. In the extraction a Gaussian line profile was used to increase the signal-to-noise ratio of the extracted spectra. Wavelength calibration was done using calibration spectra of Hg-Ne emission line lamps also obtained following the science exposures. The accuracy of the wavelength calibration was checked using sky emission lines, showing a standard deviation of 0.3 Å. Corrections for varying fiber-to-fiber transmissions as a function of wavelength uses flat field spectra obtained from the twilight sky.
Cosmic rays were removed from the spectra using the L.A. Cosmic routine within IRAF (van Dokkum 2001). Each of the 4 exposures were corrected for an average extinction value appropriate for Calar Alto before combining them. The effect of differential atmospheric extinction was corrected using the theoretical approach described in Filippenko (1982). We checked whether the data cube was appropriately corrected for the differential atmospheric refraction by cross-correlating each monochromatic image with the broad-band image shown in Fig. 1. This showed that the relative shift with wavelength was smaller than 008, which was negligible for the further analysis. Subtraction of the sky background was done by creating an average sky spectrum by selecting spaxels (spatial elements) located between the QSO and the galaxy, uncontaminated by flux from any of these two. This sky spectrum was subtracted from all 256 spectra.
The method for combining the individual exposures was as follows. Firstly, monochromatic images were made from the data cube at some selected wavelength. Then we found a scale factor between the images, by calculating the total flux in the images. Because the spectra taken on Sep. 8 were of poorer quality than the first ones, the individual data cubes were scaled to the ones from Sep 5., and the final combination took the varying seeing into account by applying a weighting scheme, where the weights were given from the signal to noise ratio of each spectrum. The signal-to-noise ratio was found from a 1D spectrum created by co-adding spectra within 1″ radial aperture centered on the galaxy. These S/N ratios are listed in column 6 in Table 1. Finally, flux calibration was done the standard way by comparing the spectra obtained of the spectrophotometric standard, BD+28$^∘$4211 observed on Sep. 5 with table values. After the data reduction the spectra are contained in a data cube of dimensions pixels.
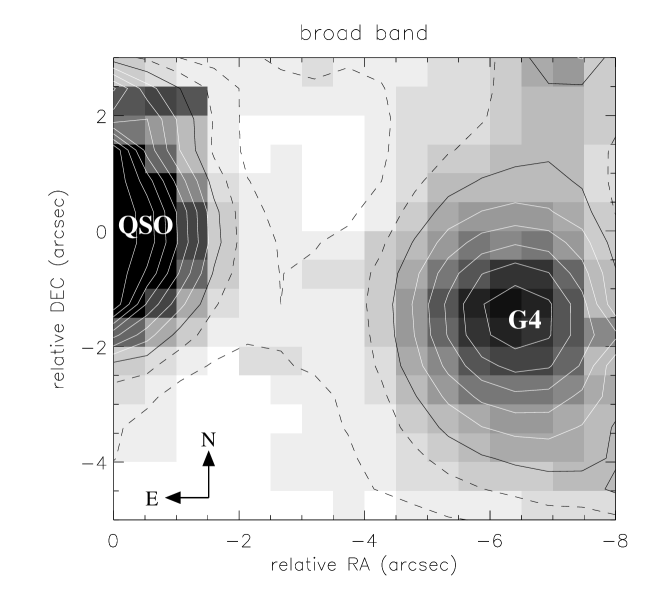
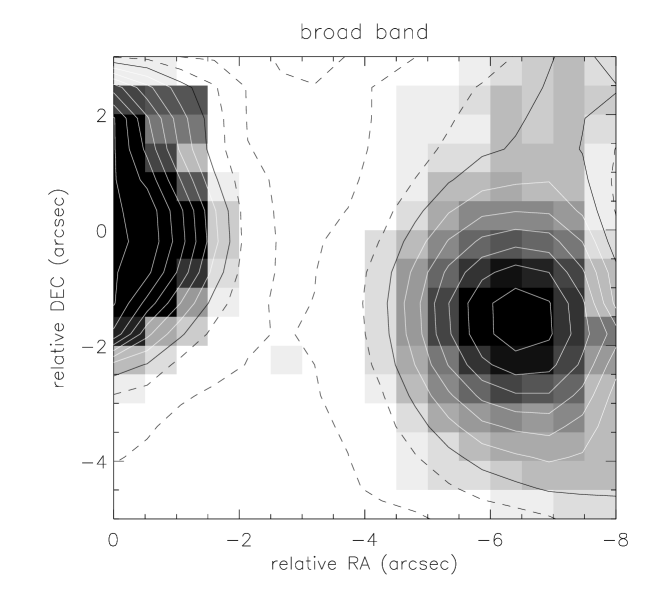
Further analysis of the reduced data cube was done using the Euro3D Visualization Tool (Sánchez 2004), while one-dimensional spectra were analysed using both IRAF and our own software (Sánchez et al., 2004, in prep.). Fig. 1 presents a composed broad-band image, with dimensions 8″8″. To the east (left), the QSO is seen at the edge of the field. The absorbing galaxy G4, identified by B88, is the principal source in the field at the position in agreement with the impact parameter of 64.
3 Galaxy and QSO spectra
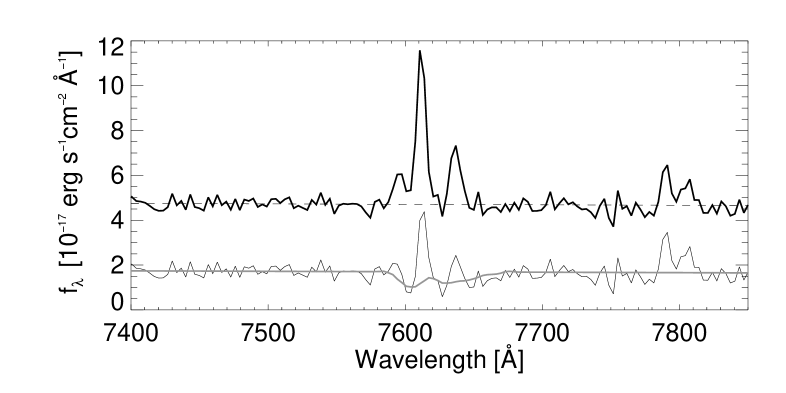
In the dust maps of Schlegel et al. (1998) a Galactic reddening of = 0.051 is found in the direction toward PHL 1226. The reduced spectra were de-reddened using this value before deriving other quantities. From the reduced data cube, one can create spectra from chosen spaxels or monochromatic- and narrow band images in any wavelength region. A spectrum of the QSO created by co-adding 20 spaxels is shown in Fig. 2.
One sees that strong telluric absorption lines are present around 7600 Å which coincidentally corresponds to H at the redshift of the absorber. When line fluxes are derived, this feature will skew the results towards lower values if not corrected for. Thus, to correct for this effect, a model for the telluric absorption line was created. The QSO spectrum was smoothed using a Gaussian function with Å, normalised to 1 at 7580 Å and outside the region around 7600 Å the value was set to 1. Following, all spectra were divided by this model to correct for the absorption as demonstrated in in Fig. 4, which brought out the presence of the [N ii] (6548 Å) line in the spectrum of G4 as explained in detail in Sect. 3.2.

Co-adding all spaxels (112 in an area of 4″7″) corresponding roughly to the size of the galaxy in this dataset results in the spectrum presented in Fig. 3. This spectrum gives the total continuum flux from the galaxy with S/N = 6 and does not show strong emission lines, specifically not before the correction for telluric absorption is applied. One must note that co-adding 112 spaxels dilutes any emission line signal coming from a potentially smaller region. Additionally, residuals from the background subtraction can artificially enhance emission lines. This appears to be the case for the sulfur lines in Fig. 3, because they lie close to strong sky lines. In order to increase the signal to noise ratio of the emission line spectrum, and be less affected by sky subtraction residuals, a localization of the emission line region needs to be done.
To check the spectrophotometry, we convolved the galaxy spectrum with a transmission curve of the Bessell band filter. We find 0.05, corresponding to an absolute magnitude = –20.3 for the galaxy in agreement with the photometry in B88.

3.1 Emission line images
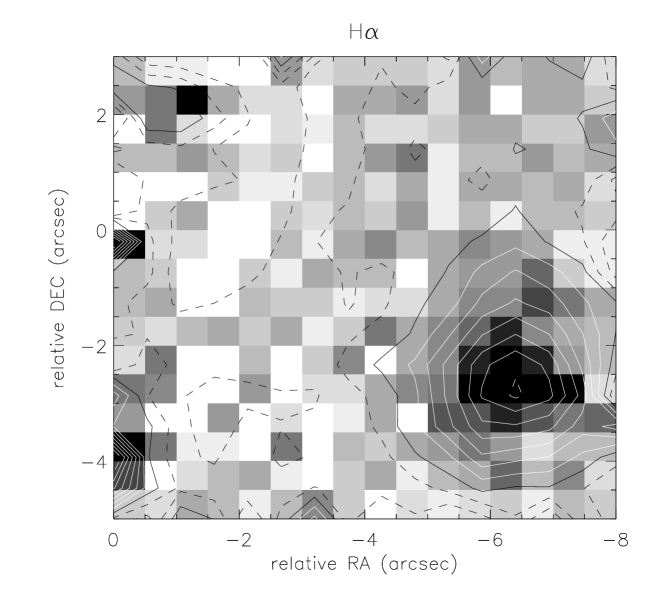
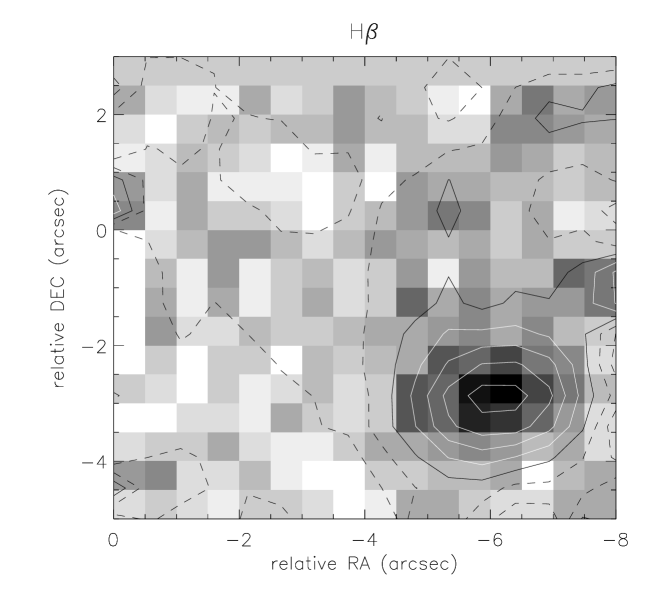
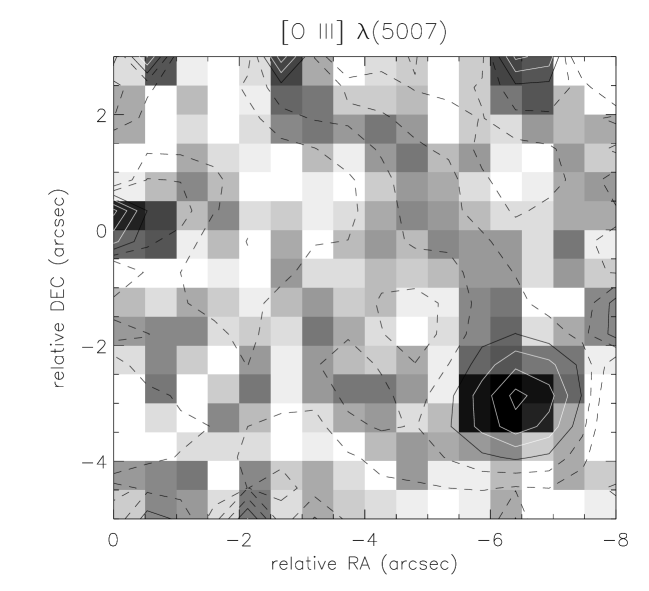
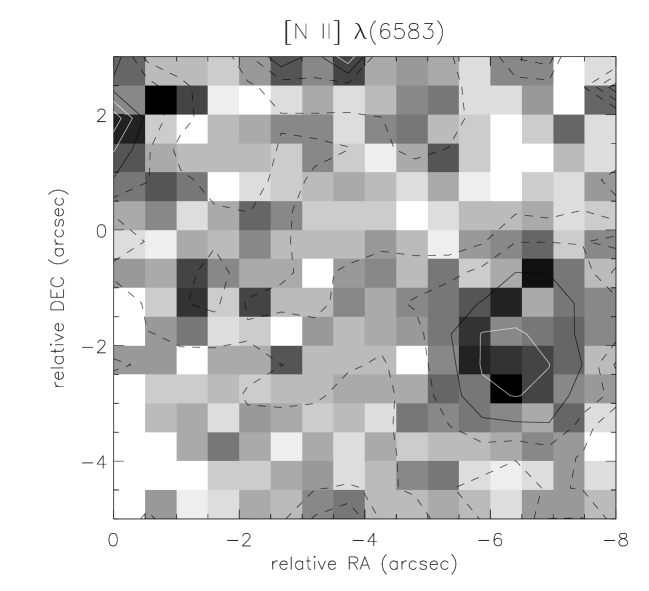
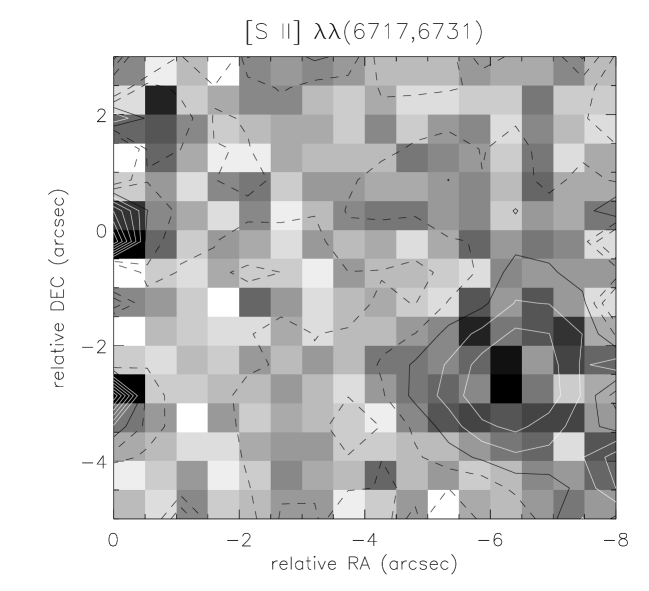
Emission line images are created by selecting appropriate narrow band filters from the data cube. These narrow band images are created in a wavelength range of 10Å around the emission wavelength as shown in Fig. 5. The continuum emission is subtracted using narrow-band images in wavelengths adjacent to the emission lines. Compared to the broad band image in the lower right panel, one sees that most of the emission lines originate 1″ to the south of the G4 centre. Furthermore, the strongest emission is located in a region within a 2″2″ aperture. No other strong emission line regions are found in the field.
3.2 High surface brightness region
To create a spectrum with a higher signal to noise ratio relevant for deriving properties from the emission lines, we selected spaxels from Fig. 5 where the surface brightness of the emission lines is strongest, i.e. within a 1″ radial aperture (corresponding to 15 spaxels) centered on (–2.5,–6.5). Several lines can be identified in the spectrum shown in Fig. 6. Observed line fluxes and equivalent widths (EW) are listed in Table 2. All emission line fluxes refer to the spectrum which has been corrected for the telluric absorption feature.

The median redshift of the emission lines is in agreement with found by B88. The observed FWHM of emission lines are Å and Å for H and H, respectively, which implies that the lines are consistent with being unresolved given the spectral resolution. Line fluxes of the faint lines have been derived assuming a similar width as for the brighter lines. The velocity difference between the absorption system and the median emission redshift is 180 km s-1. In Sect. 5 we will return to further analysis of the kinematics involved in this system along with the implications.
To check if the correction for telluric absorption is appropriate we measure the line ratio [N ii]6583/[N ii]6548 which should theoretically be 3.0 (Wiese et al. 1966), while the derived ratio is . Thus, we conclude that the correction does not introduce large errors of the derived line fluxes. Before application of the correction the line ratio is 2, however, it is uncertain as the continuum level is wrongly placed because of the telluric absorption.
Although unaffected by the correction for telluric absorption, the [O iii]5007/[O iii]4959 line ratio should be 2.87, while we measure the ratio 2.310.85. Line ratios of the emission lines [O iii]5007 vs. H and [N ii]6583 vs. H classify this object as an H ii galaxy according to the classification scheme of Veilleux & Osterbrock (1987).
Using long slit spectroscopy B88 find a H line flux of erg cm-2 s-1, which is slightly below our measured line flux given in Table 2. Their long slit spectrum was obtained with a 15 slit, i.e. smaller than our 1″ radial aperture for creating the spectrum. Therefore, our finding of a larger line flux can be explained by small slit-losses in their spectrum.
| line () | redshift | line flux | EW | |
|---|---|---|---|---|
| (Å) | erg cm-2 s-1 | (Å) | ||
| H (4340.49) | 5037.29 | 0.1602 | 1.530.48 | 3.8 |
| H (4861.36) | 5639.60 | 0.1598 | 2.970.37 | 8.9 |
| [O iii] (4958.91) | 5754.00 | 0.1600 | 0.700.23 | 2.8 |
| [O iii] (5006.84) | 5808.78 | 0.1598 | 1.620.28 | 6.6 |
| [N ii] (6548.05) | 7594.64 | 0.1595 | 0.830.17 | 7.6 |
| H (6562.85) | 7611.88 | 0.1595 | 8.980.28 | 43.8 |
| [N ii] (6583.45) | 7635.31 | 0.1595 | 2.970.17 | 16.2 |
| [S ii] (6716.44) | 7788.96 | 0.1594 | 3.040.60 | 17.1 |
| [S ii] (6730.82) | 7804.33 | 0.1592 | 1.950.50 | 15.5 |
4 Derived properties
Using the strong emission lines observed in the galaxy spectrum we derive the dust reddening, abundances from the nebular emission lines in Table 2, and its star formation rate.
4.1 Dust reddening
From the observed Balmer decrement the dust content can be estimated. In the Case B Balmer recombination scenario the ratio of the emission lines is , depending slightly on the temperature and density (Brocklehurst 1971), while the observed flux ratio is 0.39 which is consistent with no reddening.
Using the Milky Way extinction curve in Fitzpatrick (1999), we find the reddening 0.09 or equivalently 0.28 for a Galactic value of . Similarly, the theoretical ratio of is 0.46 in the case B scenario, while we measure . This corresponds to =0.250.88 which is in agreement with the reddening derived from the H/H line ratio.
Because the internal extinction in this system is consistent with 0, we do not correct the derived emission line fluxes for this effect. With integral field data one can in principle create dust maps by dividing the H-image with the H-image, but in this case, the signal to noise ratio is not high enough to derive a reliable extinction map.
4.2 Chemical abundances
Using the line fluxes of strong emission lines we derive abundances of oxygen and nitrogen using various calibrations and diagnostics from the literature.
4.2.1 Oxygen
To determine the oxygen abundance of the galaxy we make use of the relation recently calibrated in Pettini & Pagel (2004). Our data cover all the strong lines involved in the calibration which for G4 yields , while an additional error of 0.14 dex is due to the scatter in the calibration itself. The abundance corresponds to the solar oxygen abundance 8.660.05 in Asplund et al. (2004). This solar oxygen abundance is lower than found in models previously111The larger solar O abundance in Holweger (2001) compared to that derived in Asplund et al. (2004) is due to an ignored contribution from a Ni blend, but also a difference between their adopted 1D and 3D models., driving the derived oxygen abundance for G4 relative to solar towards higher values than reported in the literature for other Mg ii galaxies. Taking instead the solar oxygen abundance 8.740.08 obtained by Holweger (2001), G4 has sub-solar metallicity (0.8⊙), but still consistent with solar within 1 errors.
The ratio benefits from the fact that the involved lines are not separated by long wavelength ranges, and thus the quantity is largely unaffected by dust obscuration. At any rate, the small intrinsic reddening inferred for G4 implies that the ratio is affected little.
For comparison we also calculate oxygen abundances using line diagnostics calibrated by other authors. For example, the oxygen abundance can be estimated from the ratio using the calibration in Denicoló et al. (2002). These two strong emission lines are present in the G4 spectrum, and the calibration gives . Applying instead the slightly different calibration of the ratio in Pettini & Pagel (2004), we find in agreement with the diagnostic. The intrinsic 1 scatter of this latter calibration causes an additional uncertainty of 0.18 dex.
As another line of enquiry, we combine our data of G4 with those available in the literature. Oxygen abundances have frequently been determined using the intensity ratio (Pagel et al. 1979). Although the spectrum of G4 does not cover the wavelength of [O ii], we can estimate roughly the value if it had been covered. If the flux reported in B88 ( erg cm-2 s-1) is not corrected for Galactic extinction, the un-absorbed value will be , where is the Galactic extinction, and is the value of the extinction curve at the wavelength of [O ii] at . Furthermore, we correct the slit-loss present in their spectra by applying a scale factor between their H line flux and ours. We estimate the [O ii] line flux erg cm-2 s-1. Ellison et al. (2004) find an [O ii] flux twice this value, but also their H and [O iii] fluxes are twice the ones we measure.
Using the scaled B88 [O ii] line flux we find 0.18, which according to the calibrations in Kobulnicky et al. (1999) gives . This value agrees within the errors with the -based in Ellison et al. (2004) which justifies our assumption of applying a scaling factor of the [O ii] flux.
All the derived abundances using the various diagnostics are summarised in Table 3. Kobulnicky et al. (1999) report that the calibration is very uncertain for line fluxes with lower signal to noise ratio than 8:1. Given such uncertainties of the latter abundance determination, combined with the fact that the calibration involves emission lines detected in the data, and not a scaled [O ii] flux derived from B88, we rely on the oxygen abundance derived from the ratio. Thus, we find that the galaxy has a solar oxygen abundance.
4.2.2 Nitrogen
Having derived a solar oxygen abundance for G4, this information can be used to estimate the electron temperature which in turn is used to determine the N abundance. Because oxygen is the main coolant of a gaseous nebula, one expects to see a correlation between the oxygen abundance and the electron temperature of an H ii region. From a sample of extragalactic H ii regions with a large range of O abundances van Zee et al. (1998b) derive . In their 39 regions with 8.5612+log(O/H)8.76, similar to the value of G4 within errors, we find an average K. This temperature estimate is in agreement within 1 errors with the relation between and the [N ii] temperature in Thurston et al. (1996), which yields K. The uncertainty both reflects the calibration scatter (500 K) and the uncertainties of line fluxes (900 K).
Abundances of ionized nitrogen can then be derived using the relation between temperature and nitrogen to oxygen ratio (Pagel et al. 1992). Disregarding ionization corrections, the nitrogen abundance can be derived assuming (N/O) = (N+/O+), which is a valid approximation since the ionization potentials for O+ and N+ are similar. Furthermore, as shown by the models in Thurston et al. (1996), this approximation is accurate within 5%. For the emission lines from G4 we find 0.23 using the average , i.e. sub-solar, but consistent within 1 with the solar value (Holweger 2001). A similar result is obtained from the [N ii] temperature which gives 0.22. A linear relation between the O and N abundance at high oxygen abundances is observed in extragalactic H ii regions (van Zee et al. 1998a), thus a solar N/O abundance is expected for G4.
Ionic abundances can also be derived using software for analysis of emission line nebulae within the IRAF/STSDAS environment (Shaw & Dufour 1995). As inputs we use the [N ii] temperature estimated above and a low density environment ( cm-3) which is preferred from the observed [S ii] 6717,6731 line ratio. These values give where the error mostly depends on the uncertainty of the temperature. Choosing instead a density of 100 cm-3 only increases by 0.01 dex.
As a consistency check, we investigated whether the derived oxygen abundance is in agreement with calibrations to derive the (N/O) abundance ratio. Using the polynomial relations between the oxygen abundance and (N+/O+) in Kewley & Dopita (2002) yields inferred from the oxygen abundance derived from the diagnostics. The error includes the uncertainty of the chosen ionization parameter. However, as shown in Kewley & Dopita (2002) this diagnostic is relatively independent of the ionization parameter for metallicities larger than half solar, which is the case here. The derived abundance ratios using the various estimators are summarised in Table 4. From these values we conclude that the galaxy has 0.2.
4.3 Star formation rate
The derived line fluxes of emission lines can be used to derive an overall star formation rate (SFR) of the galaxy. A redshift of corresponds to a luminosity distance of 2.35 cm (760 Mpc) for the given cosmological model. Thus, the H line flux corresponds to a luminosity erg s-1. Using the relation
| (1) |
in Kennicutt (1998) to convert the flux to a SFR we find SFR = 0.490.15 M⊙. The uncertainty includes the one from the line flux and a larger additional uncertainty from the intrinsic scatter of the calibration of the conversion factor of 30%.
The H based SFR relies only on the data set of G4 presented here, while an alternative measure of the SFR can be estimated from the scaled [O ii] line flux. At the luminosity is erg s-1, which, using the conversion in Kennicutt (1998), yields SFR = M⊙. This value is furthermore in agreement with the calibration in Kewley et al. (2004), which yields SFR = M⊙. The agreement between the SFR of the galaxy derived from different calibrations gives credibility to the inferred small internal reddening in the galaxy.
5 Kinematics
From the redshift difference between the sub-DLA cloud and the galaxy found from the one-dimensional spectrum of G4, we find that the relative velocity difference is 180 km s-1. Considering that the galaxy seems to be a fairly luminous galaxy, such a velocity difference over a distance of 17.6 kpc could be consistent with rotation of a massive disk, but the orientation of the galaxy with the major axis oriented roughly north-south, while the sub-DLA cloud lies to the north-east, does not support this hypothesis. We analyse here only radial velocities but note that the proper motion of the cloud could be significant.
By fitting the strongest H emission lines with Gaussians we examine the dynamics of the galaxy G4. Because each individual spectrum is rather noisy, the fitting could only be done satisfactorily in the region around the strongest emission. In Fig. 7, velocity offsets relative to the systemic are shown as contours overlayed an image of the H emission intensity. Uncertainties of the centroids of the Gaussian fits to the strongest lines are of the order of one tenth of the spectral resolution, i.e. 0.6 Å corresponding to errors of 25 km s-1. We find evidence for a systematic velocity of to km s-1 with the rotation axis oriented roughly east-west. The point of zero-level velocity is located roughly 05 to the south of the centre of the G4 continuum emission.
In this representation the absorbing cloud towards the QSO (at coordinates 0,0) has a velocity offset of +180 km s-1 with respect to zero velocity of the H emission. We conclude that it is unlikely that the absorbing cloud is participating in a disk rotation.
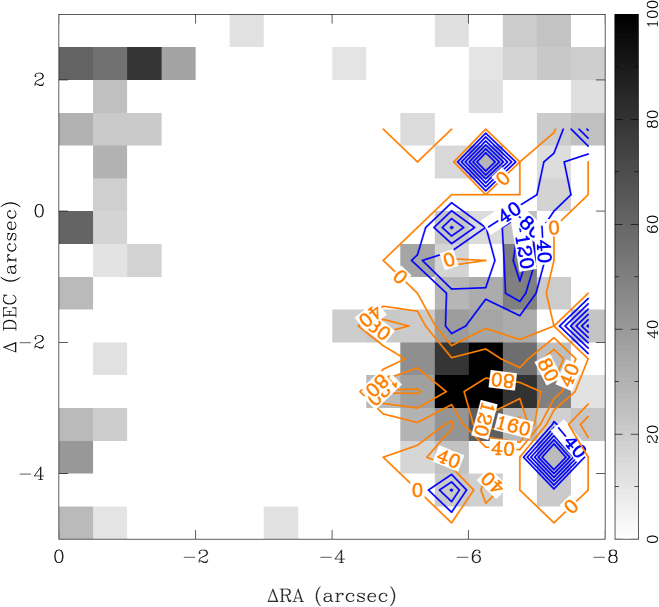
In the integral field data we measure a velocity of 160 km s-1 relative to the zero velocity contour of H at a distance of 2″ corresponding to 5.5 kpc. However, if one takes the centre of the galaxy as the true reference point, the velocity difference is 200 km s-1 over a distance of 25 (6.9 kpc) as indicated in Fig. 7. Assuming that the galaxy is viewed edge-on, the dynamical mass is M⊙, where the error is due to the uncertainty of the velocity. Because the inclination axis is not known, this value is a lower limit, while another uncertainty is due to the fact that we probably do not reach asymptotic values for the rotation curve. In any case, the estimate shows that the galaxy is a fairly massive one.
6 Discussion
Having derived various properties of the sub-DLA galaxy, we proceed by comparing them to those of other sub-DLA and DLA galaxies in the literature. We emphasize once again that there is another galaxy, G3, at the same redshift as G4 but having a larger impact parameter. G3 might contribute to the absorption seen in PHL 1226. No galaxy in Fig. 3 of B88, however, is closer to the QSO than G4, and we discuss in section 6.3 that our data allow us to exclude an emission-line galaxy with a smaller impact parameter than G4 between G4 and the QSO. As is common practice in the literature on DLA galaxies, we proceed with the assumption that the absorbing cloud belongs to the galaxy with the smallest impact parameter.
6.1 Relationship with DLAs, sub-DLAs and Mg ii systems
The derived oxygen abundance of the galaxy G4 is larger than abundances derived for high redshift sub-DLAs (Dessauges-Zavadsky et al. 2003; Péroux et al. 2003). Furthermore, compared to the nearby DLA absorber SBS~1543+594 (Schulte-Ladbeck et al. 2004), this galaxy has a higher abundance, but that goes in hand with its higher luminosity. In fact we calculate using the spectrum in Fig. 3 shifted to the rest frame and convolved with the Bessell band transmission function. G4 exhibits values which are entirely consistent with the local luminosity-metallicity relation (Kobulnicky & Koo 2000; Pilyugin et al. 2004).
On the other hand, G4 has an oxygen abundance compatible with the upper end of abundances derived for the Mg ii selected galaxies ( derived in Guillemin & Bergeron 1997). For comparison, high resolution spectra of strong Mg ii absorption systems towards a couple of QSOs at have indicated metallicities ranging from 0.1 to 1 times solar (Ding et al. 2003a, b). This could indicate a general agreement between metallicities derived using absorption lines and emission line diagnostics.
The kinematic investigation showed that the absorber is clearly not associated with a disk, but it could be part of a rotating halo as suggested for other Mg ii absorbers (Steidel et al. 2002). The galaxy G4 and its sub-DLA system could thus be similar to the sub-DLA towards Q0850+4400 (Lanzetta et al. 1997). They showed that the absorption arises at large galactocentric distance (17 kpc) and does not participate in a general disk rotation.
Alternatively, Bond et al. (2001) suggested that a substantial fraction of very strong Mg ii systems arise in superwinds from galaxies. Along similar lines, expanding superbubbles were suggested to be the explanation for metal absorption line mirror symmetries seen in the strong Mg ii absorber towards Q1331+17 (Ellison et al. 2003). A superwind from the galaxy G4 is unlikely at present time given the relatively small SFR. However, as it is comparable to an galaxy, a previous starburst could have expelled neutral gas clouds enriched by metals.
6.2 Abundance gradient effect
Metallicity studies of DLAs and sub-DLAs are trying to explain the question of what is the nature of the parent galaxy. Only in very few currently known cases, where the parent galaxy has been clearly identified, can such an investigation be carried out. Abundances derived from metal absorption lines associated with the DLAs can be compared to abundances based on emission line diagnostics for H ii regions in the galaxy. The DLA galaxy SBS 1543+594 is one example, where the impact parameter is small – in fact, the sight line to the QSO goes through the disk of the dwarf galaxy. In such a case, the inferred metallicity of the DLA cloud and the galaxy is expected to be similar. However, in the case of the G4/sub-DLA system towards PHL 1226 where the impact parameter is larger and the sub-DLA cloud possibly does not belong to the disk of the galaxy, one would expect to find lower (O/H) and (N/O) abundances of the sub-DLA cloud due to abundance gradients.
Analysing abundances in extragalactic H ii regions Vila-Costas & Edmunds (1992) and Zaritsky et al. (1994) found a large scatter in the abundance gradients for individual galaxies of a given Hubble type. They also found a tendency for more shallow gradients, expressed in dex/kpc, for early and late type spirals compared to intermediate type spirals. Locally, three face-on disk galaxies were found to have strong abundance gradients along the major axes in the outer regions of their disks (Ferguson et al. 1998, hereafter F98). Fewer studies have analysed the metallicity gradient along the minor axes of galaxies, but smaller metallicities have been found for extraplanar H ii regions compared to the core of an edge-on galaxy (Tüllmann et al. 2003). The study of H ii regions in face-on galaxies can therefore also be biased by projection effects.
The data presented here do not allow us to estimate the Hubble type of G4, making it difficult to predict an appropriate abundance gradient. If one takes the measured metallicity gradient from F98 with an average in (O/H) of dex kpc-1, the abundance of the sub-DLA cloud at 17.6 kpc is expected to be 1.6 dex lower than what we find for the G4 disk. Similarly, the average gradient in (N/O) is dex kpc-1 which implies an abundance ratio smaller by 0.9 dex. Thus one could expect 12+(O/H) = 7.1 and (N/O) = for the sub-DLA abundances. We assume that the gradients are straight lines which may not be the case (Zaritsky et al. 1994). If a low abundance of the PHL 1226 sub-DLA cloud should be confirmed by future space based spectroscopy, these values would place the sub-DLA system toward PHL 1226 among the metallicities for the currently measured high redshift DLA and sub-DLA systems measured by several authors (Pettini et al. 2002b; Lopez et al. 2002; Lopez & Ellison 2003; Centurión et al. 2003).
These approximate cloud metallicities are crude estimates since the impact parameter is a lower limit due to the unknown inclination angle, and the individual abundance gradients in F98 vary within a factor of 2. Furthermore, the lowest metallicities observed by F98 reach 12+(O/H) = 7.95, thus we are extrapolating their metallicity gradient.
6.3 Sub-DLA cloud properties
Other properties of G4 such as H luminosity, EW of H , absolute magnitude, and oxygen abundance are compatible with those of emission line field galaxies at redshifts (Kobulnicky et al. 2003). This apparently seems to be in contradiction with the spectroscopic analyses suggesting that sub-DLAs/DLAs are chemically less evolved than star forming galaxies at similar redshifts. Specifically, sub-DLAs/DLAs have sub-solar metallicity and element abundances suggesting low SFRs (Pettini et al. 2002a; Prochaska et al. 2003; Péroux et al. 2003; Dessauges-Zavadsky et al. 2003). On the other hand we can not, with the currently available data set, exclude the possibility that a galaxy less luminous than G4 closer to the line of sight towards PHL 1226 is responsible for the sub-DLA. In the integral field data presented here we find no evidence for line emission closer to the line of sight than 5″ to the west of the QSO. With the presented single pointing towards the QSO we can not say anything about the other directions.
As argued, either galaxy G4 or G3 could be responsible for the sub-DLA cloud. If the cloud were associated with G3, it too has to be associated with a halo because of the orientation of the galaxy which suggests an elongation in the east-west direction (i.e. perpendicular to the direction toward PHL 1226). Assuming that the sub-DLA cloud indeed belongs to the galaxy G4, we find a velocity difference of 180 km s-1 from the sub-DLA cloud redshift to the H velocity at the centre of G4, for which we estimate the galaxy mass M⊙. In this case, the escape velocity at a distance of 17.6 kpc is 20030 km s-1 implying that the cloud could be gravitationally bound.
Yet another possibility for the location of the sub-DLA cloud is gravitational interaction between systems. Indeed the galaxies G4 and G3 have a distance of 126 from each other corresponding to 35 kpc, so it could be an interacting system, but with the currently available observations we can not test this scenario.
7 Conclusions
Using integral field spectroscopy with PMAS we have observed the absorber G4, previously identified by Bergeron et al. (1988), toward the QSO PHL 1226 at an impact parameter of 64. This galaxy is most probably responsible for a strong Mg ii and sub-DLA absorption system at in the QSO spectrum. At the same redshift another galaxy, G3, is present. We cannot determine whether the PHL 1226 absorber belongs to galaxy G4 or G3, but concentrate on G4. Their impact parameters of 64 and 109 correspond to 18 and 29 kpc, respectively, implying that either could be responsible for the absorption given the scaling-law of Mg ii absorbers.
A strong emission line region is shown to be limited to an area of approximately 1″ in radius within the galaxy. In the spectra we find emission lines from [O iii], [N ii], [S ii] as well as Balmer lines H, H and H at the redshift 0.15950.0006. We do not find regions of emission at the same redshift closer to the QSO line of sight.
From the Balmer line ratios we find evidence of an intrinsic reddening of , i.e. consistent with 0. From the measured H line flux we derive a SFR=0.5 M⊙ yr-1.
Using the line ratio diagnostics from Pettini & Pagel (2004) we derive a solar oxygen abundance . Also a solar value of the abundance ratio (N/O) = –1.00.2 is found implying a metallicity comparable to the upper-end of metallicities for the currently known sample of Mg ii galaxies.
A kinematic analysis of the H emission line showed that the galaxy has rotational velocities of –120 to +160 km s-1 relative to the systemic redshift with the rotational axis oriented roughly east-west. The sub-DLA cloud, on the other hand, has a velocity difference of 180 km s-1 relative to the galaxy and an impact parameter of 17.6 kpc above the disk assuming that the disk is seen edge on. With such geometry and kinematics, the sub-DLA cloud is likely part of a rotating halo and possibly gravitationally bound. From relative velocity measurements we derive a kinematic mass of 6 M⊙, which corresponds to a fairly massive galaxy. The absolute magnitude is and which is consistent with the mass-luminosity relation for spiral galaxies (Forbes 1992).
With future UV space-based spectroscopy it will be possible to compare the metallicity of the sub-DLA cloud towards PHL 1226 with abundances derived for the galaxy, which is necessary in order to understand the relation between the absorption lines in QSO spectra and the galaxies responsible for them. If there is a difference in metallicity in line with the metallicity gradients observed in local disk galaxies, we expect that the properties of the sub-DLA cloud will be similar to those of high redshift DLA and sub-DLA systems. This is an intriguing prospect which could suggest that the specific sight line through the galaxy responsible for the DLA or sub-DLA cloud has important consequences on the derived properties of the cloud.
Acknowledgements.
L. Christensen acknowledges support by the German Verbundforschung associated with the ULTROS project, grant no. 05AE2BAA/4. R. Schulte-Ladbeck is thankful for funding from HST archival grant no. 10282. S. F. Sánchez acknowledges the support from the Euro3D Research Training Network, grant no. HPRN-CT2002-00305. K. Jahnke and L. Wisotzki acknowledge a DFG travel grant under Wi 1389/12-1.References
- Asplund et al. (2004) Asplund, M., Grevesse, N., Sauval, A. J., Allende Prieto, C., & Kiselman, D. 2004, A&A, 417, 751
- Becker (2002) Becker, T. 2002, PhD thesis, Astrophysikalisches Institut Potsdam, Germany
- Bergeron & Boisse (1991) Bergeron, J. & Boisse, P. 1991, A&A, 243, 344
- Bergeron et al. (1988) Bergeron, J., Boulade, O., Kunth, D., et al. 1988, A&A, 191, 1, (B88)
- Bond et al. (2001) Bond, N. A., Churchill, C. W., Charlton, J. C., & Vogt, S. S. 2001, ApJ, 562, 641
- Brocklehurst (1971) Brocklehurst, M. 1971, MNRAS, 153, 471
- Centurión et al. (2003) Centurión, M., Molaro, P., Vladilo, G., et al. 2003, A&A, 403, 55
- Charlton & Churchill (1998) Charlton, J. C. & Churchill, C. W. 1998, ApJ, 499, 181
- Chen & Lanzetta (2003) Chen, H. & Lanzetta, K. M. 2003, ApJ, 597, 706
- Christensen et al. (2004) Christensen, L., Sanchez, S. F., Jahnke, K., et al. 2004, A&A, 417, 487
- Denicoló et al. (2002) Denicoló, G., Terlevich, R., & Terlevich, E. 2002, MNRAS, 330, 69
- Dessauges-Zavadsky et al. (2003) Dessauges-Zavadsky, M., Péroux, C., Kim, T.-S., D’Odorico, S., & McMahon, R. G. 2003, MNRAS, 345, 447
- Ding et al. (2003a) Ding, J., Charlton, J. C., Bond, N. A., Zonak, S. G., & Churchill, C. W. 2003a, ApJ, 587, 551
- Ding et al. (2003b) Ding, J., Charlton, J. C., Churchill, C. W., & Palma, C. 2003b, ApJ, 590, 746
- Djorgovski et al. (1996) Djorgovski, S. G., Pahre, M. A., Bechtold, J., & Elston, R. 1996, Nature, 382, 234
- Ellison et al. (2004) Ellison, S., Kewley, L., & Mallén-Ornelas, G. 2004, MNRAS submitted
- Ellison et al. (2003) Ellison, S. L., Mallén-Ornelas, G., & Sawicki, M. 2003, ApJ, 589, 709
- Ferguson et al. (1998) Ferguson, A. M. N., Gallagher, J. S., & Wyse, R. F. G. 1998, AJ, 116, 673
- Filippenko (1982) Filippenko, A. V. 1982, PASP, 94, 715
- Fitzpatrick (1999) Fitzpatrick, E. L. 1999, PASP, 111, 63
- Forbes (1992) Forbes, D. A. 1992, A&AS, 92, 583
- Fynbo et al. (1999) Fynbo, J. U., Møller, P., & Warren, S. J. 1999, MNRAS, 305, 849
- Guillemin & Bergeron (1997) Guillemin, P. & Bergeron, J. 1997, A&A, 328, 499
- Holweger (2001) Holweger, H. 2001, in AIP Conf. Proc. 598, ed. R. F. Wimmer-Schweingruber, 23
- Kennicutt (1998) Kennicutt, R. C. 1998, ARA&A, 36, 189
- Kewley et al. (2004) Kewley, L., Geller, M. J., & Jansen, R. A. 2004, AJ, in press
- Kewley & Dopita (2002) Kewley, L. J. & Dopita, M. A. 2002, ApJS, 142, 35
- Kobulnicky et al. (1999) Kobulnicky, H. A., Kennicutt, R. C., & Pizagno, J. L. 1999, ApJ, 514, 544
- Kobulnicky & Koo (2000) Kobulnicky, H. A. & Koo, D. C. 2000, ApJ, 545, 712
- Kobulnicky et al. (2003) Kobulnicky, H. A., Willmer, C. N. A., Phillips, A. C., et al. 2003, ApJ, 599, 1006
- Lacy et al. (2003) Lacy, M., Becker, R. H., Storrie-Lombardi, L. J., et al. 2003, AJ, 126, 2230
- Lanzetta et al. (1997) Lanzetta, K. M., Wolfe, A. M., Altan, H., et al. 1997, AJ, 114, 1337
- Le Brun et al. (1993) Le Brun, V., Bergeron, J., Boisse, P., & Christian, C. 1993, A&A, 279, 33
- Le Brun et al. (1997) Le Brun, V., Bergeron, J., Boisse, P., & Deharveng, J. M. 1997, A&A, 321, 733
- Lopez & Ellison (2003) Lopez, S. & Ellison, S. L. 2003, A&A, 403, 573
- Lopez et al. (2002) Lopez, S., Reimers, D., D’Odorico, S., & Prochaska, J. X. 2002, A&A, 385, 778
- Møller et al. (2004) Møller, P., Fynbo, J. U., & Fall, S. M. 2004, A&A in press.
- Møller & Warren (1993) Møller, P. & Warren, S. J. 1993, A&A, 270, 43
- Møller et al. (2002) Møller, P., Warren, S. J., Fall, S. M., Fynbo, J. U., & Jakobsen, P. 2002, ApJ, 574, 51
- Nissen et al. (2004) Nissen, P. E., Chen, Y. Q., Asplund, M., & Pettini, M. 2004, A&A, 415, 993
- Péroux et al. (2003) Péroux, C., Dessauges-Zavadsky, M., D’Odorico, S., Kim, T., & McMahon, R. G. 2003, MNRAS, 345, 480
- Pagel et al. (1979) Pagel, B. E. J., Edmunds, M. G., Blackwell, D. E., Chun, M. S., & Smith, G. 1979, MNRAS, 189, 95
- Pagel et al. (1992) Pagel, B. E. J., Simonson, E. A., Terlevich, R. J., & Edmunds, M. G. 1992, MNRAS, 255, 325
- Pettini et al. (2002a) Pettini, M., Ellison, S. L., Bergeron, J., & Petitjean, P. 2002a, A&A, 391, 21
- Pettini et al. (1999) Pettini, M., Ellison, S. L., Steidel, C. C., & Bowen, D. V. 1999, ApJ, 510, 576
- Pettini & Pagel (2004) Pettini, M. & Pagel, B. E. J. 2004, MNRAS, 348, L59
- Pettini et al. (2002b) Pettini, M., Rix, S. A., Steidel, C. C., et al. 2002b, ApJ, 569, 742
- Pilyugin et al. (2004) Pilyugin, L. S., Vílchez, J. M., & Contini, T. 2004, A&A in press.
- Prochaska et al. (2003) Prochaska, J. X., Gawiser, E., Wolfe, A., Castro, S., & Djorgovski, S. G. 2003, ApJL, 595, L9
- Rao et al. (2003) Rao, S. M., Nestor, D. B., Turnshek, D. A., et al. 2003, ApJ, 595, 94
- Roth et al. (2000) Roth, M. M., Bauer, S., Dionies, F., et al. 2000, in Proc. SPIE, Vol. 4008, 277–288
- Sánchez (2004) Sánchez, S. F. 2004, AN, 325, 167
- Schlegel et al. (1998) Schlegel, D. J., Finkbeiner, D. P., & Davis, M. 1998, ApJ, 500, 525
- Schulte-Ladbeck et al. (2004) Schulte-Ladbeck, R. E., Rao, S. M., Drozdovsky, I. O., et al. 2004, ApJ, 600, 613
- Shaw & Dufour (1995) Shaw, R. A. & Dufour, R. J. 1995, PASP, 107, 896
- Steidel et al. (2002) Steidel, C. C., Kollmeier, J. A., Shapley, A. E., et al. 2002, ApJ, 570, 526
- Steidel et al. (1994) Steidel, C. C., Pettini, M., Dickinson, M., & Persson, S. E. 1994, AJ, 108, 2046
- Tüllmann et al. (2003) Tüllmann, R., Rosa, M. R., Elwert, T., et al. 2003, A&A, 412, 69
- Thurston et al. (1996) Thurston, T. R., Edmunds, M. G., & Henry, R. B. C. 1996, MNRAS, 283, 990
- Turnshek et al. (2001) Turnshek, D. A., Rao, S., Nestor, D., et al. 2001, ApJ, 553, 288
- van Dokkum (2001) van Dokkum, P. G. 2001, PASP, 113, 1420
- van Zee et al. (1998a) van Zee, L., Salzer, J. J., & Haynes, M. P. 1998a, ApJ, 497, L1
- van Zee et al. (1998b) van Zee, L., Salzer, J. J., Haynes, M. P., O’Donoghue, A. A., & Balonek, T. J. 1998b, AJ, 116, 2805
- Veilleux & Osterbrock (1987) Veilleux, S. & Osterbrock, D. E. 1987, ApJS, 63, 295
- Vila-Costas & Edmunds (1992) Vila-Costas, M. B. & Edmunds, M. G. 1992, MNRAS, 259, 121
- Wiese et al. (1966) Wiese, W. L., Smith, M. W., & Glennon, B. M. 1966, Atomic transition probabilities. Vol.: Hydrogen through Neon. A critical data compilation (NSRDS-NBS 4, Washington, D.C.: US Department of Commerce, National Buereau of Standards, 1966)
- Wolfe et al. (1986) Wolfe, A. M., Turnshek, D. A., Smith, H. E., & Cohen, R. D. 1986, ApJS, 61, 249
- Zaritsky et al. (1994) Zaritsky, D., Kennicutt, R. C., & Huchra, J. P. 1994, ApJ, 420, 87