H i deficiency in groups : what can we learn from Eridanus
Abstract
The H i content of the Eridanus group of galaxies is studied using the GMRT observations and the HIPASS data. A significant H i deficiency up to a factor of is observed in galaxies in the Eridanus group. The deficiency is found to be directly correlated with the projected galaxy density and inversely correlated with the line-of-sight radial velocity. It is suggested that the H i deficiency is due to tidal interactions. An important implication is that significant evolution of galaxies can take place in a group environment.
keywords:
galaxy – ISM(HI): galaxy – groups: individual – Eridanus1 Introduction

Spiral galaxies in the cores of clusters are known to be H i deficient compared to their field counterparts (Davies & Lewis 1973, Giovanelli & Haynes 1985, Cayatte et al. 1990, Bravo-Alfaro et al. 2000). Several gas-removal mechanisms have been proposed to explain the H i deficiency in cluster galaxies. There are convincing results from both the simulations and the observations that ram-pressure stripping can be active in galaxies which have crossed the high ICM (Intra Cluster Medium) density region in the cores of clusters (Vollmer et al. 2001, van Gorkom 2003). However, it is not clear that all H i deficient galaxies have crossed the core. “Galaxy harassment” can also affect outer regions of galactic disks as a result of repetitive fast encounters of galaxies in clusters (Moore et al. 1998). There can be other scenarios where galaxies can become gas deficient, e.g., thermal evaporation & viscous stripping (Cowie & Songaila 1977, Nulsen 1982, Sarazin 1988) and removal of the hot gas from galaxy halo (“galaxy strangulation”; Larson et al. 1980). It turns out that no single gas-removal mechanism can explain the global H i deficiency in a cluster environment (e.g., Magri et al. 1988). Some of the parameters driving these mechanisms are not known well, e.g., thermal conductivity of the ICM, amount of hot gas in halos etc. These difficulties have led one to speculate that cluster galaxies were perhaps H i deficient even before they fall in to the cluster.
Several clusters have been imaged in H i . However, only limited H i data exist for large groups. For example, Ursa-Major group which has no elliptical and only a few S0’s shows no significant H i deficiency (Verheijen 2001). Hickson Compact Groups (HCGs) have been studied in H i and some of them show H i deficiency (Verdes-Montenegro et al. 2001). However, small number of galaxies in HCGs makes this sample statistically insignificant to make any firm conclusion or to understand the mechanism deriving the galaxy evolution. Here, we present an H i study of the large ( galaxies) nearby ( Mpc) Eridanus group of galaxies. The properties of the group are described in the next section. Both the GMRT data and the HIPASS (H i Parkes All Sky Survey) data are used. The details of the GMRT observations, data reduction and analyses are presented in Omar & Dwarakanath (2004a). The full description of this work is presented in the Ph.D. thesis of Omar (2004). A detailed discussion on the H i content of the Eridanus group is given in Omar & Dwarakanath (2004b). Here, we discuss the results briefly.
| Properties | Virgoa | Fornaxb | Eridanusc | Ursa-Majord |
|---|---|---|---|---|
| Distance (Mpc) | 21 | 20 | 23 | 21 |
| No. of E+S0 | 71 | 23 | 36 | 9 |
| No. of S + Irr | 123 | 17 | 42 | 53 |
| Vel. dispersion ( km s-1 ) | 760 | 350 | 240 | 150 |
| log X-ray luminosity (erg s-1) | 43.5 | 41.7 | 41.4 | – |
| Proj. galaxy density (Mpc-2) | 50 | 70 | 8 | 3 |
| Notes - (a): Inner 6∘ ( Mpc) region, (b): Inner 2∘.4 ( Mpc) region, (c): Inner 9∘ ( Mpc) region, (d): Inner 15∘ ( Mpc) region. The table is from Omar et al. (2004). | ||||
2 The Eridanus group
The Eridanus group was identified as a moderate size cluster in a large scale filamentary structure near km in the Southern Sky Redshift Survey (SSRS; da Costa et al. 1988). This filamentary structure, which is the most prominent in the southern sky, extends for more than 20 Mpc. The Fornax cluster and the Dorado group of galaxies also belong to this structure. Willmer et al. (1989) grouped the galaxies in the Eridanus region in to different sub-groups. They concluded that each sub-group is a bound structure and the entire group is also gravitationally bound with a dynamical mass greater than M⊙.
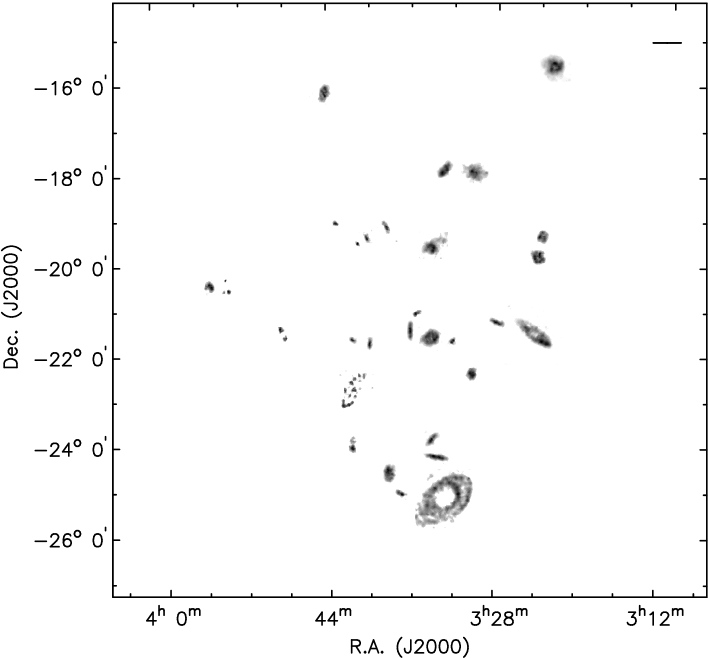
Most of the Eridanus galaxies are concentrated in the velocity range km . The distance to the group is estimated as Mpc from the surface brightness fluctuation measurements (Tonry et al. 2001). The locations of galaxies in the Eridanus group are plotted in Fig. 1 where it can be seen that the galaxies are not distributed uniformly in space. The group appears to be made of different sub-groups. The sub-clustering is quite prominent in the inner region. The sub-group NGC 1407 (cf. Willmer 1989; marked in Fig 1) has its brightest member as an elliptical galaxy (NGC 1407; E0) which is also the brightest in the entire group. NGC 1407 has diffuse X-ray emission ( erg s-1) surrounding it. NGC 1407 sub-group is the richest in early types, most of them being S0’s. The population mix of (E+S0) and (Spirals+Irr) in the NGC 1407 sub-group is 70% & 30% respectively. The overall population mix in the Eridanus group is 30% (E+S0) & 70% (Sp +Irr).
There is no appreciable difference in the velocities over which the early types and the late type galaxies are distributed. This is contrary to that seen in clusters like Virgo and Coma where spirals have much flatter velocity distribution and E/S0’s have nearly a Gaussian distribution. In Tab. 1, the properties of the Eridanus group are compared with the two clusters Virgo and Fornax and one loose group Ursa-Major. It appears that the Eridanus group forms a system which is intermediate between a loose group (e.g., Ursa-Major) and a cluster (e.g, Virgo, Fornax). It is interesting to note that the population mix in the NGC 1407 sub-group is similar to that seen in evolved clusters.
3 Results


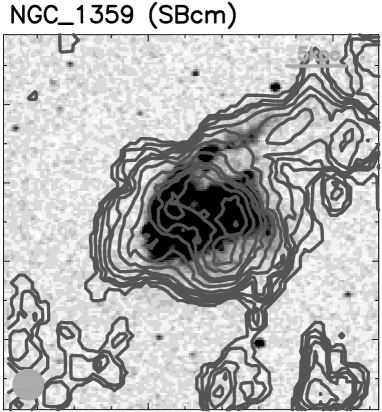
The galaxies in the Eridanus group were observed in the H i 21cm-line with the GMRT (Omar & Dwarakanath 2004a). A collage of the GMRT H i images of the Eridanus galaxies is shown in Fig. 2. The data from the HIPASS (Meyer et al. 2004) were also used. The final sample consisted of a total of 63 H i detected galaxies. The deficiency parameter (cf. Haynes & Giovanelli 1984, HG84) estimated using / ratio was used to obtain the H i deficiency in the Eridanus galaxies. The ratio / for each Eridanus galaxy is compared with the mean value of / obtained by HG84 for the isolated galaxies of similar types. A significant positive difference in the two ratios indicates the H i deficiency (def. = ). The H i deficiency up to a factor of ( in log units in Fig. 3) is seen in the Eridanus galaxies. In Fig. 3, H i deficiency is plotted against the local projected galaxy density and the line-of-sight radial velocities of galaxies in the group. The projected galaxy density is estimated within a circular region of radius 0.5 Mpc. It can be seen that in higher galaxy density ( Mpc-2) regions, majority of galaxies are H i deficient while in lower galaxy density regions both normal and deficient galaxies are present. The H i deficiency appears to be increasing with decreasing line-of-sight radial velocity.
4 Discussion
The ram-pressure in the Eridanus group is one to two orders of magnitude lower compared to that in clusters (Omar $ Dwarakanath 2004b). Therefore, ram-pressure stripping is of a little importance in the Eridanus galaxies. The trends in Fig. 3 are suggestive of the H i deficiency being due to tidal interactions. Since galaxies in higher galaxy density regions will have higher probability of tidal encounters, it explains the increasing trend of deficiency with increasing galaxy density. The inverse correlation between the deficiency and the radial velocity can be qualitatively understood under the framework of tidal interactions. The perturbation due to tidal interactions will be maximum for slow encounters. In the Eridanus group where the distribution of galaxies is peaked near the mean velocity of the group (Omar 2004) and falls off nearly as a Gaussian at higher relative velocities, galaxies with velocities near the mean velocity of the group will have a higher probability of interacting with a companion with a lower velocity difference. Both gas and stars will be removed from galaxies as a result of tidal forces. It was noticed that galaxies with larger optical diameters are predominantly in the lower galaxy density regions (Omar & Dwarakanath 2004b). The Eridanus galaxies often show signatures of tidal interactions, e.g., shrunken H i disks, warps, asymmetric H i disk, H i rings, tidal tails, extraplannar gas, kinematical lopsidedness etc. The GMRT H i image of one such galaxy having both the gaseous and the optical tidal tail is shown in Fig. 4. More images can be found in Omar & Dwarakanath (2004b).
If clusters are built via mergers of small groups, the H i deficiency in the Eridanus group indicates that not all H i deficiency in cluster galaxies originates in the cluster environment. Alternatively, a significant fraction of the H i deficiency in cluster galaxies could have originated in the group environment. The implications are discussed in detail in Omar & Dwarakanath (2004b).
Acknowledgments
This paper is based on the talk presented in the meeting at NCRA, Pune held during March, 2004 on the occasion of 75th birthday of Prof. Govind Swarup. The work presented here is based on the Ph.D. thesis of A. Omar (2004). We thank the staff of the GMRT who made observations possible. This research has made use of the HI Parkes All Sky Survey (HIPASS) data.
References
- [1] Bravo-Alfaro, H., Cayatte, V., van Gorkom, J. H., & Balkowski, C. 2000, Astron. J., 119, 580
- [2] Cayatte, V., van Gorkom, J. H., Balkowski, C., & Kotanyi, C. 1990, Astron. J., 100, 604
- [3] Cowie, L. L., & Songaila, A. 1977, Nature, 266, 501
- [4] da Costa, L.N., Pellegrini, P.S., Sargent, W.L. et al. 1988, Astrophys. J., 327, 544
- [5] Davies, R. D. & Lewis, B. M. 1973, Mon. Not. Roy. Astron. Soc., 165, 231
- [6] Giovanelli, R., & Haynes, M. P. 1985, Astrophys. J., 292, 404
- [7] Haynes, M. P., & Giovanelli, R. 1984, Astron. J., 89, 758
- [8] Larson R.B. Tinsley, B.M., & Calswell, C.N. 1980,Astrophys. J., 237, 692
- [9] Magri, C., Haynes, M. P., Forman, W., Jones, C., & Giovanelli, R. 1988, Astrophys. J., 333, 136
- [10] Meyer, M.J., Zwaan, M.A., Webster, R.L. et al. 2004, Mon. Not. Roy. Astron. Soc., 350, 1195
- [11] Moore, B., Lake, G., & Katz, N. 1998, Astrophys. J., 495, 139
- [12] Nulsen, P.E.J. 1982, Mon. Not. Roy. Astron. Soc., 198, 1007
- [13] Omar, A. 2004, Ph.D. Thesis, Jawaharlal Nehru University, New Delhi.
- [14] Omar, A. & Dwarakanth K. S. 2004a, J. Astroph. Astron., submitted
- [15] Omar A. & Dwarakanth K. S. 2004b, J. Astroph. Astron., submitted
- [16] Sarazin, C.L., 1998, In X-ray emission from clusters of galaxies, Cambridge Astroph. Series, University Publications.
- [17] Tonry, J.L. et al. 2001, Astrophys. J., 546, 681
- [18] van Gorkom, J.H. 2003, In clusters of galaxies: Probes of cosmological structure and galaxy formation, ed. Mulchaey, J.S et al., (Carnegie Obs. Astroph. Ser.), 3
- [19] Verdes-Montenegro, L., Yun, M. S., Williams, B. A., Huchtmeier, W. K., Del Olmo, A., & Perea, J. 2001, Astron. Astrophys., 377, 812
- [20] Verheijen, M.A.W, 2001, In gas and galaxy evolution, ed. Hibbard, J.E. et al., ASP conf. series, 240, 573
- [21] Vollmer, B., Cayatte, V., Balkowski, C., & Duschl, W. J. 2001, Astrophys. J., 561, 708
- [22] Willmer, C.N.A., Focardi, P., da Costa, L.N., & Pellegrini, P.S. 1989, Astron. J., 98, 1531