1–8
Strong lensing analysis of A1689 from deep ACS images
Abstract
ACS observations of massive lensing clusters permit an order of magnitude increase in the numbers of multiply-lensed background galaxies identified behind a given cluster. We have developed a code to take the pixels belonging to any given image and generate counter-images with full resolution, so that multiple systems are convincingly and exhaustively identified. Over 130 images of 35 multiply lensed galaxies are found behind A1689, including many radial arcs and also tiny counter-images projected on the center of mass. The derived mass profile is found to flatten steadily towards the center, like an NFW profile, with a mean slope , over the range kpc/h, which is somewhat steeper than predicted for such a massive halo. We also clearly see the expected geometric increase of bend angles with redshift, however, given the low redshift of A1689, , the dependence on cosmological parameters is weak, but using higher redshift clusters from our GTO program we may derive a more competitive constraint.
1 Introduction
The ACS Guaranteed Time Observations (GTO) program includes deep observations of several massive, intermediate redshift galaxy clusters. Our goals are to determine the distribution of matter in clusters, to place new constrains to the cosmological parameters and also a study of the distant lensed galaxies themselves, taking advantage of their generally large magnifications.
This work concentrates on A1689, which has the largest known Einstein radius of all the massive lensing clusters, of approximately 50” in radius, based on the radius of curvature of a giant low surface-brightness arc. Relatively little work on this cluster has been carried out with HST, and the field of WFPC2 is too small to cover the full area interior to the Einstein radius. Although no actual multiple images had been identified prior to this investigation, we were confident that the exceptional depth and high resolution of ACS would lead to the detection of many sets of multiple images, more than possible around other clusters, by virtue of the large Einstein radius.
See Broadhurst et al. (2004) for a comprehensive description of this work.
2 Observations
The deep, ACS observations of A1689 are split into 4 filters, allowing reliable photometric redshift information. In total we imaged 4 orbits in () and (), 3 in () and 7 in (). We reach magnitudes for point sources (inside a FWHM aperture) of in the band, in the and bands, and in the band.
3 Mass modeling
The mass model is constructed as follows. We start by assuming an initial mass model for the cluster, which follows the light of the cluster-member galaxies. We then identify some sets of multiply-lensed images, by eye, and force the mass model to reproduce these images, by changing its parameters. We then use this model to help identify additional counter images of the multiple images found by eye and also new sets of multiple images, which are then incorporated into the model to improve it in an iterative manner.
3.1 Starting point
We assign a power law profile to each cluster-member galaxy, assuming , making sure that the mass extends way beyond the boundaries of the ACS image. This is important, since the deflection field that we wish to construct results from an integration over the whole mass field. The resulting mass distribution is round on a large scale, but with small scale structure caused by the galaxies. We continue by breaking the mass model into two components. We fit a low order cubic spline, to get the smooth component, which represents the dark matter. We than subtract the smooth component from the initial mass field, and get the galactic residuals, which we refer to as the lumpy component. While iterating the model, we allow for the smooth component to change in shape, using a small number of parameters, while the lumpy component is allowed to change only in amplitude, corresponding approximately to varying the of the galaxy contribution.
3.2 Multiple image identification
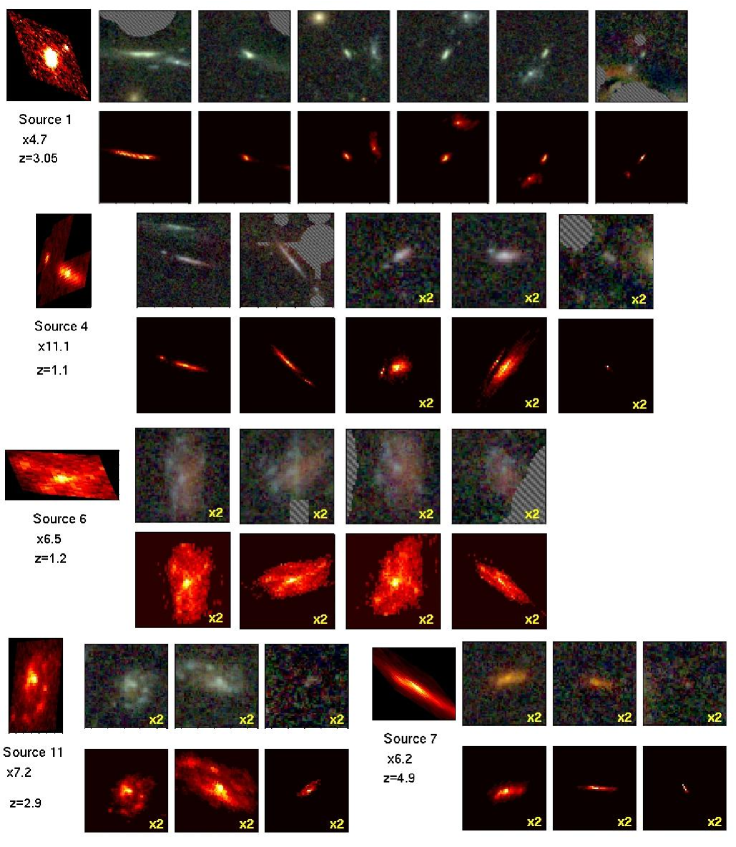
Some sets of multiply lensed images are detectable by eye. These are needed in order to put initial constraints on the model, and improve its accuracy, before using it to predict additional lensed galaxies. Some examples of such images are presented in Figure 1. The high spatial resolution and the depth of the ACS data provide morphological details and internal colour variations which are repeated in all the counter images of the same source (e.g., sources 4, 6 and 11) so that the identification of counter images is usually unique. In most of the systems that were discovered by eye, at least one more additional counter image was predicted by the model and then verified visually.
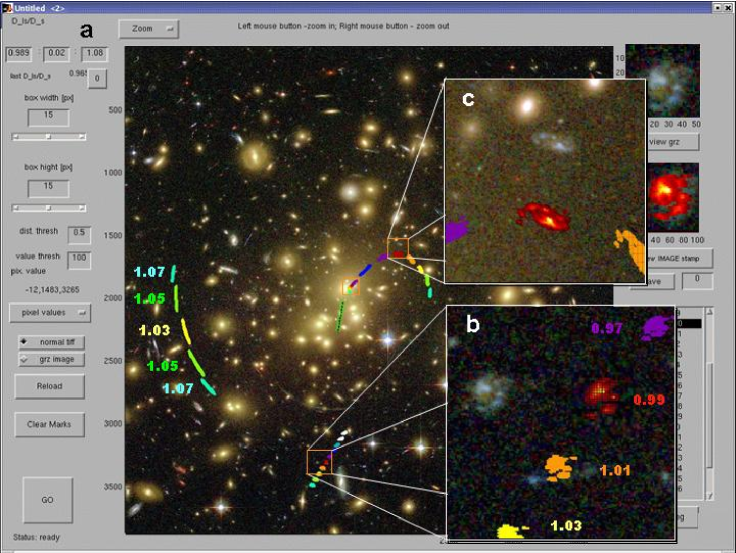
In order to detect less obvious sets of images, we use a new interactive software, which we wrote in Matlab environment (Fig 2). This software uses the last-iteration deflection field as an input, and based on it, predicts the locations and morphology of counter images for a desired range of distance scales (). The image identification is done interactively. Using a graphic user interface, one can click on a suspected image. The software then calculates the location and morphology of the galaxy in the source plane, for a given , using the deflection field and the values of the pixels which belong to the galaxy. It continues by scanning the image plane for pixels which are de-lensed to the same place in the source plane, assigning them with the values of pixels which are de-lensed to the same location in the source-plane image, thus conserving surface brightness.
The result of this process, is a set of predicted counter images, corresponding to the choice of . The next step, is to find real images in the vicinity of the predicted images. Once such image is detected, it can be verified as a counter image, by the morphology, parity and internal colours.
In order to account for the unknown source distances, one can enter a desired range of and the software will produce a sequence of counter images projected on the observed data frame. Such sequences of images are seen in Figure 2 as extended trails and are colour-coded to represent different relative distances.
In many cases, the model also predicts very faint counter images, which lay close to the center of the cluster. These images are harder to verify, and in fact would be impossible to detect without the help of the model, as they are out-shined by the light of the cluster member galaxies and lack internal structure. In such cases, we use an image in which the bright elliptical galaxies are subtracted. We also look for sets of nearby galaxies, and make sure that their relative locations in the innermost parts of the cluster agree with the predictions of the model.
Whenever several systems of multiply-lensed galaxies are identified, we fit the model again, and continue to look for more systems with the improved model.
4 Results
4.1 Multiple image systems
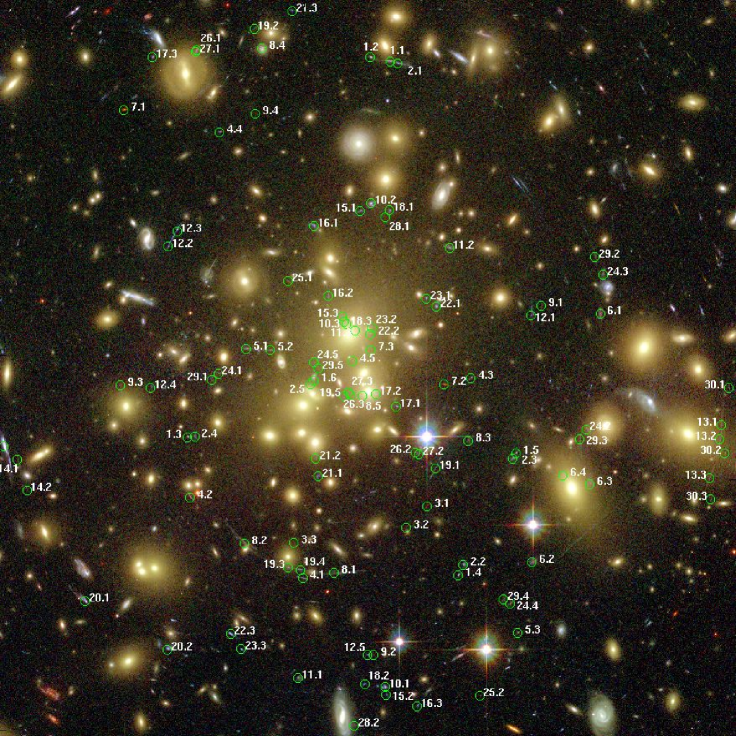
Here we show the first 106 images corresponding to 30 systems of lensed galaxies (Fig. 3). The images are well spread around the cluster, going all the way into its innermost regions, allowing the construction of a very detailed mass model. At the center of the cluster we detect several radial arcs and many sets of images on both sides of the radial critical curve, tracing its location in great detail.
Most of those images were detected with the help of the model, in an iterative process of improving the model upon the detection of additional images. Photometric redshifts are estimated for all images (Benítez, 2000), and usually these agree well, with the exception of very faint counter-images, or in cases where there is light contamination from a neighboring cluster galaxy. The individual multiple-image systems are thoroughly described in Broadhurst et al. (2004).
4.2 Conclusions
We calculate the surface mass distribution in A1689 and deduce the magnification. The shape of the mass distribution is approximately circular in projection and much rounder than the clumpy spatial distribution of luminous cluster galaxies. This argues against this cluster being a lengthly projected filament along the line of sight, though does not rule out a favorable alignment of a triaxial potential boosting the observed surface density.
The best fitting mass profile is a good fit to an NFW function, with relatively high concentration (, kpc/h). The magnification derived from this profile reproduces the locations of the critical curves, and the central magnification is accurately followed.
We clearly detect the purely geometric increase of bend-angles with redshift, by comparing the redshift of each source to the distance scale calculated by the model by minimization in the image plane. The dependence on the cosmological parameters is weak due to the proximity of A1689, , constraining the locus, . Higher redshift clusters must be examined in order to constrain the cosmological parameters with more accuracy. This consistency with standard cosmology provides independent support for our model, since the redshift information is not used in generating the best fit model. Similarly, the relative fluxes of the multiple images are reproduced well by our best fitting lens model.
The mass to light ratio of A1689 is high, , 30% larger than any other well-studied cluster, continuing the general trend of higher M/L with increasing mass. This large value means that the stellar mass is a negligible contribution to the overall mass, even in the center , where the light is more concentrated than the mass.
5 Summary
We have obtained the highest quality images of a lensing cluster to date, surpassing previous work both in terms of depth and spatial resolution and have been rewarded with an order of magnitude increase in the numbers of multiply lensed galaxies identified around an individual cluster. This substantial improvement has permitted detailed modeling of the cluster, which for the first time allows us to trace a radial critical curve and to measure the mass profile of the cluster all the way to the center, inside the radial critical curve, where many small counter-images are found projected on the center of mass.
References
- [Benítez (2000)] Benítez, N. 2000 ApJ 536, 571.
- [Broadhurst et al. (2004)] Broadhurst, T.J. et al. 2004 ApJ, accepted, astro-ph/0409132
- [Frye, Broadhurst, & Benítez (2002)] Frye, B., Broadhurst, T.J., & Benítez, N. 2002, ApJ 568, 558