Observations of HI 21cm absorption by the neutral IGM during the epoch of re-ionization with the Square Kilometer Array
Abstract
We explore the possibility of detecting HI 21cm absorption by the neutral intergalactic medium (IGM) toward very high redshift radio sources, and by gas associated with the first collapsed structures, using the Square Kilometer Array at low frequency (100 to 200 MHz). The epoch considered is between the time when the first ionizing sources form and when the bulk of the neutral IGM becomes ionized. Expected IGM absorption signal includes absorption by the mean neutral IGM (the radio ’Gunn-Peterson’ effect’), plus deeper, narrow lines (, a few km s-1) arising in mild density inhomogeneities with typical values of cosmic overdensity , precisely the structures that at later times give rise to the Ly forest (the ‘21cm forest’). Absorption can also arise in gas associated with collapsed structures (), including ’minihalos’ ( M⊙) and protodisks ( M⊙). We consider SKA sensitivity limits and the evolution of radio source populations, and conclude that it is reasonable to hypothesize the existence of an adequate number of high- radio sources against which such absorption studies could be performed, provided that reionization occurs at . Lastly, we discuss the possibility of ‘line confusion’ due to radio recombination lines arising in the ionized IGM. Overall, SKA absorption studies should provide a fundamental probe of the thermal state of the neutral IGM during the epoch of reionization, as well as critical insight into the process and sources of reionization.
1 Introduction
The epoch of reionization (EoR) presents a key benchmark in the study of cosmic structure formation, signaling the time when the first luminous structures form in the cosmos. Furlanetto et al. (this volume) introduce the physical processes and questions involved in reionization, the current observational constraints on reionization (Gunn-Peterson absorption troughs and large scale polarization of the CMB), and the unique capability of the SKA to study the neutral intergalactic medium (IGM) via HI 21cm emission observations (or absorption against the CMB). HI 21cm emission observations probe large scale structure in the IGM ( M⊙), including structure in density, excitation temperature, and fractional ionization.
In this chapter we describe observations aimed at studying HI 21cm absorption toward the first radio sources within the EoR. The neutral IGM is opaque at rest wavelengths shorter than Ly such that study of objects, and the IGM, during this age will be limited to observations at wavelengths longer than about 1m. However, the weakness of the magnetic hyperfine transition makes the IGM translucent to HI 21cm absorption. Column density sensitivity for absorption studies is set only by the surface brightness of the background source, thereby allowing absorption studies to probe to orders-of-magnitude lower ’masses’ than can be detected in 21cm emission.
2 21cm absorption by the neutral IGM
2.1 Simulations of the IGM during reionization
Carilli et al. [2] present a detailed study of HI 21cm absorption by the neutral IGM during reionization. We review their results herein. Their analysis relies on the simulations of Gnedin [11]. These simulations include the three main physical ingredients required to model neutral hydrogen absorption in the redshifted 21 cm line: inhomogeneous small-scale structure of the universe, radiative transfer, and accurate treatment of the level populations in atomic hydrogen. The simulations are normalized in such a way as to reproduce both the observed star formation rate at and the observed evolution of the mean transmitted flux in the spectra of two quasars. We can therefore expect that these simulations are at least representative of the physical processes involved, with the caveat that some of the details, such as the exact redshift of reionization, or assumptions about radiative transfer, remain uncertain. In particular, these simulations have not been adjusted for possible early reionization, as suggested by the recent WMAP results [9].
A fundamental parameter in predicting the HI 21cm absorption characteristics of the IGM is the behavior of the excitation temperature of the HI (the ‘spin temperature’, ). Tozzi et al. [17] showed that during the EoR the excitation temperature is likely to be in excess of the CMB temperature due to the standard Wouthuysen-Field effect, i.e. resonant scattering of the ambient Ly photons emitted by the first ionizing sources (at higher densities collisions with electrons and neutral atoms also play a role). As the structure develops, the kinetic temperature increases both due to shock heating of the gas in high density regions and X-ray heating in low density regions. However, as the Ly excitation rate does not increase very fast with redshift, the spin temperature:
| (1) |
(here is the so-called “thermalization “ rate [13, 17]), increases at a slower rate, because the spin temperature becomes independent of the kinetic temperature when the latter gets very large. The 21 cm optical depth therefore depends on the evolution of the kinetic temperature of the IGM, which in turn depends on processes such as shock heating, the ionization history, and the X-ray background. The particular simulation described here is thus one example of the possible 21 cm forest evolution.
Figure 1 shows physical quantities along a representative line of sight through the simulation box at three different redshifts (), with redshift indicated by the line color. The top panel shows the HI 21cm transmissivity of the neutral IGM at high velocity resolution (0.5 kHz km s-1 at 150 MHz). The abscissa for this panel is velocity. The middle panel shows the kinetic and spin temperatures of the gas. The bottom panel shows the neutral hydrogen density structure. The abscissa in these two cases is the corresponding comoving physical scale.
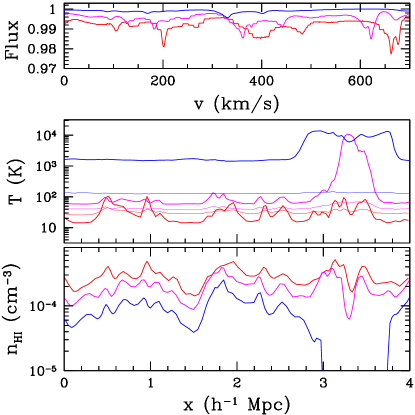
Most of the variations in transmissivity seen in Figure 1 are due to mild density inhomogeneities with typical values of the cosmic overdensity , precisely the structures that at later times give rise to the Ly forest. Because these structures are typically filamentary, they are at first shock-heated to about 100 K. At resonant Ly scattering further increases the gas temperature to several hundred degrees. At the same time the first HII regions start to appear - one of them manifests itself in the sharply lower neutral hydrogen density at the right edge of the bottom panel at .
The optical depth, , of the neutral hydrogen to 21cm absorption is:
| (2) |
where is the neutral hydrogen fraction, and is the cosmic overdensity [17]. Figure 2 shows in two panels the joint distribution of the spin temperature, , and neutral hydrogen density (in units of the mean hydrogen density), , of gas along random lines of sight at two redshifts: and . These parameters, plus , dictate the HI 21m optical depth via equation (2).
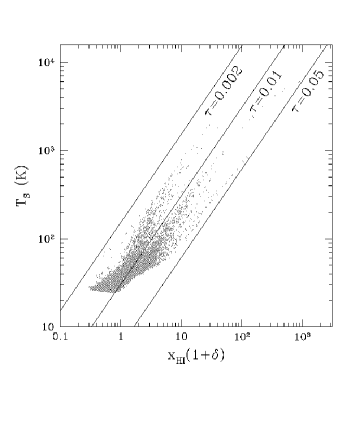
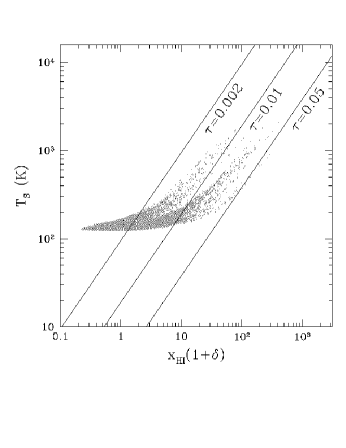
The solid lines in Figure 2 are iso- curves, for , 0.01, and 0.05. At most of the IGM has , and some of the high density regions reach and above (a finite size of the computational box limits our ability to trace the high tail of the distribution). These higher points typically have relatively narrow velocity widths, as low as a few km s-1 (Figure 1), implying HI column densities of order 1019 to 1020 cm-2. By , Ly heating of the low density gas increases the mean spin temperature to above 100 K and the mean IGM optical depth has dropped to (although cf. [4]). However, narrow, higher absorption lines that form in the still neutral filaments are still easily identifiable.
2.2 Simulated spectra of high redshift radio sources
These cosmological simulations can be used to generate synthetic HI 21cm absorption spectra, including the noise characteristic of the SKA. For the SKA parameters we assume an effective area of m2 at 200 MHz, two orthogonal polarizations, and a system temperature of 250 K (100 K from the receiver and 150 K from diffuse Galactic emission111The contribution to system temperature from diffuse Galactic nonthermal emission behaves as frequency-2.75 in this frequency range.). We also make the simplifying assumption that the ratio of effective area to system temperature remains roughly constant down to 100 MHz, as could arise in the case of a low frequency array composed of dipole antennas, and hence that the sensitivity is constant across the frequency range of interest (100 MHz to 200 MHz). We adopt a long, but not unreasonable, integration time of 10 days (240 hours). These parameters lead to an expected rms noise level of 34Jy in a 1 kHz spectral channel. We assume that the correlator will provide at least 104 spectral channels over a 10 MHz band, implying a channel width of 1 kHz = 2 km s-1. We also assume that the spectral bandpass determination will be at least as good as current telescopes, and presumably considerably better (104 over 10’s of MHz).
The sources being considered correspond to powerful radio galaxies for which the emission mechanism is non-thermal (synchrotron) radiation from a relativistic plasma of electrons and magnetic fields. In most such sources the spectrum can be described well by a power-law over the frequency range of interest (0.6 GHz to 3 GHz in the rest frame).
Figure 3a shows a simulated spectrum at 1 kHz resolution of a radio source with a flux density of 20 mJy at an observing frequency of 120 MHz. The implied luminosity density at a rest frame frequency of 151 MHz is then erg s-1 Hz-1. The on-set of HI 21cm absorption by the neutral IGM is clearly seen at 129 MHz. The general continuum level drops by about 1 at this frequency due to the diffuse neutral IGM. Deeper narrow lines are also visible to frequencies as high as 170 MHz. At around 130 MHz () there are roughly 5 narrow lines with per unit MHz, while at 160 MHz () the redshift-density is lower by a factor of 10 or so.


Figure 3b shows a simulated spectrum at 1 kHz resolution of a radio source with S120 = 35 mJy, again corresponding to erg s-1 Hz-1. The depression in the continuum due to absorption by the diffuse IGM is much less evident than at higher redshift, with a mean value of %. The deep narrow lines are still easily seen, but at lower redshift-density than is found at higher redshifts.
Limits to the detection of absorption by the neutral IGM are considered in detail in [2]. In terms of detecting the deeper narrow lines, the line redshift-density is such that we expect about two to three narrow lines with in the range to 8. In order to detect such lines at 5 at the sensitivity levels considered herein requires a continuum source of S120 = 11 mJy. The most effective method for detecting absorption by the neutral IGM is to look for a change in the rms noise level in the spectrum as a function of frequency, since a sharp increase of the rms noise level above the system noise is expected at the onset of HI 21cm absorption. These simulations suggest we should be able to detect the on-set of HI 21cm absorption by the IGM at the 5 level toward a source with S120 = 6.5 mJy at .
2.3 Physical diagnostics
It is important to emphasize that the structures giving rise to HI 21cm absorption prior to the epoch of reionization are qualitatively different from those seen after the universe reionizes. After reionization the HI 21cm lines arise only in rare density peaks () corresponding to (proto)galaxies, ie. the damped Ly systems. Prior to the epoch of fast reionization the bulk of the IGM is neutral with a measurable opacity in the HI 21cm line. The absorption seen in Figure 3 arises in the ubiquitous ‘cosmic web’, as delineated after reionization by the Ly forest [1]. The point is simply that the Ly forest as seen after the epoch of reionization corresponds to structures with neutral hydrogen column densities of order cm-2 to cm-2, and neutral fractions of order to 10-4 [19]. Before reionization these same structures will then have neutral hydrogen column densities of order cm-2 to cm-2, and hence may be detectable in HI 21cm absorption.
In general, the spectra shown in Figure 3 show that the structure of the neutral IGM during the EoR is rich in temperature, density, and velocity structure. Studying this structure via HI 21cm absorption lines will offer important clues to the evolution of the IGM at the very onset of galaxy formation. In particular, the recent discovery of polarization of the CMB on large angular scale [9] suggests that reionization may be a complex process, extending from down to . Such complex reionization could alter substantially the thermal state of the neutral IGM, thereby changing the absorption properties. For instance, Cen [3] concludes that HI 21cm absorption may be an ideal diagnostic to test for an early epoch of reionization.
3 Absorption by collapsed structures
3.1 Mini-halos
In addition to the filaments and sheets that are part of the cosmic web, 21 cm absorption offers the opportunity to observe individual collapsed structures. The most important of these are so-called ‘minihalos,’ which are collapsed halos whose virial temperatures are too small for atomic hydrogen cooling to be efficient ( K). Without cooling, the gas is unable to form stars, and it collapses only to a characteristic overdensity . These minihalos therefore become small absorbing clouds in the IGM, analogous to HI clouds in our own galaxy.222If molecular hydrogen cooling is efficient, some minihalos can cool to form stars. The efficiency of H2 formation in the early universe is controversial [12], and is likely only to be effective at extremely high redshifts (), when minihalos are still rare.
Furlanetto & Loeb [10] have recently considered 21 cm absorption from these objects (see Fig. 4). A typical minihalo absorption line has an optical depth of a few percent, assuming that the line of sight passes within the virial radius of the halo, and a width of a few km/s (determined by the virial temperature of the minihalo). They used a simple structure formation model to predict the number density of minihalo absorption lines, –, comparable to the expected number of absorbers from the cosmic web. (Note that minihalos are too small to be resolved by most numerical simulations, including those discussed above, so they constitute an independent absorption mechanism.) Distinguishing the two kinds of absorbers (mini-halos vs. cosmic web) may be difficult, although clustering and line profiles may help.
Limits on the abundance of minihalo absorbers would place stringent constraints on structure formation models. Furlanetto & Loeb showed that the abundance of minihalo absorption lines is essentially determined by two parameters. First, their number density is sensitive to the temperature of the IGM, which determines the Jeans mass. In the absence of IGM heating, simple structure formation models predict that more than of the gas should sit in minihalos by . As the IGM is heated, however, the Jeans mass approaches the cooling threshold and minihalos become significantly more rare, for reasons similar to those that cause the declining number density of absorption features from the cosmic web. Cen [3] and Oh & Haiman [14] have argued that minihalos are therefore good indicators of ‘fossil HII regions,’ or regions that have been ionized and subsequently recombined: because the temperature and entropy remain high, such regions would lack minihalo absorbers.
The second parameter is the extragalactic Ly background, which affects in the outskirts of minihalos (see §2.1; the inner regions are generally dense enough for collisional coupling between the spin and kinetic temperaturs of the gas to be efficient). The UV background therefore determines the number density of weak absorbing features (with ), as shown in Fig. 4. The three panels show the same minihalo field as the extragalactic Ly background flux is dialed up. The weak features rapidly disappear. Thus, like the cosmic web, minihalo absorption is also a sensitive probe of the radiation background through its effect on .

3.2 Protogalaxies
Halos with K can cool through atomic transitions. These objects can thus form stars and become “protogalaxies” that are in many ways similar to nearby galaxies. In particular, they host dense neutral gas clouds. If a line of sight intersects such a cloud we would expect strong 21 cm absorption. Furlanetto & Loeb [10] also considered these objects. They made the simple assumption that these objects form neutral disks in order to estimate the number density of absorption features. Not surprisingly, the lines are rare (with ) but quite deep () and wide ( km/s). Because they are such strong features, one could use fainter sources in order to search for protogalaxies. Exceptionally luminous starburst galaxies are one possibility; gamma-ray bursts with mJy radio afterglows are another. The latter are particularly interesting because one would expect to see absorption from the host galaxy with a high probability, which would provide invaluable information about the ISM characteristics of high-redshift star-forming galaxies.
4 Radio source populations
The critical requirement for absorption studies is the existence of radio sources of sufficient surface brightness at very high redshift. A simple argument in favor of very high- radio sources is that a radio galaxy and two radio loud quasars with luminosities comparable to, or significantly larger than, the values required by the SKA have already been found between and 6 [18, 16]. Extrapolating to seems a relatively small step in cosmic time. Also, Carilli et al. [2] show that the physical changes at high (such as a higher IGM density or high TCMB) do not preclude radio galaxies at these high redshifts.
The question of radio-loud AGN within the EoR has been considered in detail by Carilli et al. [2], Haiman et al. [7], and Jarvis & Rawlings (this volume). Carilli et al., and Jarvis & Rawlings, take an empirical approach, based on observed high source populations. The evolution of the luminosity function for powerful radio sources is reasonably well quantified for sources with erg s-1 Hz-1 out to [8]. Beyond this redshift existing surveys are consistent with either a flat comoving number density, or a steep decline. In either case, a simple extrapolation of the Jarvis et al. luminosity function to higher redshift and lower luminosity leads to a substantial number of radio sources beyond the EoR, even in the very pessimistic case of a space density decreasing exponentially with redshift. For a flat co-moving number density evolution there will be many sources ( sources between and 15) in the sky at high enough redshift such that HI 21cm absorption during the EoR could be observed. Even in the case of a steeply declining source population there will still be a reasonable number of sources (2240 sources between and 15) toward which absorption experiments can be performed.

Haiman et al. [7] take a more theoretical approach, based on the expected evolution of super massive black holes. Again, making reasonable extrapolations of known AGN populations, and using well constrained models of structure formation, they predict a significant number of radio sources into the EoR. Their predicted areal density of high radio sources is shown in Figure 5.
Overall, current models and observations of radio-loud AGN evolution suggest between 0.05 and 1 radio sources per square degree at with mJy, adequate for EoR HI 21cm absorption studies with the SKA (see Jarvis & Rawlings, this volume, for details).
5 An SKA search for HI 21cm absorption by the neutral IGM
Even if luminous radio sources exist during the EoR, will we be able to identify them? An obvious method would to color-select radio-loud sources in the near-IR, eg. I-band drop-outs at or H-band dropouts at . This could be done using near-IR observations of mJy radio samples or radio observations of near-IR samples. However, this method requires the objects be bright at (rest-frame) UV to blue wavelengths, thereby limiting the sample to dust-poor, optically luminous sources.
A potentially more fruitful method is to use the radio data itself. For instance, Carilli et al. [2] show that a running-rms test could be used to detect sources with anomalously large noise values in the relevant frequency range of 100 MHz to 200 MHz due to the onset of 21cm absorption by the neutral IGM. The initial identification could be made by comparing the rms for a given source to the typical rms derived from all the field sources. Once a potential high- candidate is identified, then a second test could be done to see how the noise behaves as a function of frequency in the candidate source spectrum. In this way one might also derive the source redshift from the on-set of HI 21cm absorption by the neutral IGM.
What survey area is required, and how many sources need to be considered in order to find a radio source in the EoR? For the most optimistic model (flat comoving number density evolution), the analysis of section 4 showed that there should be about 3 sources deg-2 at with sufficient radio flux density to detect HI 21cm absorption by the IGM using the SKA. The more pessimistic redshift cut-off model based on luminous QSO evolution leads to 0.05 sources deg-2. The counts of celestial sources with S mJy have been determined by a number of groups, and all values are consistent with: arcmin-2, with the 1400 MHz flux density, S1400, in mJy [20]. At the relevant flux density limits (S mJy, assuming ), the surface density of all celestial radio sources is then about 72 sources deg-2. The implied ratio of sources beyond the epoch of reionization to foreground sources is then about in the flat evolution model and in the QSO cut-off model. In either case it appears to be a tractable sifting problem.
Another important unknown parameter in any 21 cm forest search is the ionization history itself. Both [2] and [10] showed that the absorption signatures decrease in number density and strength as one approaches complete reionization. This occurs primarily because the IGM temperature is expected to increase to K well before reionization, through X-ray and shock-heating. This decreases the typical optical depth (through ) and, by raising the Jeans mass, decreases the amount of collapsed and collapsing structures. Thus we would ideally like bright radio sources to exist not just at high redshift but a substantial time before reionization.
Recently, Kogut et al. [9] measured a high optical depth to electron scattering for the cosmic microwave background, indicating that reionization may have begun at . If so, it will be much more difficult to find bright sources before reionization. Even if one constrains reionization to end at through substantial recombination or long phases of partial ionization [3, 21, 6], heating should accompany the early phases of reionization. Typical lines of sight would resemble Figure 3b more than Figure 3a, even at . In this case, the lack of absorption features in an otherwise neutral medium (perhaps detected through its 21 cm emission) would constitute a strong argument for an early era of ionization [3, 14].
6 Confusion
Foregrounds have been shown to be a potential problem when studying HI 21cm emission from the neutral IGM, including confusion by continuum sources in the field [5], and by free-free emission from the first ionized structures [15], although a carefully planned, multifrequency experiment should be able to surmount such difficulties (see contribution by Furlanetto, this volume). Studies of HI 21cm absorption do not suffer from these confusion problems for two reasons: (i) the expected lines are narrow, as opposed to the very broad (continuum) confusion signal, and (ii) absorption is best done at high (arcsecond) spatial resolution.
One remaining potential source of confusion in the absorption experiments are radio recombination lines (RRLs) arising in the first ionized structures [15]. However, these can be differentiated from HI 21cm lines by the easily recognizable frequency dependent structure of RRLs. Moreover, it is likely that at 1.4 GHz (rest frame) the RRLs may appear as stimulated emission, rather than absorption. Indeed, RRL absorption, or stimulated emission, seen toward high radio loud sources may constitute another interesting probe of the ionized IGM during the EoR.
References
- [1] Bond, J.D., Kofman, L., & Pogosian, D. 1996, Nature, 380, 603
- [2] Carilli, C. L., Gnedin, N. Y., & Owen, F. 2002, ApJ, 577, 22
- [3] Cen, R. 2003, ApJ, 591, 12
- [4] Chen, X. & Miralda-Escude, J. 2004, ApJ, 602, 1
- [5] Di Mateo, T., Perna, R., Abel, T., & Rees, M.J. 2002, ApJ, 564, 576
- [6] Haiman, Z., & Holder, G. P. 2003, ApJ, 595, 1
- [7] Haiman, Z., Quatert, E., Bower, G. 2004, ApJ, in press (astroph/0403104)
- [8] Jarvis, M.J., Rawlings, S., Willott, C.J. et al. 2001, MNRAS, 327, 907
- [9] Kogut, A. et al. 2003, ApJ (supp), 148, 161
- [10] Furlanetto, S. & Loeb, A. 2002, ApJ, 579, 1
- [11] Gnedin, N.Y. 2000, ApJ, 535, 530
- [12] Loeb, A. & Barkana, R. 2001, ARAA, 39, 19
- [13] Madau, P., Meiksin, A., & Rees, M.J. 1997, ApJ, 475, 429
- [14] Oh, S.Peng & Mack, K. 2003, MNRAS, 346, 871
- [15] Oh, S.Peng & Haiman, Z. 2003, MNRAS, 346, 456
- [16] Petric, A. et al. 2003, AJ, 126, 15
- [17] Tozzi, P., Madau, P., Meiksin, A., & Rees, M.J. 2000, ApJ, 528, 597
- [18] van Breugel, W. et al. 1999, ApJ, 518, L61
- [19] Weinberg, D.H., Miralda-Escude, J., Herquist, L., & Katz, N. 1997, ApJ, 490, 564
- [20] White, R.L. Becker, R.H., Helfand, D.J. & Gregg, M.D. 1997, ApJ, 475, 479
- [21] Wyithe, J. S. B. & Loeb, A. 2003, ApJ, 588, L69