Rocket and Observations of IC 405:
Differential Extinction and Fluorescent Molecular Hydrogen
Abstract
We present far-ultraviolet spectroscopy of the emission/reflection nebula IC 405 obtained by a rocket-borne long-slit spectrograph and the . Both data sets show a rise in the ratio of the nebular surface brightness to stellar flux (S/F⋆) of approximately two orders of magnitude towards the blue end of the far-UV bandpass. Scattering models using simple dust geometries fail to reproduce the observed S/F⋆ for realistic grain properties. The high spectral resolution of the data reveals a rich fluorescent molecular hydrogen spectrum 1000″ north of the star that is clearly distinguished from the steady blue continuum. The S/F⋆ remains roughly constant at all nebular pointings, showing that fluorescent molecular hydrogen is not the dominant cause for the blue rise. We discuss three possible mechanisms for the “Blue Dust”: differential extinction of the dominant star (HD 34078), unusual dust grain properties, and emission from nebular dust. We conclude that uncertainties in the nebular geometry and the degree of dust clumping are most likely responsible for the blue rise. As an interesting consequence of this result, we consider how IC 405 would appear in a spatially unresolved observation. If IC 405 was observed with a spatial resolution of less than 0.4 pc, for example, an observer would infer a far-UV flux that was 2.5 times the true value, giving the appearance of a stellar continuum that was less extinguished than radiation from the surrounding nebula, an effect that is reminiscent of the observed ultraviolet properties of starburst galaxies.
Subject headings:
dust, extinction—ISM:molecules—ISM:individual(IC 405)— reflection nebulae—ultraviolet: ISM1. Introduction
Observations aimed at determining the far-ultraviolet properties of dust grains are challenging as they require space-borne instrumentation designed specifically for such studies. The lack of data has hampered testing models of interstellar dust grains in the far-ultraviolet (far-UV) spectral region below Lyman- where dust most strongly attenuates the radiation field. Extinction by dust grains plays a key role in regulating the escape of radiation from a hot-star environment, thereby determining the physical structure and chemical equilibrium of the local interstellar medium (ISM). Constraints can be placed on the physical properties of dust grains by studying how they absorb and scatter far-UV light where the two interact, either near a bright source of ultraviolet photons or in the diffuse interstellar medium. Reflection nebulae offer an environment where a strong far-UV radiation field is interacting with a dusty, gaseous environment. This class of objects has been used by a number of observers in an attempt to derive the properties of grains (see Draine 2003a for a recent review). The interpretation of these observations is complicated by geometric uncertainties in the nebular dust distribution, contamination by emission from atomic and molecular species within the nebula, and uncertainties in the incident spectral energy distribution (Witt et al., 1993; Burgh et al., 2002; Hurwitz, 1998). Burgh et al. (2002) have made the first measurement of the dust albedo () and phase function asymmetry parameter ( cos ) below Ly-, using long-slit spectroscopy to constrain both quantities. However, Mathis et al. (2002) have argued that observations of reflection nebulae are so confused by the clumpy nature of the dust distributions that the derived grain properties are highly unreliable. Further addressing this problem, we present far-UV observations of IC 405.
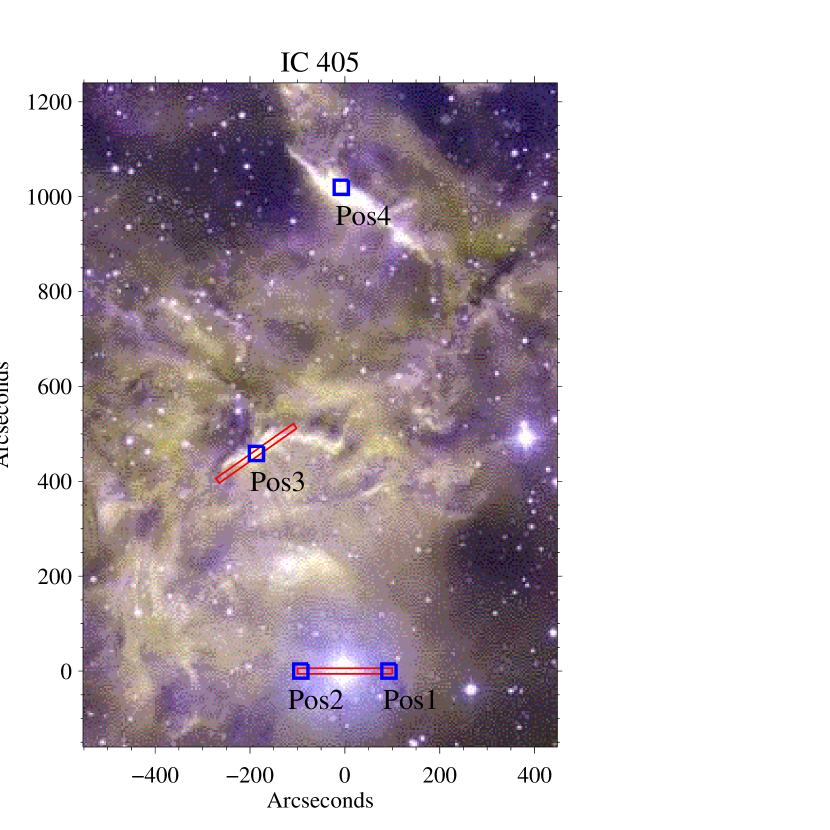
IC 405 (The Flaming Star Nebula) is an emission/reflection (Herbig, 1999) nebula in Auriga, illuminated by a dominant star, AE Aur (HD 34078). AE Aur is one of the stars thought to have been ejected from the Orion region roughly 2.5 million years ago in a binary-binary interaction that led to the creation of the well studied Ori binary system (Bagnuolo et al., 2001). Consequently, AE Aur is moving with a large proper motion through the nebula at 40 milliarcseconds yr-1 (Blaauw & Morgan, 1954). Herbig (1999) used repeated observations of this high proper motion object to search for interstellar line variations, providing information about clump structure in the ISM . Presently, AE Aur is thought to be cospatial with the nebula at a distance of about 450 pc. It is bright in both the visible (V 6.0) and the ultraviolet (O9.5 Ve), although it is rather extinguished ( and = 3.42; Cardelli, Clayton, Mathis 1989). In this paper, we present far-UV observations of IC 405 made with a rocket-borne long-slit spectrograph and the (). Figure 1 shows the nebula with the various spectrograph apertures overlaid. Section 2 includes a description of the rocket experiment, the observations, and the data reduction. In 3, we describe the observations and reduction. Section 4 puts the IC 405 data in context with previous studies of other reflection nebulae, including discussion and interpretation of the results and their possible consequences. Our observations of IC 405 are summarized in 5.
2. Rocket Observations
Long-slit spectroscopy is a technique that lends itself to the study of reflection nebulae where the exciting star(s) typically are embedded in or near the gas and dust with which they are interacting. The extended aperture allows nebular spectra to be measured continuously along the slit, and variations can be observed in both wavelength and angle from the central object. This information can also be obtained through small apertures, but this requires multiple observations, which is costly in the far-UV bandpass where observing time is at a premium.
2.1. Instrument Description and Observations
The sounding rocket experiment consists of a telescope and spectrograph designed for use in the far-UV. The telescope is an updated version of the Faint Object Telescope (FOT), a 40 cm diameter, f/15.7 Dall-Kirkham (Hartig et al., 1980; McCandliss et al., 1994; Burgh et al., 2002). The optics are coated with a layer of ion-beam sputtered SiC to enhance the reflectivity at far-UV wavelengths. The telescope is housed in an invar heat-shield with a co-axially mounted startracker which provides error signals to the Attitude Control System (ACS).
The FOT focuses the target at the entrance aperture of the instrument, an evacuated 400 mm diameter Rowland Circle spectrograph using a holographically ruled, SiC coated, diffraction grating in the first order. The detector is a microchannel plate stack with a KBr photocathode, read out by a double delay-line anode (Siegmund et al., 1993). The spectrograph is kept at a vacuum of 10-8 Torr and isolated from the spectrograph section by a gate valve that opens under timer control in flight. The spectrograph and telescope sections share a common vacuum ( few 10-5 Torr). A mirrored slitjaw, angled 22∘ from the optical axis, lies at the telescope focus. A long slit (12″200″ projected on the sky, 5.6 10-8 sr) is etched into the slitjaw, defining the entrance aperture to the spectrograph. The spectrograph achieves a pointing limited spectral resolution of 3 Å.
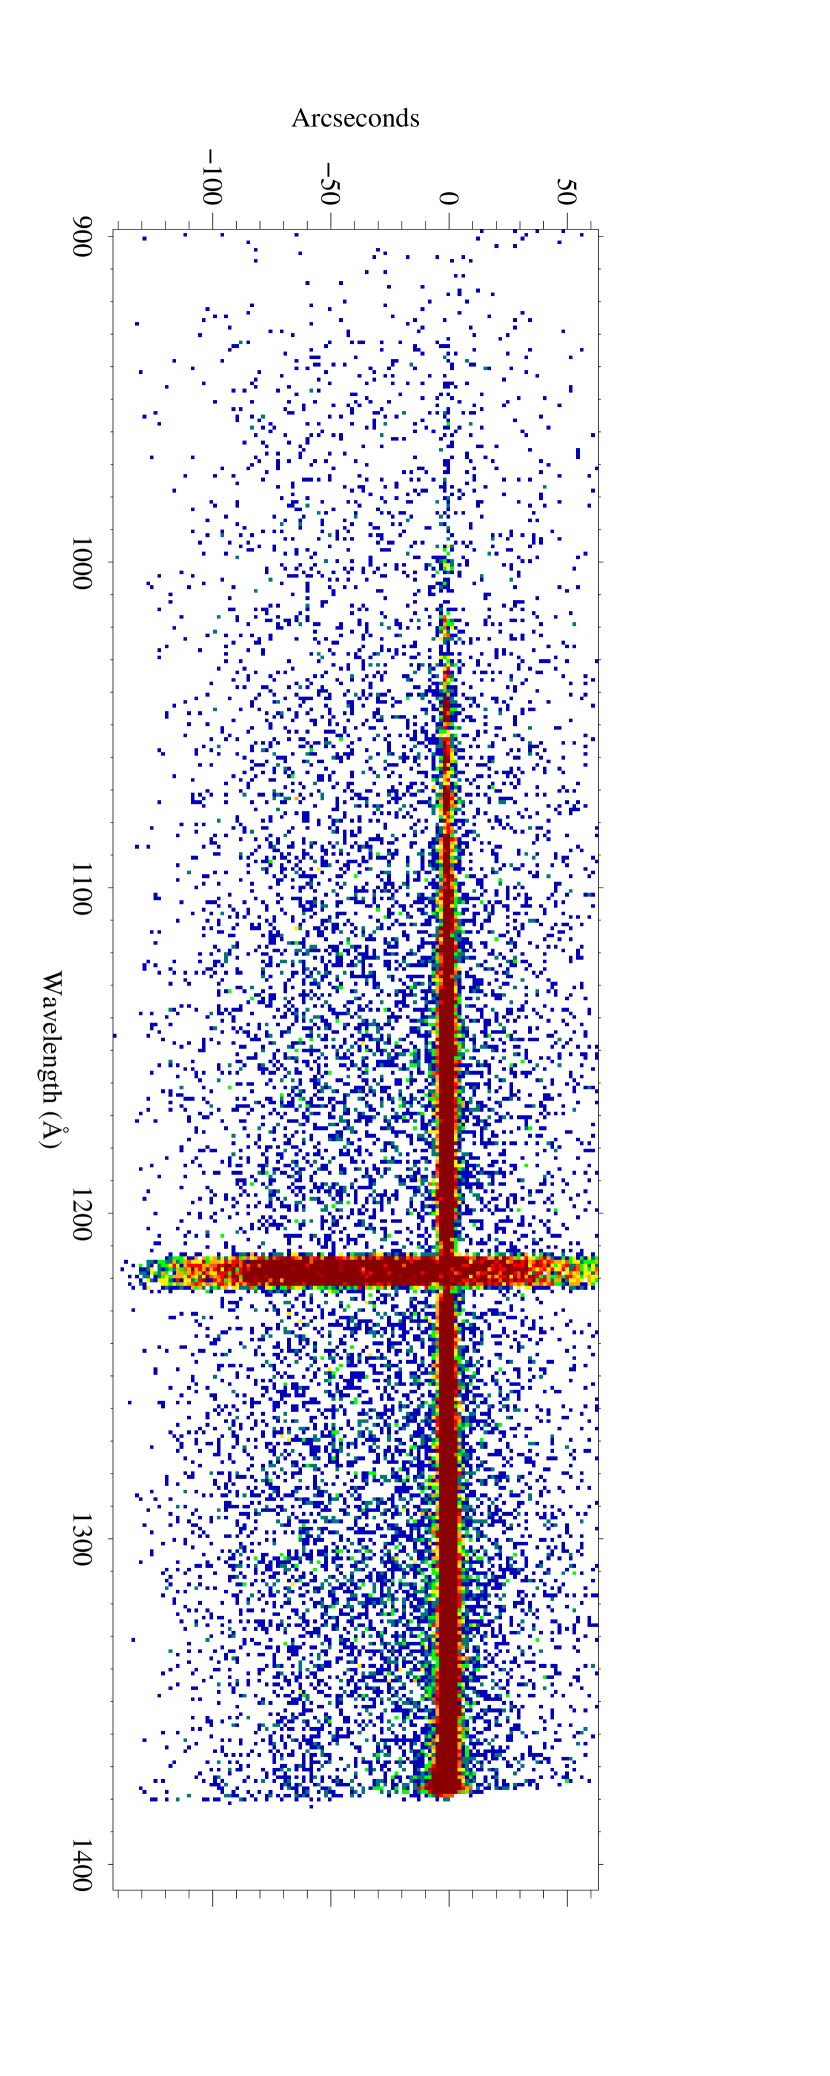
This experiment was launched aboard a Black Brant IX sounding rocket (NASA 36.198 UG) from White Sands Missile Range, New Mexico ( West, North), on 09 February 2001 at 21:00 MST. The target was obtained by referencing the startracker to two bright guide stars (Sirius and Capella), then reorienting to the target. The acquired field is within a few arcminutes of the expected pointing. The field is relayed to the ground in real-time through a Xybion TV camera imaging the slitjaw (20′ field-of-view). Fine adjustments are performed in real-time via commands to the ACS. HD 34078 was placed in the spectrograph slit at T+150 seconds and data was taken continuously until detector high-voltage turn-off at T+490 seconds. The stellar spectrum was recorded for 106.2 seconds of the flight (hereafter the “on-star” pointing). Two offset pointings within the nebula were observed with only one having a count rate higher than the background (observed for 68.7 seconds, hereafter the “off-star” pointing). Figure 2 shows the pointing corrected long-slit spectrogram of the data obtained from target acquisition to detector turn-off.
2.2. Analysis of the Rocket Observations
Flight data were analyzed using IDL code customized to read the data as supplied by the telemetry system. A background subtraction can be made by measuring the flux on the detector after instrument turn-on, but prior to target acquisition. The primary source of background flux is geocoronal airglow from atomic hydrogen and oxygen. The data are then calibrated with measurements of the telescope mirror reflectivities and spectrograph quantum efficiency, measured both before and after flight in the calibration facilities located at The Johns Hopkins University.
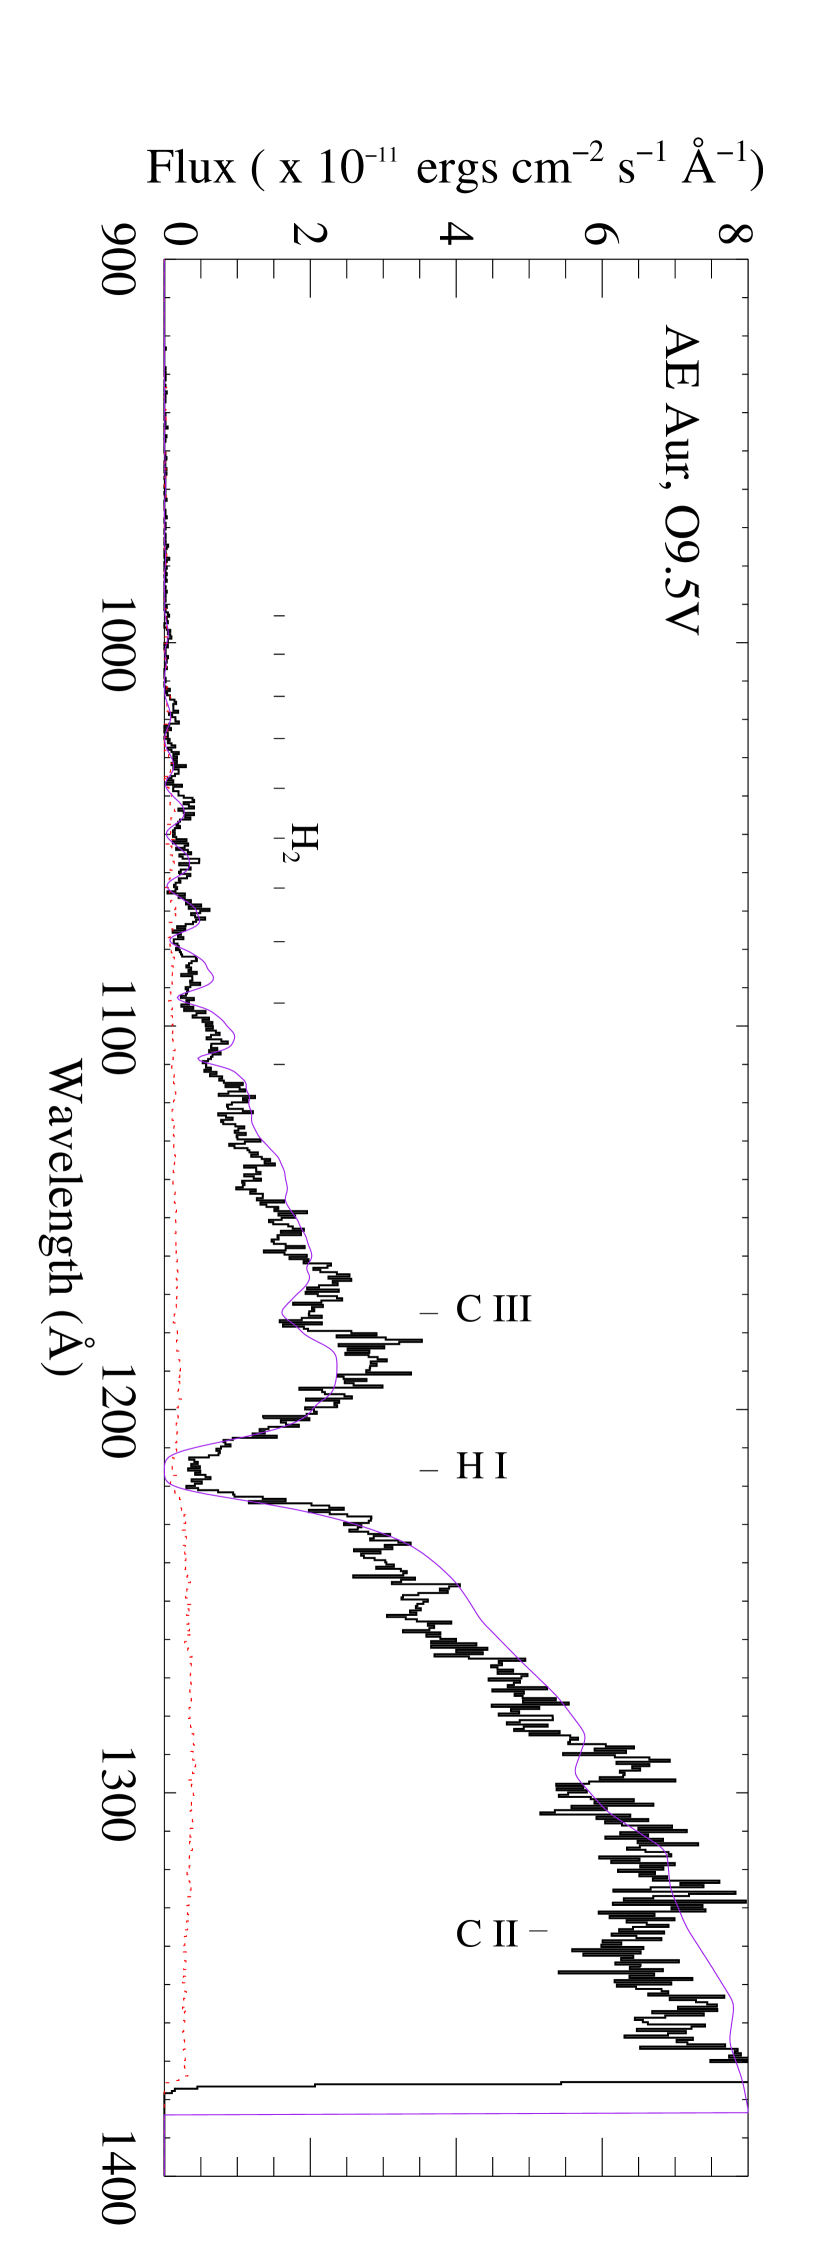
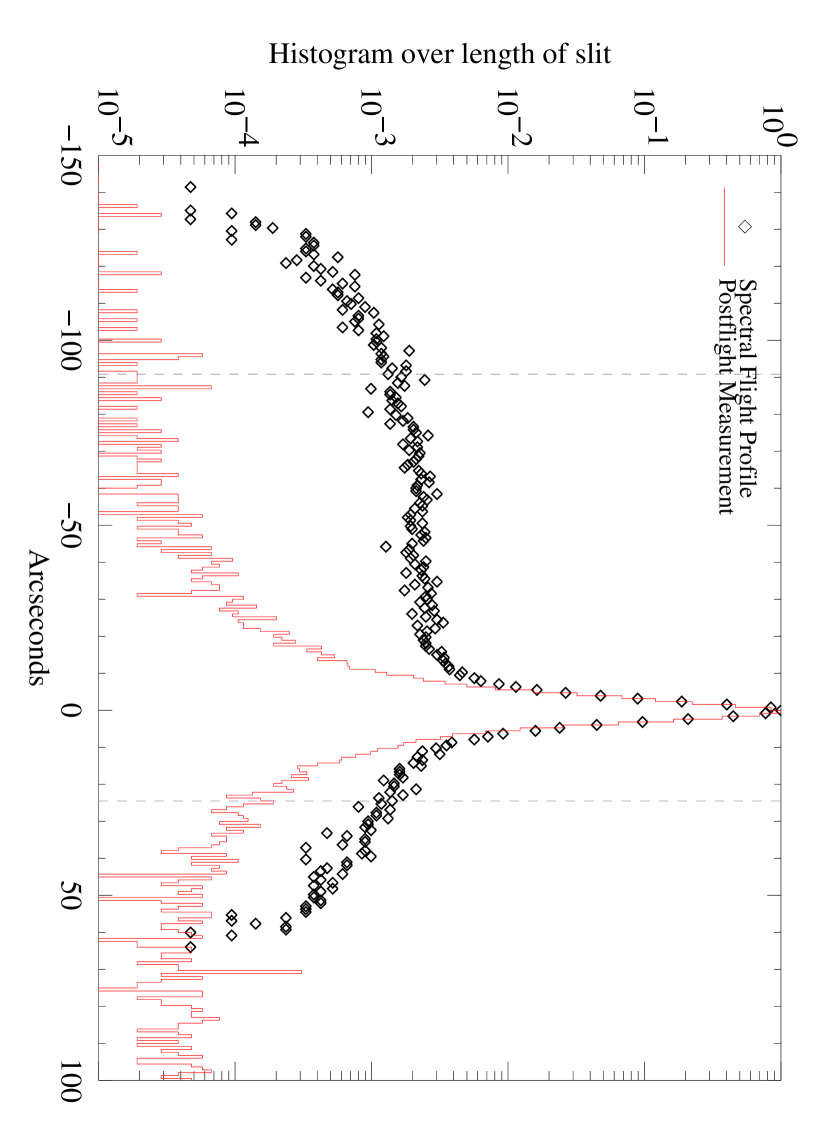
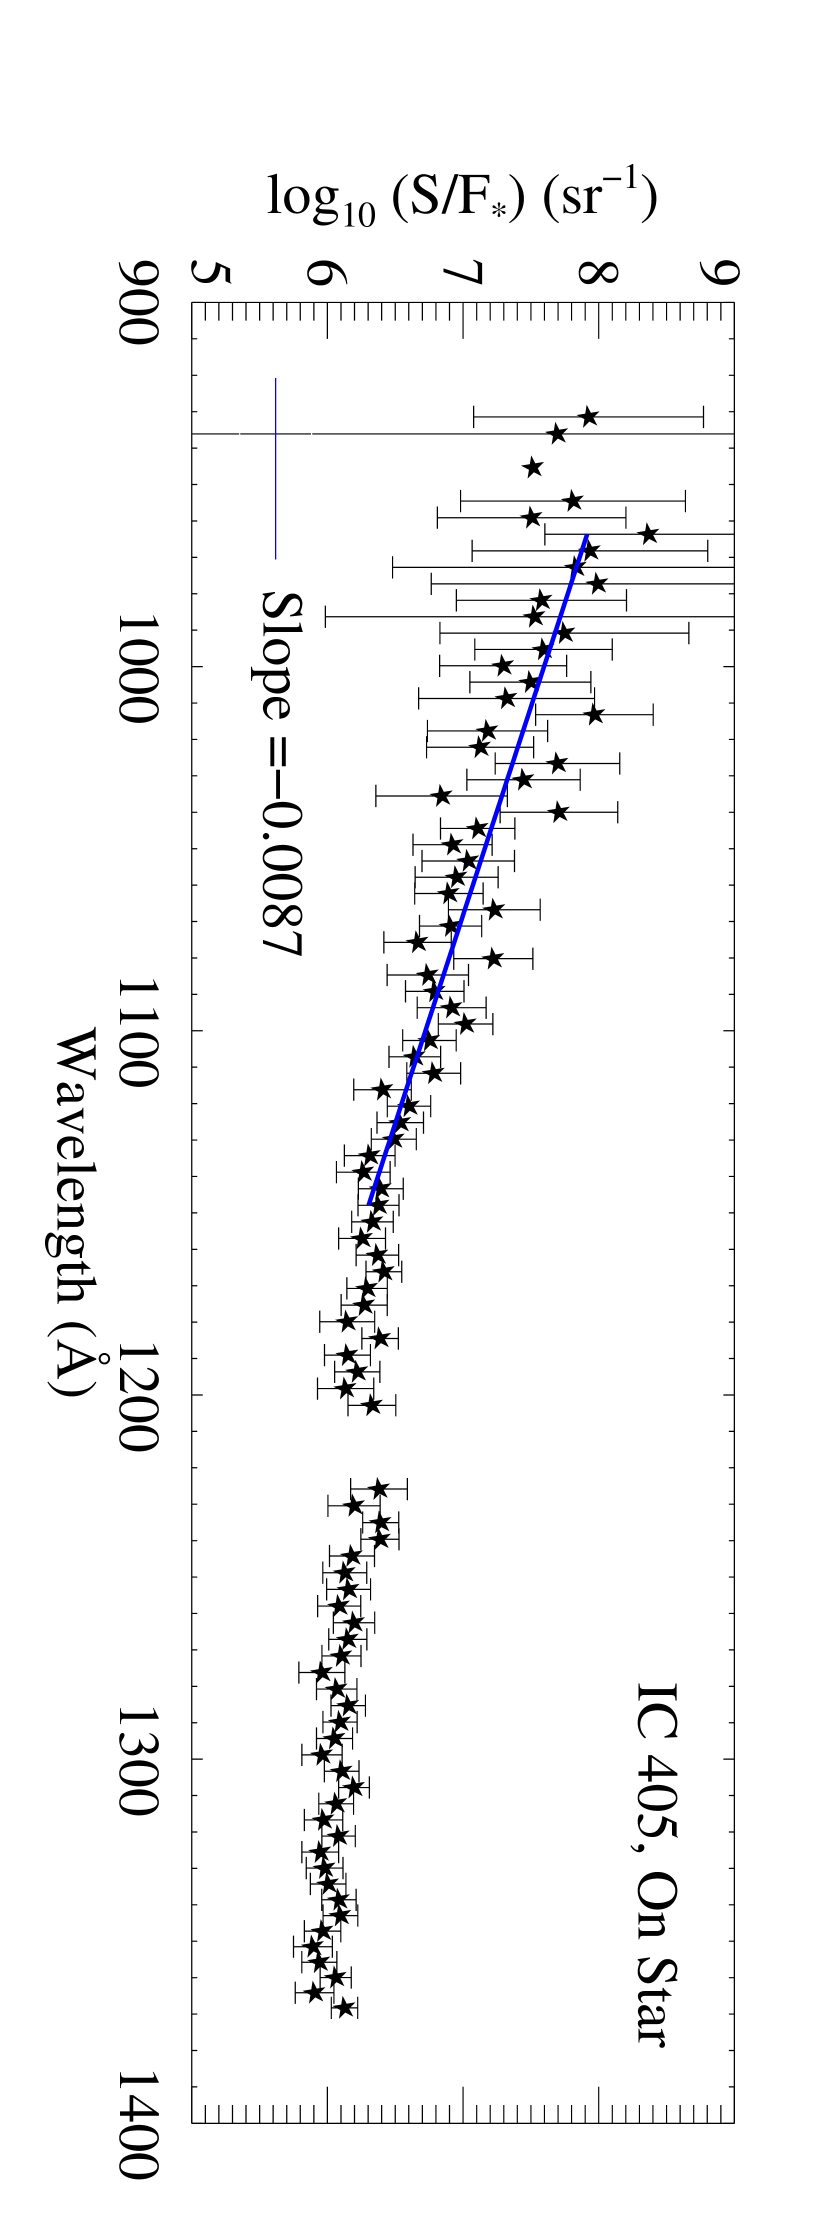
The stellar spectrum is extracted following corrections for pointing errors and detector drift. Figure 3 shows the spectrum of the HD 34078 obtained during the flight. The spectrum is of high quality (S/N 10-15 at = 300), and is consistent with previous far-UV measurements (; Penny et al. 1996 and ; Le Petite et al. 2001). In Figure 3, the measured spectrum has been shown overplotted with a synthetic stellar spectrum. The model has been extinguished using the parametrization of Fitzpatrick & Massa (1990) and the molecular hydrogen absorption templates (McCandliss, 2003) for a = 3, as determined by Le Petite et al. (2001), and a total column density (H2) = 8.1 x 1020 cm-2, that we determined from the spectrum of the star, described below. The stellar spectrum shows interstellar absorption features of H I, H2, C II, and O I and photospheric C III absorption. After the star is removed, the spectra from different regions within the nebula can be separated by “time-tagging” the data from a playback of the slitjaw camera that shows the flight time. Integrating the nebular spectra over the area of the slit allows one to measure the nebular surface brightness. Using the vacuum collimator described by Burgh et al. (2001), we can determine the instrumental line-spread-function, and we find that the in-flight stellar profile matches our post-flight calibrations. Figure 4 shows the spatial profile of the nebular brightness (corrected for Ly- airglow) that extends well beyond the intrinsic instrumental profile. Once the nebular surface brightness and stellar flux have been measured, their ratio (S/F⋆) can be taken. This reveals the most surprising feature of our observations: the ratio of nebular surface brightness to stellar flux rises roughly two orders of magnitude to the blue from 1400 to 900 Å, as shown in Figure 5. This sharp rise in S/F⋆ is in stark contrast with similar observations of the reflection nebulae NGC 2023 and 7023 (Burgh et al., 2002; Witt et al., 1993; Murthy et al., 1993), where the S/F⋆ is found to be constant with wavelength in the far-UV regime.
3. Observations and Data Reduction
Additional nebular observations were made by from 11 to 13 March 2003 on four positions within IC 405 (programs D12701, 02, 03, and 04). Spectra were obtained in the 905–1187 Å bandpass with the low-resolution (LWRS) aperture (30″30″) on (see Moos et al. 2000 for a satellite description and Sanhow et al. 2000 for on-orbit performance characteristics). Assuming that the nebulosity fills the LWRS aperture, a spectral resolution of 0.33 Å is achieved at 1060 Å. Positions 01 (Pos1) and 02 (Pos2) were observed for 1850 and 1880 seconds, respectively, corresponding to the bottom and top of the long-slit of the rocket spectrograph. Position 03 (Pos3) was observed for 12.6 ks, overlapping with the “off-star” rocket pointing and Position 4 (Pos4), a bright optical filament north of the star was observed for 12.4 ks. Using an approach similar to the unsharp masking technique described by Witt & Malin (1989), we suspect Pos4 to exhibit Extended Red Emission (ERE). A list of the pointings is given in Table 1.
| Position | Program | RA (2000) | (2000) | Integration Time | Brightness at 1060 Å |
|---|---|---|---|---|---|
| ( h m | (° ′ ″) | (seconds) | (ergs cm-2 s-1 Å-1 sr-1) | ||
| IC405-01 | D12701 | 05 16 12.15 | +34 18 49.3 | 1850 | 2.0 x 10⁻⁵ |
| IC405-02 | D12701 | 05 16 24.15 | +34 18 49.3 | 1880 | 2.7 x 10⁻⁵ |
| IC405-03 | D12703 | 05 16 30.21 | +34 24 56.4 | 12630 | 3.5 x 10⁻⁶ |
| IC405-04 | D12704 | 05 16 18.64 | +34 32 25.2 | 12445 | 1.1 x 10⁻⁶ |
Data for all four pointings were obtained in “time-tagged” (TTAG) mode and were initially processed using the CALFUSE pipeline, version 2.2.3. The calibrated data files for each orbit were then combined using IDL software, and when possible, the individual channels were combined using a cross-correlation algorithm. Due to the diffuse nature of the targets, there were instances where this algorithm failed; in these cases, the channels were analyzed independently.
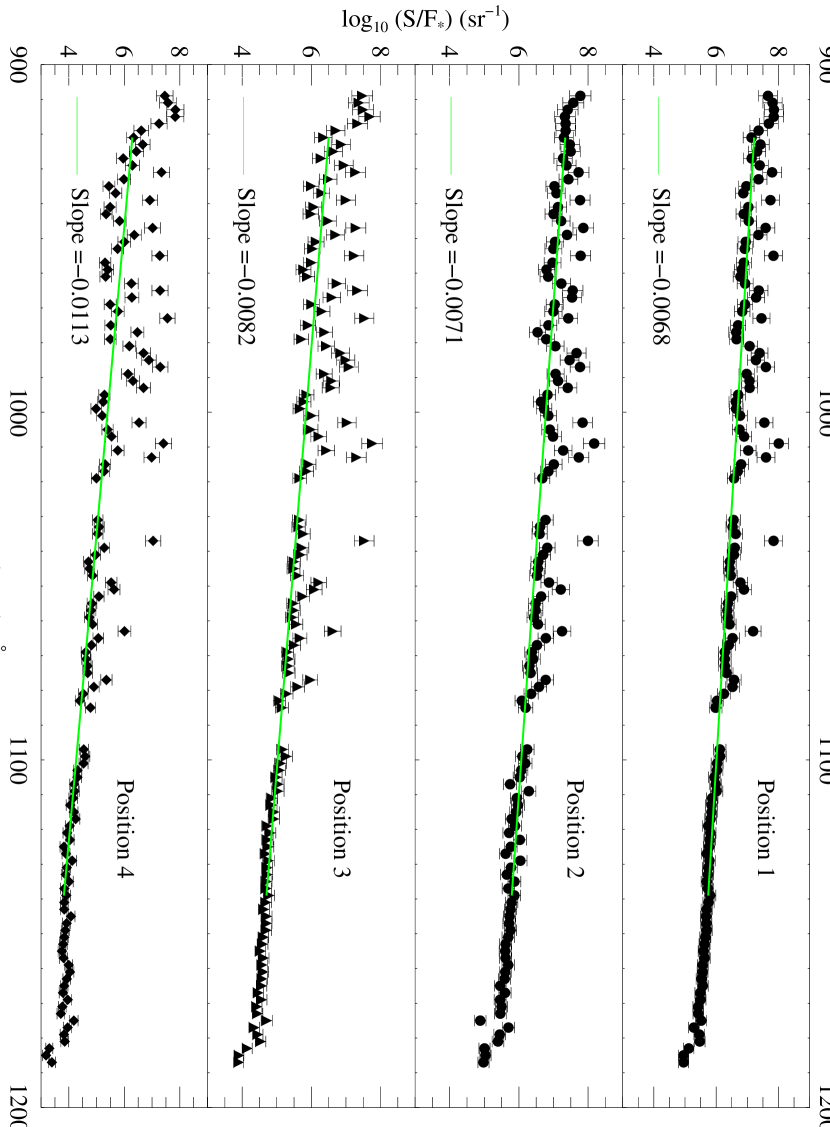
The increased sensitivity and spectral resolution of allowed us to confirm the blueness found in IC 405 and to determine the contribution of fluorescent H2 to the nebular surface brightness. HD 34078 has been observed by under program A070 and stellar spectra were obtained from the MultiMission Archive at the Space Telescope Science Institute (MAST). With the spatial information obtained by multiple pointings in the case of the data, we were able to confirm the rocket result independently. Figure 6 shows a similar blue S/F⋆ at all four pointings. The log10(S/F⋆) was fit at wavelengths unobstructed by terrestrial airglow lines or interstellar absorption from 912 – 1150 Å in the Pos1 spectrum, where the scattered stellar continuum was bright (the long wavelength limit was chosen to avoid “The Worm” present in the data). We find that the data is well matched by a linear fit with a slope of (8.4 0.4) 10-3, averaged over all positions. For comparison, the rocket derived S/F⋆ was fit using the same procedure and the agreement is good, (8.7 0.6) 10-3.
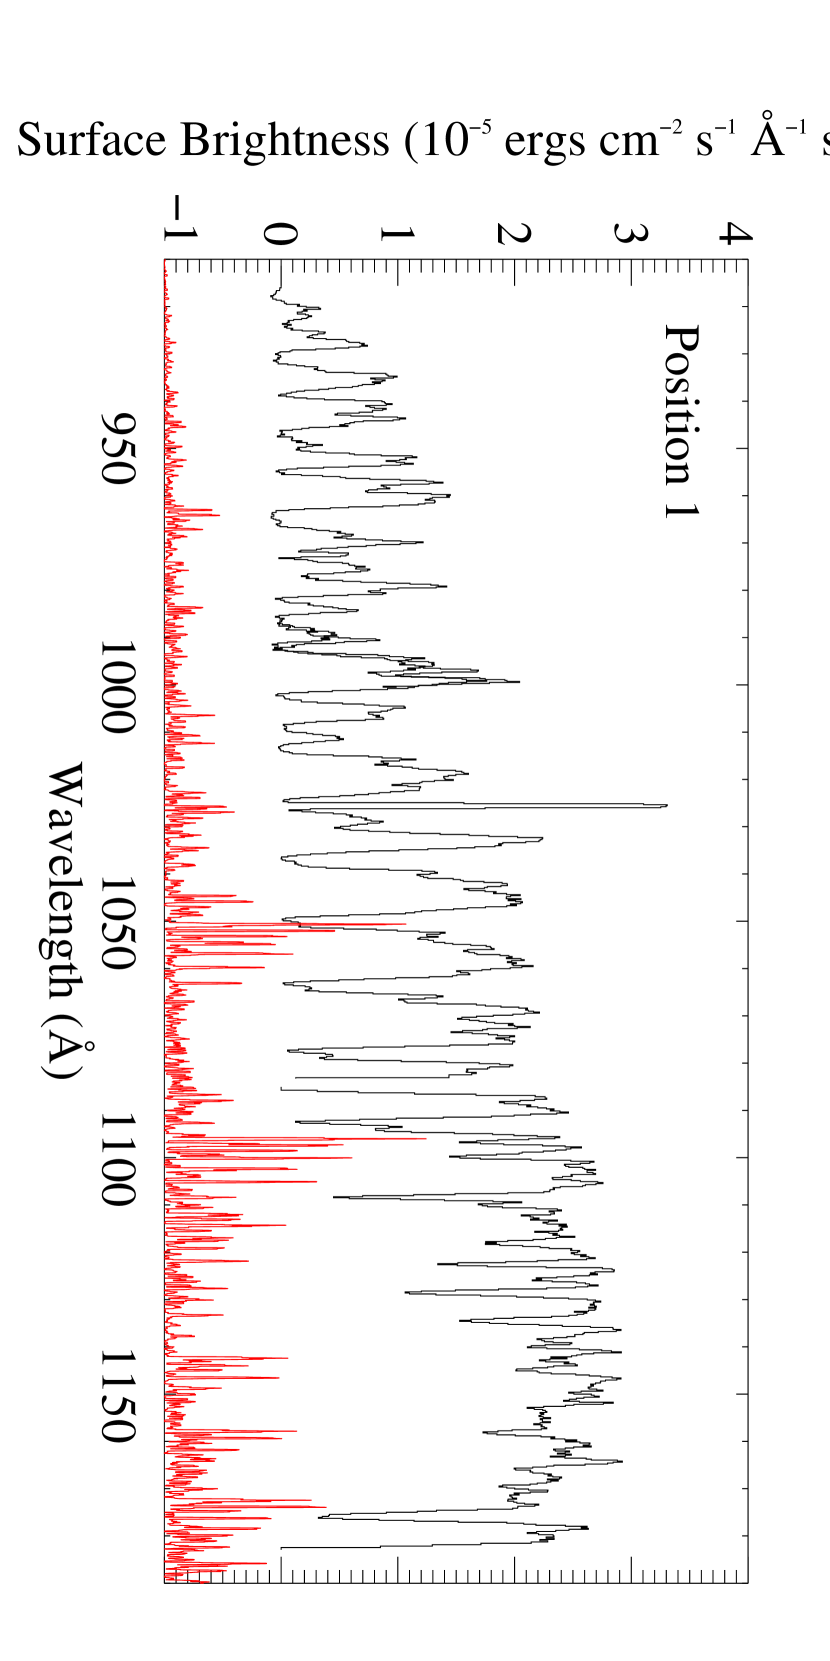
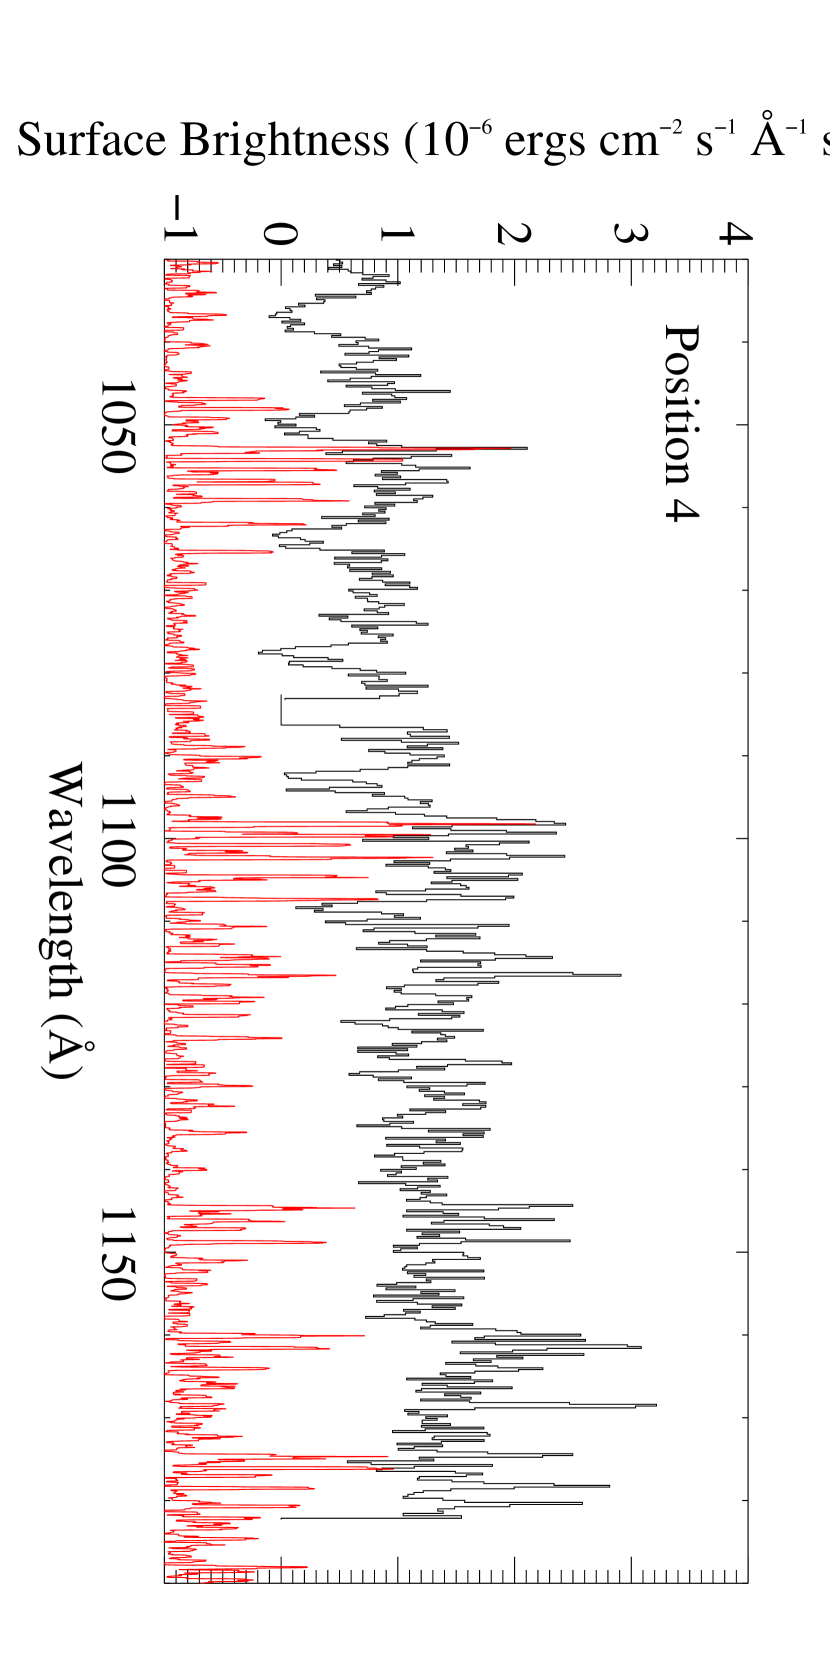
Figures 7 and 8 display the nebular spectra evolving from the influence of a strong radiation field very near the star (Pos1, 105, where is the average interstellar radiation field; Draine (1978)) to the furthest offset, approximately 1000″ to the north (Pos4, 103). Both spectra are overplotted with a synthetic H2 emission spectrum, created by a fluorescence code similar to the one described in Wolven et al. (1997). Pos1 and Pos2 are dominated by a scattered stellar spectrum, with pronounced H2 absorption troughs but only hints of H2 emission near 1100 and 1160 Å. Pos3 shows the scattered stellar spectrum less strongly as the influence of HD 34078 diminishes with distance, and the H2 emission becomes clear. The separation from the star is great enough at Pos4 ( 2 pc at the stellar distance of 450 pc) that the numerous fluorescent emission lines appear strongly from 1050 Å to the end of the bandpass near 1187 Å. The observed nebular lines arise from electronic transitions ( and to ) that decay from the ground and first excited vibrational state ( = 0,1).
4. Results and Discussion
The strong blue rise in IC 405 is remarkable because both observational (Burgh et al., 2002; Witt et al., 1993; Murthy et al., 1993) and theoretical (Weingartner & Draine, 2001) studies find a decreasing albedo across the far-UV bandpass. What mechanism is responsible for not only overcoming the falling albedo but increasing the observed nebular brightness? We consider:
-
•
Peculiar dust grain properties (unusual values of and ) in IC 405,
-
•
Strong fluorescent H2 emission that falls below the sensitivity and spectral resolution of the rocket experiment,
-
•
Unusually small grain distribution leading to a strong Rayleigh scattered component of the nebular brightness,
-
•
An unusual dust emission process, an extended blue emission, and
-
•
Differential extinction in IC 405 due to a complicated local geometry or an intervening clump of gas and dust along the line of sight to HD 34078
4.1. Dust Modeling
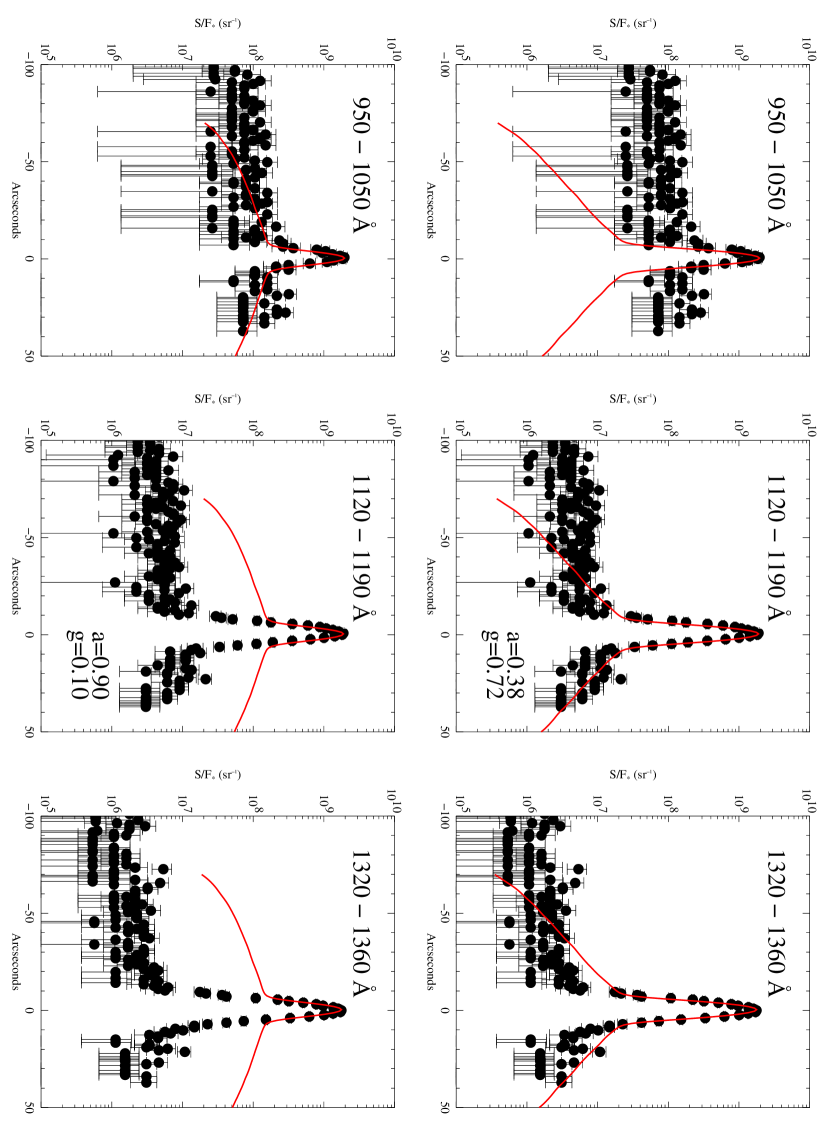
The dust scattering in IC 405 was modeled using a modified version of the code described by Burgh et al. (2002), employing a Monte Carlo dust radiative transfer model (see also Gordon et al. 2001). The model follows the path (direction and position) of each photon in the nebula from its “creation” at the position of the star, until it leaves the nebula (i.e., its radial position is outside the defined size of the nebula). The factors that determine the position and direction of the photons during their propagation through the nebula are the optical depth of the dust, the fraction of photons scattered by the dust rather than absorbed (the albedo), the angular distribution of the scattered photons (parameterized by in the scattering distribution given by the Henyey-Greenstein 1941 phase function), and the geometry of the dust distribution. Although Draine (2003b) has argued that the H-G function does not reproduce the scattering function calculated from the optical properties of dust models in the far-UV bandpass, we use it here to allow for a direct comparison with the result from Burgh et al. (2002). A revision of our model replacing the H-G phase function with a function that depends on the scattering cross-sections for dust grains in the far-UV (as well as more sophisticated geometries) will be addressed in a future work. Given inputs for the number of photons followed, the optical depth, albedo, and , the model outputs an image of the nebular surface brightness that can be compared to the distribution measured by the rocket experiment. The rocket data are binned by wavelength region to improve S/N, and then plotted as a function of spatial position along the slit.
This model, which works well to closely approximate the observed surface brightness distribution in the bright reflection nebula NGC 2023, fails to reproduce the nebular surface brightness of IC 405 by orders of magnitude. Models were run for a number of values for the optical depth, , , and nebular geometry. Models explored spherical geometries with constant density and , as well as spherical shell and a constant density slab. The results are best illustrated by considering two specific cases, shown in Figure 9, the first using the and from Weingartner and Draine (2001) for RV = 4.0. The model shows poor agreement across the bandpass, particularly at the short wavelength end (a result of the nebular blueness). The second model finds the best fit to the short wavelength data, revealing = 0.9, = 0.1, in strong disagreement with both theoretical and other measured values in this wavelength regime (see Draine 2003a and references therein). Additionally, a 50 differential extinction was needed in the best-fit 950-1050 Å model; i.e. the stellar flux directly along the line of sight to the observer was reduced by a factor of two. As this model begins to reproduce the short wavelength result, the longer wavelength data is in poor agreement. This exercise clearly shows that this reflection nebula is not well described by a smooth and uniform dust distribution. More sophisticated models, employing varying dust densities, complex geometries, and more appropriate scattering phase functions than exist at present may be able to reproduce our observations of IC 405.
4.2. Comparison with other Reflection Nebulae
Only one far-ultraviolet observation exists that includes both spatial and spectral information, however there are a few previous data sets that put our S/F⋆ result in context. Burgh et al. (2002) reported on observations of NGC 2023 made with the same rocket-borne imaging spectrograph described above. This nearly identical observation, made in 2000 February, found that the ratio of nebular surface brightness to stellar flux was constant with wavelength across the 900 to 1400 Å bandpass. They model the nebular scattering properties (as described above) and determine that a decreasing dust albedo is being offset by grains that are more strongly forward scattering at shorter wavelengths (increasing ).
Witt et al. (1993) and Murthy et al. (1993) used observations
made by the
() to
measure S/F⋆ in another bright
reflection nebula, NGC 7023, without the benefit of a spatially resolved slit.
Murthy et al. describes
the observations made during the Astro-1 mission in 1990
December, obtaining a spectrum of the central star (HD 200775)
and then offsetting to a pointing within the nebula. They obtained
data with an appreciable signal in the 1100 – 1860 Å region
and also found that the S/F⋆ ratio was constant with
wavelength. They use a Monte Carlo scattering model
(described by Witt et al. 1982) and find a
decreasing albedo for 1400 Å (assuming = 0.7).
This result agrees with that of Witt et al. (1993), who combined
the stellar observation with data from the ultraviolet spectrometer
on and found a drop in the albedo of 25 between 1300
and 1000 Å. The observed S/F⋆ is found to be flat across this
wavelength region. An increase in nebular surface
brightness of 25 from an unresolved H2 emission component is assumed to
counteract the falling albedo (Witt et al., 1993; Sternberg, 1989). Ultraviolet studies of a similar
nature have been carried out on the Scorpius OB association (Gordon et al., 1994),
IC 435 (Calzetti et al., 1995), and the Pleiades reflection nebula (Gibson & Nordsieck, 2003),
but these studies focused on longer wavelengths than considered here.
4.3. Mechanisms for Producing the Blue Rise
As our dust scattering models fail to reproduce the short wavelength rise in S/F⋆ for realistic values of grain parameters in IC 405, we consider other possibilities. Ultraviolet H2 emission is clearly present in IC 405, the double peaked emission feature near 1600 Å was first seen by (spectrum ic405_080) and our data resolve the individual rotational components of several vibrational bands between 1050 and 1185 Å (Figure 8). Near HD 34078 however, we find little evidence for H2 emission as either the continuum overwhelms the fluorescent signal or the environment is unfavorable for the fluorescent process (Sternberg, 1989). Regardless of the relative contribution of fluorescing H2 to the nebular spectrum, each of our pointings in IC 405 reveal a very similar, blue S/F⋆ ratio. The evolution of the fluorescence signature with distance from the exciting star is interesting, but the constancy of the nebular brightness to stellar flux rules out molecular hydrogen as the dominant cause of the blue rise in IC 405.
A small grain population has been suggested for NGC 7023 (Murthy et al., 1993; Witt et al., 1993), yet these grains are expected to be efficient absorbers of far-UV radiation. We have no reason to expect to find a unique distribution of high albedo grains in IC 405, although we note that the large proper motion of HD 34078 brings it into contact with grains that are unlikely to have undergone significant processing by UV photons. The exciting stars of NGC 2023 and 7023 are thought to be born in the presence of the dust with which they are interacting, clearly a different scenario than in IC 405. It is interesting to note that Vijh et al. (2004) have recently found a continuous near-UV/optical emission in the Red Rectangle nebula which they attribute to fluorescence by small polycyclic aromatic hydrocarbon (PAH) molecules. We are unaware of a molecular continuum process that operates at far-UV wavelengths, however we cannot conclusively rule out a contribution from PAH molecules. Further studies of the vacuum ultraviolet emission and absorption properties of PAH molecules would be of interest.
Mathis et al. (2002) have argued that clumpy dust distributions make grain properties derived from observations of reflection nebulae unreliable. They develop a model of hierarchical clumping that predicts widely varying determinations of the albedo and the scattering parameter depending on the viewing angle, the degree of clumping, if the central star happens to reside inside a dense clump, and the density of the interclump medium. As dust scattering models and molecular hydrogen fluorescence have failed to reproduce our data, and other explanations seem speculative at this time, we adopt differential extinction due to a clumpy dust distribution as the most probable explanation for the blue S/F⋆ ratio in IC 405. A small interstellar clump/filamentary structure or circumstellar feature directly along the sight line to HD 34078, but not present in front of the rest of the nebula would preferentially extinguish the shorter wavelength stellar photons reaching us directly, thus making the denominator in S/F⋆ small at short wavelengths. Our dust scattering models are unable to account for such complex geometries, but we can begin to study the degree of clumpiness by examining the extinction in IC 405.
4.4. Differential Extinction Limits
We can put limits on a differential extinction level that can account for the blue rise by quantifying the extinction properties and physical size of an obscuring clump. We begin by determining the level of variation in the extinction curve between HD 34078 and the region surrounding it. Using the extinction curve to deredden the HD 34078 line of sight will constrain the difference in attenuation between the stellar and nebular lines of sight. We deredden the HD 34078 sight line by dividing the stellar spectrum by the observed extinction curve. An extinction curve is created following the pair method, a correction for molecular hydrogen absorption is applied, and then the resultant curve is fit using the parameterization of Fitzpatrick & Massa (1990). HD 93521, (09V, = 0.02; Buss et al. 1995) was used as the comparison star and the extinction curve was created between 900 and 3000 Å from a combination of the rocket data and archival and spectra. Molecular hydrogen absorption was corrected for using the absorption templates for the parameters described in 2.2 (McCandliss, 2003; Sasseen et al., 2002). We find the FM-fit parameters to be (,,,,,) = (4.59,0.94,0.17,0.37,6.25,1.05). Repeating our S/F⋆ analysis using the dereddened star, we find that the ratio is constant across the rocket bandpass. Assuming that the extinction curve only applies to the stellar sight line seems to account for the blue rise, but comes with the implication that the nebula has a foreground extinction of zero. If differential extinction is the sole mechanism at work in creating a blue S/F⋆ in IC 405, then all of the observed reddening would appear to originate in a small clump along a pencil-beam to HD 34078.
We determine the size of such a “small clump” by measuring the nebular brightness profile along the rocket slit at the “on-star” pointing, and find the the clump size must be smaller than about 20″. It is unclear where the clump is located along the line of sight to HD 34078, but an upper limit on the physical size can be set by requiring it to be near the star, we find the upper limit to be 0.04 pc. Variations have recently been detected in the column density of CH along the line of sight to HD 34078, suggesting structure on the scale of tens of AU (Rollinde et al., 2003). One possible explanation for the (CH) variation is the presence of a clump along the HD 34078 line of sight, newly present due to the high proper motion of the star, although the the analysis presented in Rollinde et al. (2003) finds this hypothesis to be unlikely. Independent of the location of the clump, there is other evidence of multiple absorption components along the line of sight. In addition to the scattered stellar continuum seen at Pos1, spectra of HD 34078 revealed both cold (T = 80 K) and highly excited H2 in absorption (Le Petite et al., 2001; Rollinde et al., 2003). The ambient interstellar radiation field is insufficient to excite H2 to the observed levels (up to = 0, j = 11), implying the relative proximity of HD 34078.
4.5. Consequences for Unresolved Observations
We note that if IC 405 were observed in a spatially unresolved manner or seen from a large distance, HD 34078 would appear to be less extinguished than in the present case, where the star and nebula can be measured separately. If observed at a large distance, the integrated blue nebular continuum and the reddened star light would be considered stellar in origin, artificially dereddening the intrinsic stellar continuum. As a rough determination of how such an observation may be biased, we assume a uniform surface brightness filling the rocket slit at the on-star pointing, and estimate the contribution of the nebular flux to the total observed spectrum in the unresolved case. In the simple case of a constant surface brightness nebula the length of the rocket long-slit on each side (200″200″, 0.4 pc0.4 pc), we determine a nebular filling factor correction of about 15. Multiplying the nebular flux measured during the on-star position by the filling factor and adding that to the stellar flux, we determine how bright HD 34078 would appear in an unresolved observation. Taking a constant flux of 1.0 10-12 ergs cm-2 s-1 Å-1 at 1100 Å (from the nebular spectrum observed by the rocket, consistent with the measurement), we find that the integrated nebular flux would be 1.5 10-11 ergs cm-2 s-1 Å-1, 50 brighter than the star itself. A spatially unresolved far-UV observation of IC 405 would lead one to measure a stellar flux level 2.5 times (one magnitude) greater than the true value. This effect is reminiscent of the observed UV properties of local starburst galaxies described by Calzetti (1997). Local starbursts show less extinction of the stellar continuum relative to the nebular emission lines, explained by a clumpy dust distribution that preferentially reddens nebular light due to the different filling factors of the stars and gas. Calzetti (1997) finds that stellar photons only encounter approximately 60 of the dust seen by nebular photons.
5. Summary
The emission/reflection nebula IC 405 was observed by a rocket-borne, long-slit imaging spectrograph in the far-ultraviolet bandpass (900 – 1400 Å). A high quality spectrum (S/N 10 – 15) was obtained of the central star, HD 34078, as well as the spectra of the surrounding nebula out to an offset approximately a parsec from the star. We found that the ratio of nebular surface brightness to stellar flux (S/F⋆) rose by two orders of magnitude to the blue across the bandpass of the instrument. This result is in conflict with analogous observations of reflection nebulae in this wavelength regime (NGC 2023 and 7023), where flat S/F⋆s were observed. This result held true for both positions within the nebula. Additional observations were made with in an attempt to clarify the process responsible for the blue rise. observed four positions within IC 405, three coincident with the rocket pointings, and one along another bright nebular filament. These data revealed the nature of the nebular spectra: a progression from strong scattered stellar continuum near the star to the appearance of fluorescent emission from H2 farthest from the star. An analysis of S/F⋆ confirmed the blueness throughout IC 405, showing little correlation with the nebular spectral characteristics.
Models of scattering in a uniform dust distribution, similar to those that accurately reproduce the observed S/F⋆ in NGC 2023, were unable to fit IC 405 for realistic values of the albedo and the phase function asymmetry parameter for the geometries studied. The presence of fluorescent H2 creating excess emission to the blue while going undetected at the resolution of the rocket experiment has been ruled out by , as S/F⋆ remains constant regardless of the relative contribution of H2 to the spectrum. More exotic explanations, such as an extended blue emission from dust, are speculative. We favor the hypothesis of differential extinction as caused by a clumpy dust distribution, which has been suggested by Mathis et al. (2002) to complicate the conclusions drawn from observations of reflection nebulae. Differential extinction along the line of sight to IC 405, such as a knot or filament of gas and dust on the sight line to HD 34078 but not crossing the path to the rest of the nebula can account for the blue rise if one assumes the obscuring material is very local to the HD 34078 line of sight. Our observations have placed an upper limit to the size of the intervening clump of 0.04 pc. If clumpy dust is responsible for the blue rise that we have found, it seems that IC 405 is the prototypical example for arguments against the use of reflection nebulae for reliable determination of dust grain properties. IC 405 appears to be a local example of the differential extinction process that takes place in starburst systems on a global scale.
References
- Bagnuolo et al. (2001) Bagnuolo, W. G., Riddle, R. L., Gies, D. R., & Barry, D. J. 2001, ApJ, 554, 362
- Blaauw & Morgan (1954) Blaauw, A. & Morgan, W. W. 1954, ApJ, 119, 625
- Burgh et al. (2002) Burgh, E. B., McCandliss, S. R., & Feldman, P. D. 2002, ApJ, 575, 240
- Burgh et al. (2001) Burgh, E. B., McCandliss, S. R., Pelton, R., France, K., & Feldman, P. D. 2001, in Proceedings of the SPIE, Vol. 4498
- Buss et al. (1995) Buss, R. H., Kruk, J. W., & Ferguson, H. C. 1995, ApJ, 454, L55+
- Calzetti (1997) Calzetti, D. 1997, AJ, 113, 162
- Calzetti et al. (1995) Calzetti, D., Bohlin, R. C., Gordon, K. D., Witt, A. N., & Bianchi, L. 1995, ApJ, 446, L97+
- Cardelli et al. (1989) Cardelli, J. A., Clayton, G. C., & Mathis, J. S. 1989, ApJ, 345, 245
- Draine (1978) Draine, B. T. 1978, ApJS, 36, 595
- Draine (2003a) —. 2003a, ARA&A, 41, 241
- Draine (2003b) —. 2003b, ApJ, 598, 1017
- Fitzpatrick & Massa (1990) Fitzpatrick, E. L. & Massa, D. 1990, ApJS, 72, 163
- Gibson & Nordsieck (2003) Gibson, S. J. & Nordsieck, K. H. 2003, ApJ, 589, 347
- Gordon et al. (2001) Gordon, K. D., Misselt, K. A., Witt, A. N., & Clayton, G. C. 2001, ApJ, 551, 269
- Gordon et al. (1994) Gordon, K. D., Witt, A. N., Carruthers, G. R., Christensen, S. A., & Dohne, B. C. 1994, ApJ, 432, 641
- Hartig et al. (1980) Hartig, G. F., Fastie, W. G., & Davidsen, A. F. 1980, Appl. Opt., 19, 729
- Henyey & Greenstein (1941) Henyey, L. C. & Greenstein, J. L. 1941, ApJ, 93, 70
- Herbig (1999) Herbig, G. H. 1999, PASP, 111, 809
- Hurwitz (1998) Hurwitz, M. 1998, ApJ, 500, L67+
- Le Petite et al. (2001) Le Petite, F., Boisse, P., Pineau des Forets, G. a nd Roueff, E., Gry, C., Andersson, B.-G., & Le Brun, V. 2001, astro-ph, 0110358, pre
- Mathis et al. (2002) Mathis, J. S., Whitney, B. A., & Wood, K. 2002, ApJ, 574, 812
- McCandliss (2003) McCandliss, S. R. 2003, PASP, 115, 651
- McCandliss et al. (1994) McCandliss, S. R., Martinez, M. E., Feldman, P. D., Pelton, R., Keski-Kuha, R. A., & Gum, J. S. 1994, in Proceedings of the SPIE, Vol. 2011
- Moos (2000) Moos, H. W. et al. 2000, ApJ, 538, L1
- Murthy et al. (1993) Murthy, J., Dring, A., Henry, R. C., Kruk, J. W., Blair, W. P., Kimble, R. A., & Durrance, S. T. 1993, ApJL, 408, L97
- Penny (1996) Penny, L. R. 1996, ApJ, 463, 737
- Rollinde et al. (2003) Rollinde, E., Boissé, P., Federman, S. R., & Pan, K. 2003, A&A, 401, 215
- Sahnow (2000) Sahnow, D. J. et al. 2000, ApJ, 538, L7
- Sasseen et al. (2002) Sasseen, T. P., Hurwitz, M., Dixon, W. V., & Airieau, S. 2002, ApJ, 566, 267
- Siegmund et al. (1993) Siegmund, O. H., Gummin, M. A., Stock, J. M., Marsh, D. R., Raffanti, R., & Hull, J. 1993, in Proc. SPIE Vol. 2006, p. 176-187, EUV, X-Ray, and Gamma-Ray Instrumentation for Astronomy IV, Oswald H. Siegmund; Ed., 176–187
- Sternberg (1989) Sternberg, A. 1989, ApJ, 347, 863
- Vijh et al. (2004) Vijh, U. P., Witt, A. N., & Gordon, K. D. 2004, ApJ, 606, L65
- Weingartner & Draine (2001) Weingartner, J. C. & Draine, B. T. 2001, ApJ, 548, 296
- Witt & Malin (1989) Witt, A. N. & Malin, D. F. 1989, ApJ, 347, L25
- Witt et al. (1993) Witt, A. N., Petersohn, J. K., Holberg, J. B., Murthy, J., Dring, A., & Henry, R. C. 1993, ApJ, 410, 714
- Witt et al. (1982) Witt, A. N., Walker, G. A. H., Bohlin, R. C., & Stecher, T. P. 1982, ApJ, 261, 492
- Wolven et al. (1997) Wolven, B. C., Feldman, P. D., Strobel, D. F., & McGrath, M. A. 1997, ApJ, 475, 835