11email: fritz@mpa-garching.mpg.de 22institutetext: 22email: wfh@mpa-garching.mpg.de
Full-star Type Ia supernova explosion models
We present full-star simulations of Type Ia supernova explosions on the basis of the standard Chandrasekhar-mass deflagration model. Most simulations so far considered only one spatial octant and assumed mirror symmetry to the other octants. Two full-star models are evolved to homologous expansion and compared with previous single-octant simulations. Therefrom we analyze the effect of abolishing the artificial symmetry constraint on the evolution of the flame surface. It turns out that the development of asymmetries depends on the chosen initial flame configuration. Such asymmetries of the explosion process could possibly contribute to the observed polarization of some Type Ia supernova spectra. tars: supernovae: general – Hydrodynamics – Methods: numerical
Key Words.:
S1 Introduction
Recent observations have shown that spectra of—at least some—Type Ia supernovae (SNe Ia) show significant polarization (e.g. Howell et al., 2001; Wang et al., 2003). The origin of this effect is still unclear, but some possible mechanisms have been proposed (Wang et al., 2003; Kasen et al., 2003, 2004). Besides peculiar spatial structures of the remnant and interaction of the ejecta with the companion star, anisotropies of the explosion process itself could contribute to the observed polarization.
This idea fits well into the currently favored astrophysical model of SNe Ia. These events are assigned to thermonuclear explosions of carbon/oxygen white dwarf (WD) stars in binary systems (for a review of SN Ia explosion models see Hillebrandt & Niemeyer, 2000). From non-degenerate companions they accrete matter until they approach the Chandrasekhar mass. After some thousand years of convective carbon burning thermonuclear reactions in the center of the star form a flame, i.e. a small spatial region undergoes thermonuclear runaway. This flame can travel outward in two modes. If it is mediated by shock waves, the propagation proceeds at supersonic velocities leading to so-called detonations, while a mediation due to heat conduction of the degenerate electrons leads to subsonic deflagrations. A prompt detonation can be excluded as a model for SNe Ia since it fails to produce the observed composition of the ashes (Arnett, 1969). It burns the entire star at high densities producing mainly iron group elements.
Consequently a mechanism has to be developed wherein the star can expand prior to incineration. This is provided if the flame propagation starts out as a deflagration. This flame propagation mode, however, is much to slow to explain SN Ia explosions. Realizing that the astrophysical scenario is characterized by Reynolds numbers as high as , one expects the development of strong turbulent features in the flow. These will interact with the flame wrinkling and stretching its surface. Since the fuel consumption rate of deflagration flames is determined by the flame surface area, turbulence will significantly accelerate the flame propagation. Three-dimensional SN Ia models (e.g. Hillebrandt et al., 2000) taking this effect into account have been shown to lead to robust explosions and reproduce many features of SNe Ia (e.g. Reinecke et al. 2002b; Gamezo et al. 2003). There have been speculations on the possibility of a later transition from the deflagration to a detonation, but a viable mechanism to trigger this transition in SNe Ia explosions could not be identified yet (Niemeyer, 1999). In any case, the deflagration stage requires thorough investigation especially in the context of asymmetries of the explosion process for it is intrinsically anisotropic. Due to buoyancy (Rayleigh-Taylor) instabilities the large scale features of the flame show rising “bubbles” of hot and light ashes and in between downdrafts of cold and dense fuel. It is still an open question, how strong the resulting asymmetries may become. This issue will be addressed in the present study.
It is clear that in order to explore asymmetries of the explosion process it is mandatory to simulate the full star. Most of the three-dimensional simulations so far have been restricted to one spatial octant assuming mirror symmetry to the other octants. Obviously, this approach imposes an artificial symmetry constraint on the flame evolution and our goal in this work is to study the effects that result from removing this symmetry. There has been only one previous simulation of the deflagration phase in the full star (Calder et al., 2004), but it failed to explode. The reason for this is presumably that it was started with very artificial conditions for the initial flame (a perfect sphere). Nevertheless, the merit of this model is that it points to the importance of the initial flame configuration in the context of asymmetries of the explosion process.
The flame ignition is difficult to address in numerical simulations and afflicted with large uncertainties (Woosley et al., 2004). We will explore the impact of initial flame configurations on the explosion models in a parametrized way. As a first step, in this study we investigate anisotropies in the flame evolution resulting from simulations covering the full star instead of only one octant and from moderately asymmetric initial flame configurations. This allows comparison with previous simulations. Detailed studies of multi-spot ignition scenarios and strongly dipolar ignited models are subject to forthcoming publications.
2 Implementation
2.1 Flame Model
The stratification of the hot and light ashes below cold and dense fuel leads to a buoyancy instability known as the Rayleigh-Taylor instability. In its non-linear stage, bubbles of burning material rise into the fuel with a velocity (Davies & Taylor, 1950)
| (1) |
where and denote the gravitational acceleration and the length scale of the bubble, respectively. The Atwood number characterizes the density contrast between the interior and the exterior of the bubbles. At the interfaces of the burning bubbles shear flows give rise to a secondary instability, the Kelvin-Helmholtz instability. It generates turbulent velocity fluctuations at this (integral) length scale , which decay to smaller scales in a turbulent cascade over a so-called inertial range and are dissipated at the Kolmogorov length. For the velocity fluctuations at some scale in the inertial range Kolmogorov-scaling yields
| (2) |
The resulting turbulent motions interact with the flame defining the deflagrations in thermonuclear supernova explosions as a problem of turbulent combustion.
The correct modeling of turbulent combustion seems to be the crucial issue in deflagration models of SNe Ia. These can greatly benefit from the substantial progress that has been made in turbulent combustion research over the past decades. A fundamental notion is that turbulent combustion proceeds in different regimes (see Damköhler (1940) and Borghi (1985); Peters (1986, 2000) for more recent work). The so-called flamelet regime of turbulent combustion applies to most parts of the deflagration in thermonuclear supernovae.
In this regime, turbulent eddies wrinkle and stretch the flame but do not penetrate its internal structure. The internal flame structure (which extends to less than a centimeter) as well as the smallest scales of flame interaction with turbulence are tiny compared with the dimensions of a WD star (). It is therefore well justified to treat the resulting “turbulent flame brush” as a discontinuity (the so-called flame front) separating the fuel from the ashes, as long as the small-scale effects are appropriately modeled.
Two approaches are taken to ensure that. First, known effects have to be taken into account. This applies mainly to the interaction of the flame with turbulence on unresolved scales. Wrinkling will increase its surface and therefore enhance the burning rate. The shortcoming in resolving the flame surface can be compensated by assigning an increased turbulent burning velocity to the flame front reproducing the correct fuel consumption rate. It turns out that in the flamelet regime the turbulent burning velocity is proportional to the turbulent velocity fluctuations and decouples completely from the laminar burning speed determined by the microphysics. Second, one may suspect that on unresolved scales new physical effects occur (like “active turbulent combustion”, Niemeyer & Woosley 1997) that affect the flame propagation on large scales. This has to be studied in separate small-scale models focusing on a narrow window in scale space. Simulations of the cellular burning regime (Röpke et al., 2003, 2004a, 2004b; Bell et al., 2004) led to the conclusion that the resulting increased burning velocity can be “renormalized” with little effect on the large scale flame propagation in most stages of the SN Ia explosion. At least from this regime drastic effects are unlikely.
Due to the expansion of the WD, the density at which burning takes place steadily decreases. This is accompanied by a gradual broadening of flame width. At some point turbulent eddies can affect the flame’s internal structure and burning enters the so-called distributed regime. Since this is expected to happen at very late stages, it may not contribute much to the production of iron group nuclei. Nevertheless, it could significantly increase the abundances of intermediate mass elements and hence the total energy release with consequences for modeling of lightcurves and spectra. This regime is not yet accessible in our code but current efforts aim at including it in future simulations. In this respect the results presented here are preliminary.
To summarize the turbulent flame propagation in thermonuclear supernova explosions we note that large-scale features are driven by buoyancy according to Eq. (1). This sets the integral scale of a turbulent cascade to smaller scales where the velocity fluctuations in the simplifying picture of Kolmogorov scaling follow Eq. (2). These velocity fluctuations determine the turbulent flame velocity which thus falls off slower toward smaller scales than the square root law of Eq. (1).
2.2 Numerical methods
The implementation of our astrophysical model in a numerical scheme uses the techniques described by Reinecke et al. (1999, 2002a). Only a brief outline will be given here.
The hydrodynamics is modeled by the reactive Euler equations. Their numerical treatment is based on the Prometheus implementation (Fryxell et al., 1989) of the Piecewise Parabolic Method (Colella & Woodward, 1984) and augmented by an equation of state for WD matter. The description of the nuclear reactions follows the simplified scheme proposed by Reinecke et al. (2002a) and comprises five species: -particles, 12C, 16O, “Mg” as a representative of intermediate mass elements, and “Ni” representing the iron group.
The propagation of the turbulent deflagration flame is modeled applying the level set technique (Osher & Sethian, 1988). Its basic idea is to associate moving fronts with the zero level set of a signed distance function , which is then propagated in an appropriate way. A modified version of this technique has been successfully used to model terrestrial deflagration flames Smiljanovski et al. (1997). We apply the so-called passive implementation of the method (for details see Reinecke et al., 1999). The propagation of the flame front via level sets requires knowledge of the flame propagation velocity, which is composed of two parts: the advection of the flame in the flow and its self-propagation due to burning. The former is handled by the hydrodynamics scheme while for the latter the -field is updated according to the turbulent burning velocity. To determine this quantity we apply a sub-grid scale turbulence model first adopted to SN Ia simulations by Niemeyer & Hillebrandt (1995).
Our approach is similar to Large Eddy Simulations (LES) known from computational fluid dynamics. The efficiency of the numerical scheme is a result of the combination of level-set techniques with a sub-grid scale model. It enables numerically converged simulations at rather crude resolutions (Reinecke et al., 2002a, c; Röpke, 2004). This makes parameter studies based on three-dimensional simulations possible (e.g. Röpke & Hillebrandt, 2004).
Besides the wide range of spatial scales, the significant expansion of the WD during the explosion complicates numerical simulations of thermonuclear supernovae. To capture this expansion, the simulations by Reinecke et al. (2002a, b, c) were carried out on a nonuniform Cartesian computational grid with fine resolution in the inner parts and an exponentially expanding grid spacing in the outer parts of the domain. This, however, causes very low resolution of the flame front in late stages, especially in directions diagonal to the axes. To overcome this problem, Röpke (2004) developed a scheme to simulate thermonuclear supernovae on an non-static uniform Cartesian computational grid which tracks the expansion of the WD. Besides a number of numerical advantages it offers a possibility to follow the evolution of the explosion to homologous expansion with only moderate additional computational expenses. Furthermore, at a given time, it provides a constant resolution throughout the domain. This is important in full-star simulations without artificial symmetries. On a non-uniform grid main features of the flame front could easily propagate in regions with poor spatial resolution. This is avoided in the co-expanding uniform grid approach. For detailed description and thorough testing of this scheme we refer to Röpke (2004).
2.3 Simulation setup
The setup used in the simulations presented below is similar to that described by Röpke (2004), except for the computational domain now covering the full WD star instead of only one octant. All simulations were carried out on a co-expanding uniform Cartesian computational grid of cells. The initial resolution was chosen to be . Reflecting boundaries were applied on all sides of the domain.
The simulations started with a cold isothermal WD star of with a central density of and a temperature of . Its initial composition was chosen as a 50% mixture of carbon and oxygen. In this configuration we placed the initial flame by instantaneously burning the material behind the front.
2.4 Initial flame configuration
A crucial parameter of thermonuclear supernova simulations is the prescription of the flame ignition. This problem is, however, difficult to tackle in explosion simulations. The formation of the initial flame front(s) is determined by about a thousand years of convective burning prior to thermonuclear runaway. There have been only few attempts to investigate the ignition conditions (Garcia-Senz & Woosley, 1995; Woosley et al., 2004) and these conclude that flame formation is likely to proceed in a number of burning “bubbles” that may rise to distances up to from the center before the runaway.
Initial flame configurations have to be represented on the rather coarse computational grids used in multidimensional thermonuclear supernova simulations. Several possibilities for this have been suggested in literature. In the simplest approach one starts out with a flame front in form of a single sphere (e.g. Gamezo et al., 2003). In this case, however, the high initial symmetry is broken by numerical noise and it takes a substantial amount of computer time until the first Rayleigh-Taylor features develop. This is probably not a very realistic scenario, since the multitude of burning bubbles predicted by Woosley et al. (2004) provides seeds for the development of nonlinear buoyancy instabilities from the very beginning of the flame propagation. Therefore one may start out with a sphere on which perturbations are imposed, such as the c3 model of Reinecke et al. (2002a). A better approximation is provided by multi-spot ignition scenarios (Reinecke et al., 2002b), where some burning bubbles are initialized which, due to the lack of resolution, represent a collection of real flame spots. Here, the problem is, however, that a rather high resolution is required to accommodate a decent number of burning bubbles (note that the high resolution is not necessarily required for numerical convergence). The models in this paper comprise computational cells per octant rendering reasonable multi-spot ignition scenarios impossible. Therefore we chose to represent the initial flames in one of our simulations by a cluster of bubbles. These overlap in the center while some of them float detached from the bulk. The result is a clumpy or foam-like initial flame structure which we think provides a reasonable approach given the restricted computational resources.
Since the initial flame configurations turn out to be a crucial parameter for the simulations, we will now describe our models in detail.
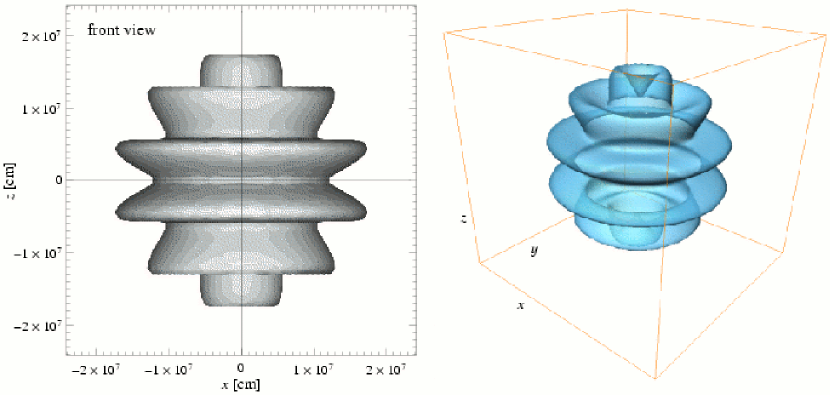
As a standard test case Reinecke et al. (2002a) established the c3 model which is very simple and allowed the comparison of two- and three-dimensional simulations (see Reinecke et al., 2002a). Here the initial flame is represented by a sphere which is perturbed by a superposition with toroidal rings. This configuration is visualized in Fig. 1, where the isosurface corresponds to representing the flame front. We will denote the full-star version presented here c3_4. Obviously, the center of the initial flame coincides with the center of the WD in this model.
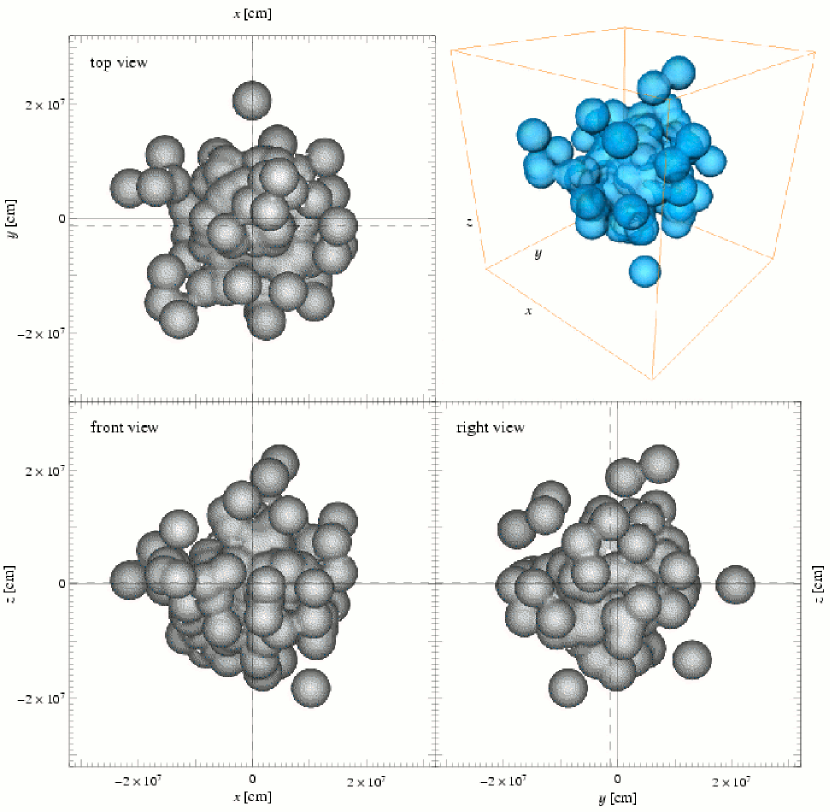
A second initial flame configuration was obtained by the superposition of a number of bubbles around the center of the WD star. The radius of the bubbles was set to and their locations were chosen in a random selection process under the constraint of a Gaussian distribution around the center with a dispersion of . The resulting configuration is depicted in Fig. 2. We will refer to the corresponding model as f1 in the following. Note that the flame distribution resulting from the random selection of locations is not symmetric and that the outermost flame spots are located at a distance of from the center in agreement with Woosley et al. (2004). Resulting from the random choice of a limited number of “bubbles”, the center of the initial flame is displaced by from the center of the WD, i.e. it is located at a distance of off-center.
3 Morphology of the flame evolution
Analyzing the results of our simulations, we will first describe the flame evolution in our models. Global characteristics of the explosions will be discussed in Sect. 4.
3.1 Effects from removing the symmetry constraints
Röpke (2004) applied a c3 flame ignition condition for a demonstration of the co-expanding grid approach in three dimensions. There only one octant was simulated assuming mirror symmetry to the other octants. We will now compare this simulation (denoted c3_oct) with our c3_4 full-star simulation. Although the c3 initial flame shape is not a realistic scenario, this model offers a way to assess possible differences in the full star implementation.
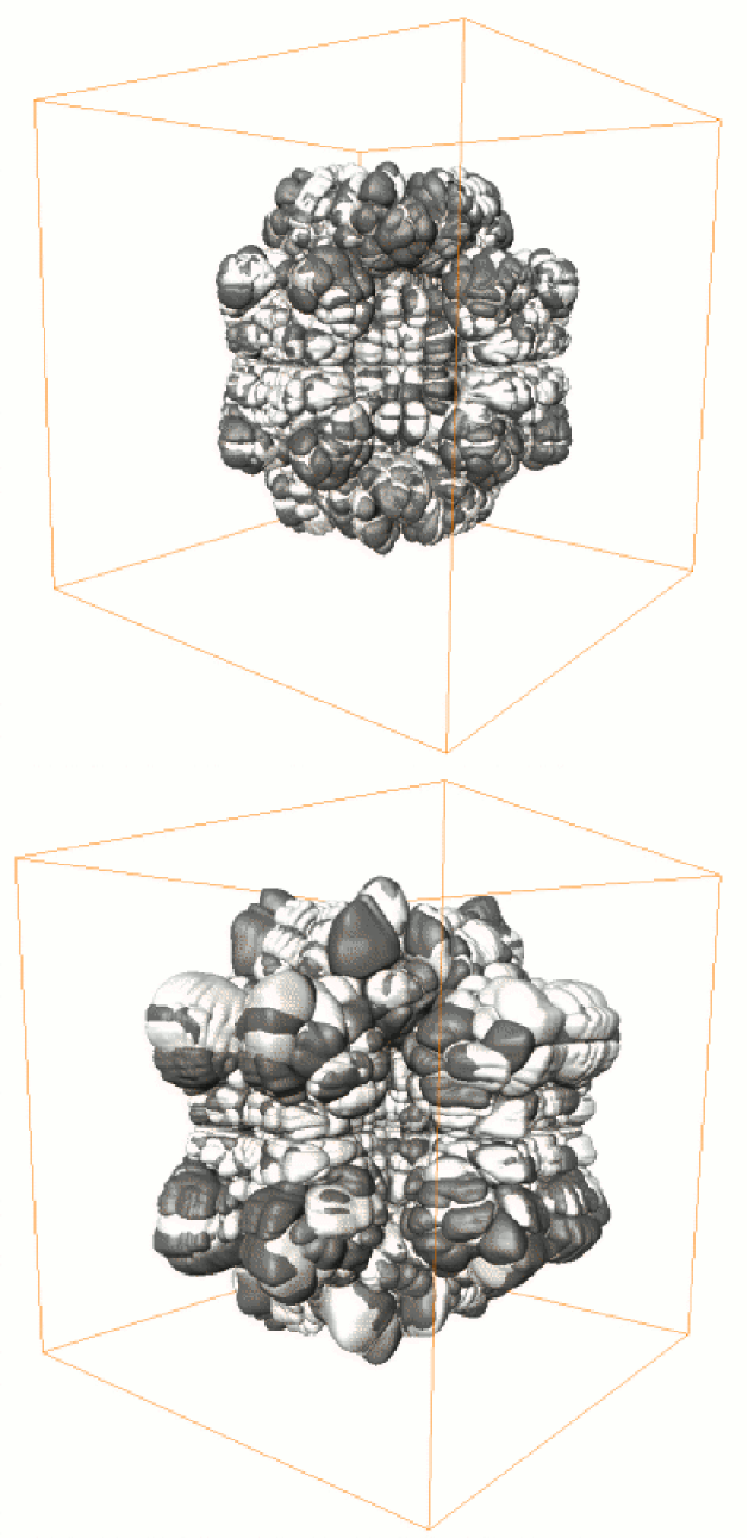
A comparison of the flame shapes at and at is given in Fig. 3. The isosurfaces again represent , which is associated to the flame front at early times, while at later times when the burning has ceased it still provides a good approximation to the interface between fuel and ashes (cf. Röpke, 2004). Fig. 3 shows that the evolutions of the flame structures of the c3_oct simulation (here mirrored to the other octants) and the full-star model proceed very similar. The isosurface in the full-star simulation is in close agreement with the octant symmetry of the c3_oct model, even after an evolution time of . Obviously, the axial symmetry of the initial flame front is broken in the same way in the two implementations. It turns out, that this happens preferentially at locations where the flame front is aligned diagonal to the computational cells of the Cartesian grid indicating that the symmetry breaking is induced by discretization effects.
It seems appropriate to point out that the deflagration SN Ia model does not develop new large-scale features when the computational domain is extended to the full star. Unlike convective burning phenomena (e.g. pre-ignition evolution of a WD toward a SN Ia, see Woosley et al. 2004, or core-collapse supernovae, see Scheck et al. 2004) our models form no global dipole-asymmetries. The reason for this is that the rapid propagation of the burning front does not allow several eddy turnovers which seem to be crucial for the development of such configurations. We also find no indication for the development of larger plume structures in the c3_4 simulation than in the c3_oct model.
Thus, as long as the initial conditions (especially the initial flame configurations) do not violate the mirror symmetry, it is safe to restrict the simulations to a single spatial octant. Also for our full-star models the result is encouraging since it proves that they are able to preserve initial symmetries, without explicitly imposing those by symmetries of the domain. This verifies our full-star implementation. Hence asymmetries as described below are of physical nature and not a numerical artifact.
3.2 Effects of asymmetric initial flame configurations
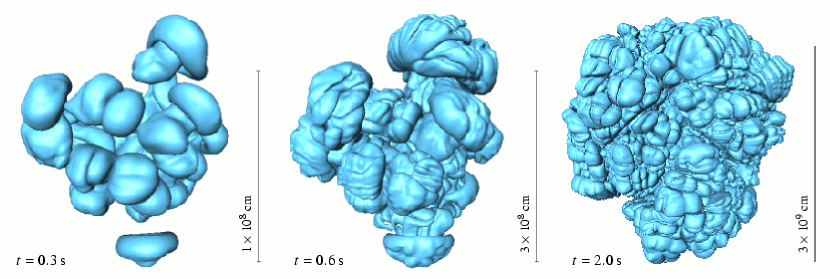
We will now address the question how the SN Ia explosion proceeds if the initial flame configuration does not possess any symmetry. This is the case for our f1 model. Starting from the initial flame configuration shown in Fig. 2, the evolution of the flame front in the explosion process is illustrated by snapshots of the isosurface at , , and in Fig. 4.
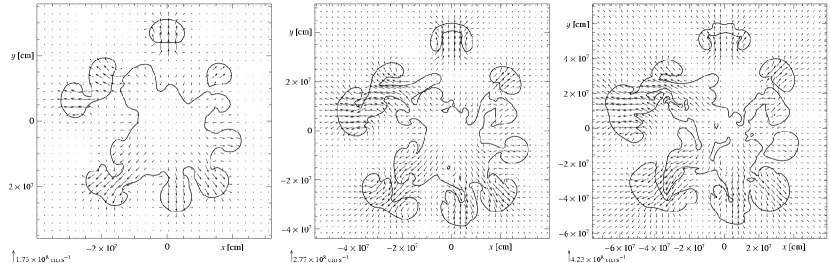
The development of the flame shape from ignition to is characterized by the well-known “mushroom-like” structures resulting from buoyancy. This is especially well visible for the bubbles that were detached from the bulk of the initial flame. But also the perturbed parts of the contiguous flame closer to the center develop nonlinear Rayleigh-Taylor like features. This flame evolution generates strong vortices in the resolved flow field, illustrated by the temporal evolution of the velocities in a two-dimensional slice in Fig. 5. The order of magnitude of the resulting velocities is in agreement with Eq. (1), given the length scale of the buoyant structures of , a gravitational acceleration of about , and an Atwood number of the order of . Due to the multitude of ascending structures, the flow pattern is strongly irregular.
During the following flame evolution inner structures of smaller scales catch up with the outer “mushrooms” and the separated structures merge forming a more closed configuration (see snapshot at of Fig. 4). This is a result of the large-scale flame advection in the turbulent flow and the expansion of the ashes.
Up to this stage the flame was strongly anisotropic. However, in the later evolution a preferentially lateral growth of bubbles filled with ashes smooths out parts of the anisotropies. As this effect continues to act even after the burning has ceased in our model, it is of hydrodynamic origin rather than caused by flame propagation. The flame develops a more spherical shape and only a slight anisotropy is retained. This is apparent from the snapshot at in Fig. 4. At the stage depicted there self-propagation of the flame due to burning has terminated.
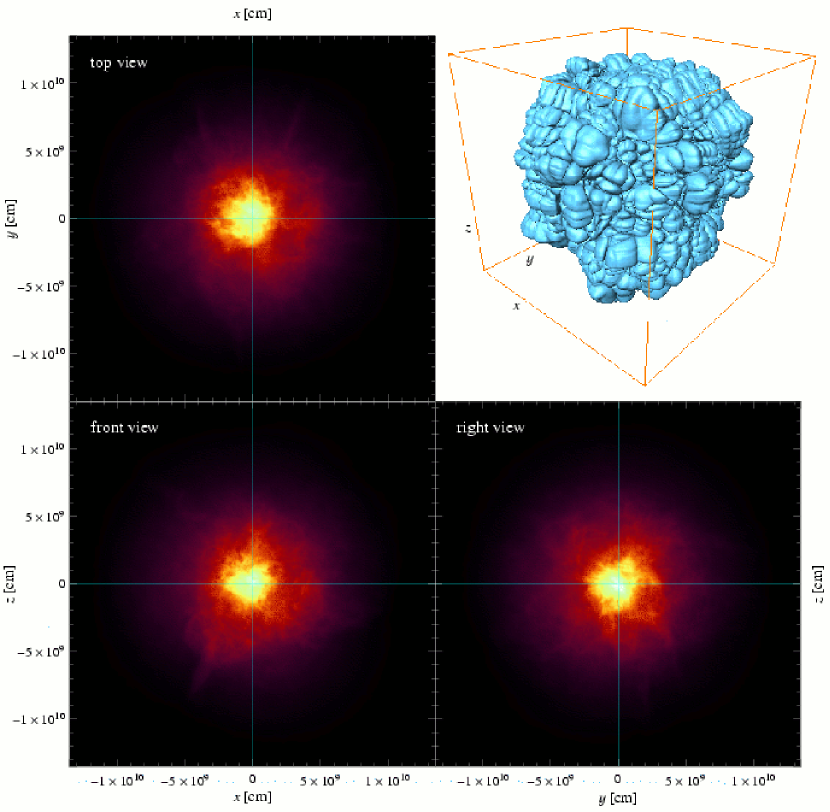
The subsequent evolution is characterized by the approach to homologous expansion which is reached to a good approximation at (Röpke, 2004). A snapshot corresponding to is shown in Fig. 6. The differences to the snapshot at in Fig. 4 are small, but the smoothing effect has rounded the structure somewhat further. This confirms the assumption that it is caused by the hydrodynamics.
It is interesting to note that the f1 model, though it possesses a slight large-scale asymmetry, finally develops a smoother surface of ashes than the c3_4 model (compare the snapshots at in Figs. 3 and 6). This can be attributed to the fact that the amplitude of large-scale perturbations (interpreted as deviations from a spherical shape) in the f1 initial flame is smaller, although it is more perturbed on small scales.
An important aspect of full-star simulations are the resulting asymmetries in the density distribution. An impression of these is given by the projections of the density to the coordinate planes in Fig. 6. The central high-density region is aspherical and also in the outer regions filaments of increased density are visible. These result from downdrafts of dense fuel between bubbles of light ashes during the explosion.
Despite the slight initial misalignment of the centers of the WD and the flame, we observe no buoyancy-driven ascension of the flame as a whole toward the surface. For this a large-scale flow around the flame structure would be necessary. Such a flow-structure can, however, not develop since our initial flame configuration causes an irregular vortical velocity field, which dominates the flame advection. We emphasize here, that this large-scale effect is not caused by the self-propagation of the flame and should thus be independent of the particular turbulent flame model.
| model | (“Ni”) | (“Mg”) | ||
|---|---|---|---|---|
| c3_4 | 0.507 | 0.151 | 4.275 | 9.466 |
| f1 | 0.579 | 0.165 | 5.585 | 10.776 |
4 Global parameters of the explosion models
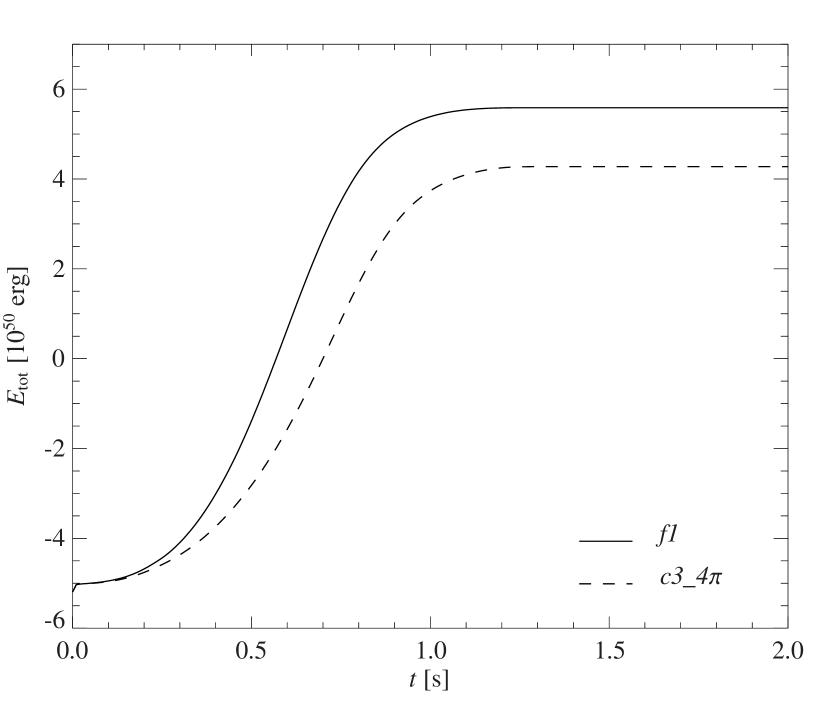
The global characteristics of the models are summarized in Table 1. It is obvious that the f1 initial flame configuration leads to a more vigorous explosion than the c3_4 model. It produces 14% more iron group elements and consequently the release of nuclear energy is 14% higher. This amounts to a 31% increase in the total explosion energy. The excess in produced intermediate mass nuclei is only 9% and thus the relative fraction of these is lower in the f1 model. The temporal evolutions of the total energies in our simulations are plotted in Fig. 7.
Two aspects of the f1 model contribute to the more energetic explosion. First, the initial flame configuration extends to slightly larger radii than the c3_4 initial flame (compare Figs. 1 and 2). Therefore the outer flame fronts experience a larger gravitational acceleration and the development of structures resulting from buoyancy instabilities is accelerated. This leads to an enhanced generation of turbulence and consequently the value of the turbulent flame propagation velocity is higher. Hence more material is burnt at higher densities resulting in iron group nuclei.
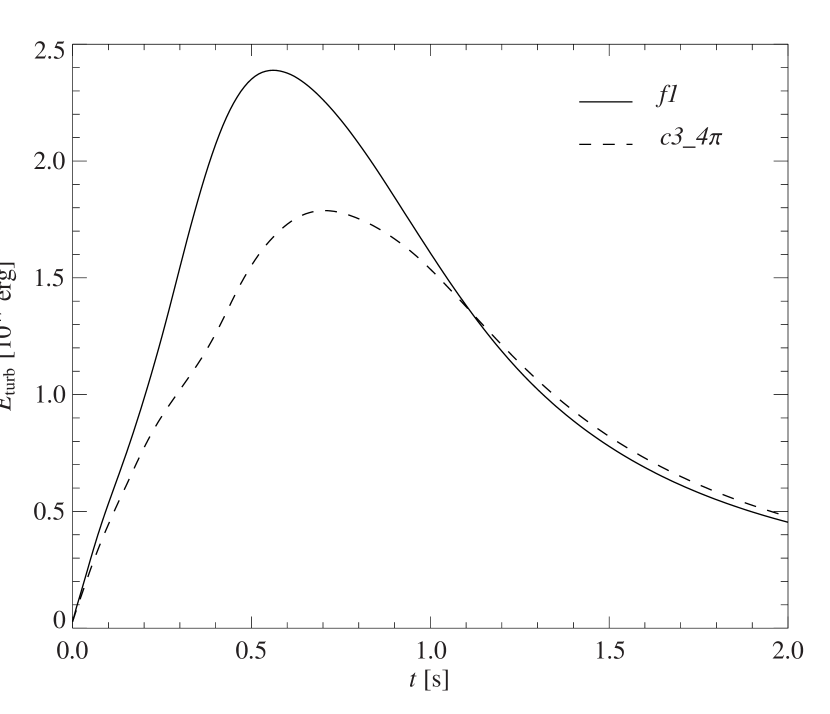
Second, due to its composition of small bubbles the initial flame shape of the f1 model is perturbed with shorter wavelengths. This provides more seeds for the development of buoyancy instabilities and consequently the wrinkling of the flame is is enhanced resulting in an increased fuel consumption. Contrary to that, in the c3_4 model it takes some time until the axial symmetry is broken and “mushroom-like” structures form. The f1 model therefore seems more appropriate to mimic realistic initial flame structures (perturbed by convective motions and eventually igniting in multiple spots) on coarse computational grids. The evolutions of the turbulent energies in both simulations are plotted in Fig. 8, showing clearly the enhanced turbulence production in the f1 model. Since the turbulent burning velocity scales with the turbulent velocity fluctuations, the flame propagates faster in that model.
Synthetic light curves and spectra derived from explosion models are largely determined by the distribution of the ejecta in velocity space. However, the interpretation of these data is not straightforward and requires caution. One of the former main uncertainties in analyzing the results from three-dimensional explosion simulations, namely the short simulation time, could be overcome in the models presented here. On the co-expanding computational grid they were evolved to providing a fair approximation to homologous expansion (Röpke, 2004). However, most of the currently available numerical codes treat the radiation transport one-dimensional. One should keep in mind, that multidimensional structures (cf. Fig.6) could considerably change the results from three-dimensional synthetic light curve and spectra calculations depending on the line of sight.
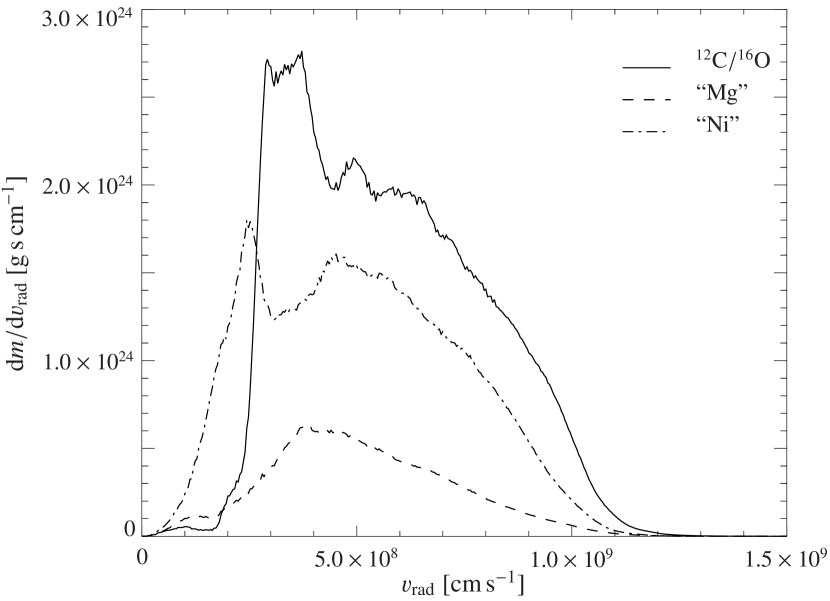
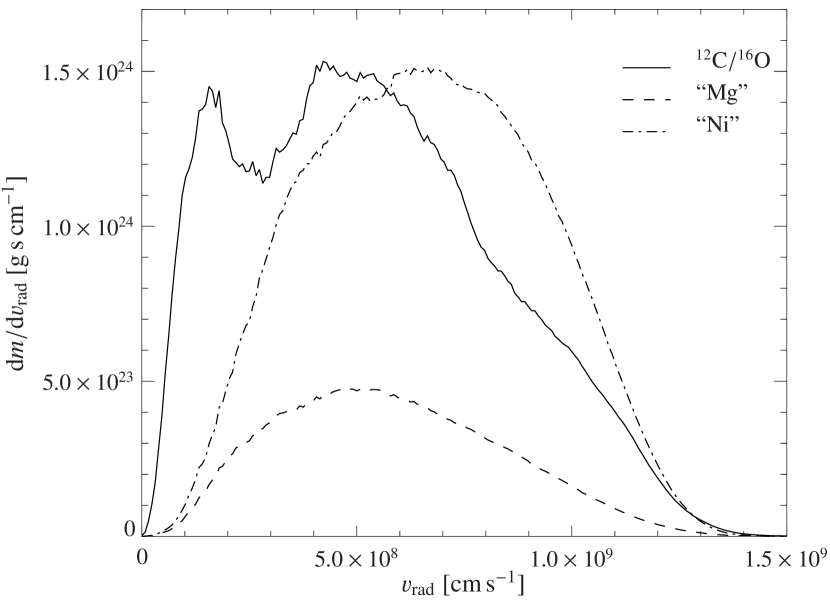
In Figs. 9 and 10 we present the angular averaged profiles of the velocity distribution of the ejecta. These figures show clearly that both explosion models are too weak to accelerate the outer ejecta to the highest observed velocities (see for example the velocities of the Si ii, S ii and Ca ii lines given by Benetti et al., 2004). While they reach to in the c3_4 model, the outermost ejecta of the f1 model are found at velocities of .
Due to the close similarity of the c3_4 simulation to the c3 model calculated in only one octant, the distribution of the species in the ejecta shows no visible differences (compare with the analogous plot for the c3 model of Röpke, 2004). However the deviations from the the profiles given by Reinecke et al. (2002b) are significant, especially at higher velocities. This is simply due to the fact, that we evolved the model to , while former simulations stopped at where homologous expansion is not yet reached (Röpke, 2004). At the distribution of the elements is quite uniform, but this is not retained in the approach to homologous expansion. The later accumulation at lower velocities can probably be attributed to the still non-negligible gravitational potential.
A feature of the c3 model seems to be that little fuel is left at the center of the star. For this, a possible explanation would be that with the given initial flame configuration it takes longer to break the axial symmetry. True three-dimensional features with “mushroom-like” bubbles of ashes and downdrafts of fuel form later. Therefore less unburnt material sinks down to the center.
This is different in the species distribution of the f1 model shown in Fig. 10. Here the higher amount of unprocessed material near the center can be attributed to the accelerated development of the typical buoyancy-induced flame structures. The earlier formation of downdrafts transports unburnt matter more efficiently toward the center. However, this effect may be partly compensated when the model is started from a true multi-spot ignition scenario (cf. to the b30 model of Travaglio et al., 2004). In this case the increased surface of the flame near the center leads to a more efficient burning. A possible temporal distribution of the formation of initial flames would also favor an enhanced burning near the center.
A second difference between our two models is the distribution of iron group nuclei (denoted as “Ni”). The accelerated flame evolution and the stronger explosion mix these elements further out in the f1 simulation. A similar, but weaker effect can be observed for the intermediate mass nuclei (“Mg”). The low production of intermediate mass elements in both models is in part due to the small computational grid applied in the simulations. Naturally, subsequent stages of the burning are less resolved in the co-expanding grid approach. By means of a resolution study Röpke (2004) found that starting with cells per octant provides sufficient resolution in the early stages of flame propagation when iron group nuclei are synthesized. However, the later production of intermediate mass elements may be underestimated by about 50% due to the coarse resolution of the flame. This, in turn, leads to a somewhat lower total energy of the models. Also the lower relative production of intermediate mass elements in the f1 simulation may partially be caused by a resolution effect. Since this model explodes more vigorously, the WD expands faster. The computational grid tracking the expansion will therefore be coarser at the stages of intermediate mass element production in the f1 model than in the less energetic c3_4 simulation.
5 Conclusions
We presented two full-star simulations of deflagration models for thermonuclear supernova explosions. These were started with different initial flame configurations. Both simulations resulted in robust explosions, though they were rather on the weak side compared with observations. The models allowed an analysis of the effects of removing the artificial symmetries of former simulations. The c3_4 model retained the axial symmetry of our standard c3 example although it was calculated on a full-star domain. We note that the abolishment of the domain-symmetries alone does not introduce any additional asymmetries to the model. This result validates previous single-octant simulations (e.g. Reinecke et al., 2002a, b, c; Röpke & Hillebrandt, 2004) since it shows that the symmetry constraint imposed there did not suppress physical effects.
To introduce asymmetries into our models it is necessary to start with an asymmetric initial flame configuration. This was realized by the “foamy” initial flame surface of the f1 simulation. Starting the flame propagation with such an anisotropic configuration leads to asymmetries in the ejecta. However, the initial asymmetries are partially smoothed out by the expansion of the ash-filled bubbles, which in late phases proceeds preferentially in lateral directions. To what degree the retained asymmetry could contribute to the polarization of the spectrum remains to be tested by multidimensional radiative transfer calculations.
As a consequence of the perturbed initial flame shape an irregular flow pattern establishes. This has strong impact on the flame evolution. In the f1 simulation two effects are noted. First, small bubbles in the initial flame configuration that were detached from the bulk merge with it shortly after ignition resulting in a more or less connected flame structure. Second, the model is robust against slight misalignments of the centers of the flame and the WD. No buoyancy driven rise of the flame as a whole toward the surface of the star was observed. This is in contrast to the result of Calder et al. (2004), who found that the flame quickly ascends from the center although the initial misalignment was somewhat smaller than in our f1 model. The reason thereof seems to be that Calder et al. (2004) started with flame in shape of a perfect sphere. This configuration possesses no seeds for the development of Rayleigh-Taylor instabilities which consequently have to be introduced by numerical effects. Therefore the establishment of a vortical velocity field is delayed and a symmetric large-scale flow may develop driving the flame to larger radii. Differences in the flame models could also effect the results, but seem unlikely to be the primary reason for the discrepancy. While Calder et al. (2004) use the flame model of Gamezo et al. (2003) which is based on the assumption of a buoyancy dominated scaling according to Eq. (1), we model the turbulent flame speed taking into account the interaction of the flame with turbulence on unresolved scales. From Eq. (2) it is clear that this results in a slower decrease of the flame speed toward smaller scales.
In this first study only one anisotropic initial flame configuration was tested. Open questions remain regarding the flame evolution in case of stronger initial asymmetries, especially more pronounced dipole shapes. How robust are the models to stronger displacements of the initial flame from the center? What asymmetries can then result from deflagration models? An extreme case would be a one-sided ignition which was suggested by Woosley et al. (2004). Such models will be addressed in a forthcoming study.
Acknowledgements.
We would like to thank M. Reinecke for helpful discussions. This work was supported in part by the European Research Training Network “The Physics of Type Ia Supernova Explosions” under contract HPRN-CT-2002-00303. We thank the Institute for Nuclear Theory at the University of Washington for its hospitality during the summer program on Supernovae and Gamma Ray Bursts (INT-04-2), where this paper was completed. Discussions with the participants of the summer program inspired some of the work presented here.References
- Arnett (1969) Arnett, W. D. 1969, Astrophys. Space Sci., 5, 180
- Bell et al. (2004) Bell, J. B., Day, M. S., Rendleman, C. A., Woosley, S. E., & Zingale, M. 2004, ApJ, 606, 1029
- Benetti et al. (2004) Benetti, S., Meikle, P., Stehle, M., et al. 2004, MNRAS, 348, 261
- Borghi (1985) Borghi, R. W. 1985, in Recent advances in the aerospace sciences, ed. C. Casci (New York: Plenum Publishing Corporation), 117–138
- Calder et al. (2004) Calder, A. C., Plewa, T., Vladimirova, N., Lamb, D. Q., & Truran, J. W. 2004, preptint available: astro-ph/0405126
- Colella & Woodward (1984) Colella, P. & Woodward, P. R. 1984, J. Comp. Phys., 54, 174
- Damköhler (1940) Damköhler, G. 1940, Z. f. Elektroch., 46, 601
- Davies & Taylor (1950) Davies, R. M. & Taylor, G. 1950, Proc. Roy. Soc. London A, 200, 375
- Fryxell et al. (1989) Fryxell, B. A., Müller, E., & Arnett, W. D. 1989, Hydrodynamics and nuclear burning, MPA Green Report 449, Max-Planck-Institut für Astrophysik, Garching
- Gamezo et al. (2003) Gamezo, V. N., Khokhlov, A. M., Oran, E. S., Chtchelkanova, A. Y., & Rosenberg, R. O. 2003, Science, 299, 77
- Garcia-Senz & Woosley (1995) Garcia-Senz, D. & Woosley, S. E. 1995, Astrophys. J., 454, 895
- Hillebrandt & Niemeyer (2000) Hillebrandt, W. & Niemeyer, J. C. 2000, Annu. Rev. Astron. Astrophys., 38, 191
- Hillebrandt et al. (2000) Hillebrandt, W., Reinecke, M., & Niemeyer, J. C. 2000, in Proceedings of the XXXVth rencontres de Moriond: Energy densities in the universe, ed. R. Anzari, Y. Giraud-Héraud, & J. Trân Thanh Vân (Thế Giói Publishers), 187–195
- Howell et al. (2001) Howell, D. A., Höflich, P., Wang, L., & Wheeler, J. C. 2001, ApJ, 556, 302
- Kasen et al. (2004) Kasen, D., Nugent, P., Thomas, R. C., & Wang, L. 2004, ApJ, 610, 876
- Kasen et al. (2003) Kasen, D., Nugent, P., Wang, L., et al. 2003, ApJ, 593, 788
- Niemeyer (1999) Niemeyer, J. C. 1999, Astrophys. J. Lett., 523, L57
- Niemeyer & Hillebrandt (1995) Niemeyer, J. C. & Hillebrandt, W. 1995, Astrophys. J., 452, 769
- Niemeyer & Woosley (1997) Niemeyer, J. C. & Woosley, S. E. 1997, Astrophys. J., 475, 740
- Osher & Sethian (1988) Osher, S. & Sethian, J. A. 1988, J. Comp. Phys., 79, 12
- Peters (1986) Peters, N. 1986, in Twenty-First Symposium (International) on Combustion (Pittsburgh: The Combustion Institute), 1231–1250
- Peters (2000) Peters, N. 2000, Turbulent Combustion (Cambridge: Cambridge University Press)
- Reinecke et al. (2002a) Reinecke, M., Hillebrandt, W., & Niemeyer, J. C. 2002a, Astron. Astrophys., 386, 936
- Reinecke et al. (2002b) Reinecke, M., Hillebrandt, W., & Niemeyer, J. C. 2002b, Astron. Astrophys., 391, 1167
- Reinecke et al. (1999) Reinecke, M., Hillebrandt, W., Niemeyer, J. C., Klein, R., & Gröbl, A. 1999, Astron. Astrophys., 347, 724
- Reinecke et al. (2002c) Reinecke, M., Niemeyer, J. C., & Hillebrandt, W. 2002c, New Astronomy Review, 46, 481
- Röpke (2004) Röpke, F. K. 2004, submitted to A&A, preprint available: astro-ph/0408296
- Röpke & Hillebrandt (2004) Röpke, F. K. & Hillebrandt, W. 2004, A&A, 420, L1
- Röpke et al. (2004a) Röpke, F. K., Hillebrandt, W., & Niemeyer, J. C. 2004a, A&A, 420, 411
- Röpke et al. (2004b) Röpke, F. K., Hillebrandt, W., & Niemeyer, J. C. 2004b, A&A, 421, 783
- Röpke et al. (2003) Röpke, F. K., Niemeyer, J. C., & Hillebrandt, W. 2003, Astrophys. J., 588, 952
- Scheck et al. (2004) Scheck, L., Plewa, T., Janka, H.-T., Kifonidis, K., & Müller, E. 2004, Physical Review Letters, 92, 011103
- Smiljanovski et al. (1997) Smiljanovski, V., Moser, V., & Klein, R. 1997, Combustion Theory and Modelling, 1, 183
- Travaglio et al. (2004) Travaglio, C., Hillebrandt, W., Reinecke, M., & Thielemann, F.-K. 2004, A&A, in print, preprint available: astro-ph/0406281
- Wang et al. (2003) Wang, L., Baade, D., Höflich, P., et al. 2003, ApJ, 591, 1110
- Woosley et al. (2004) Woosley, S. E., Wunsch, S., & Kuhlen, M. 2004, ApJ, 607, 921