Kinematics of Diffuse Interstellar Clouds :
Recent GMRT Results
Abstract
A high latitude HI 21 cm-line absorption survey toward extragalactic sources was recently completed using the Giant Meterwave Radio Telescope (GMRT). A total of 104 sources with b 15 o and with a 21 cm flux density greater than 1 Jy were observed for 120 hours. With an optical depth detection limit of 0.01 this is the most sensitive high-latitude survey as yet. Most of the detected HI 21 cm-line absorption features belong to a population with a velocity dispersion of 7.6 km s-1. These are the ’standard’ HI clouds and have been well-studied for decades. However, we also detect a second population of absorbing clouds with a velocity dispersion of 21 km s-1. About 20 of the total population of absorbing clouds belong to this population. This new population of ’fast’ clouds can be identified with a similar velocity dispersion Ca II absorbing clouds and with the Halo clouds recently detected in HI emission from Green Bank.
keywords:
ISM: clouds, kinematics and dynamics – Radio lines : ISM1 Introduction
Observations carried out more than five decades ago of interstellar absorption lines of neutral sodium (NaI) and singly ionized calcium (CaII) toward early type stars revealed several discrete absorption features (Adams 1949, Blaauw 1952, Siluk and Silk 1974). These observations and their subsequent analysis led to the ’cloudy’ picture of the interstellar medium in which each of the discrete absorption lines was associated with a concentration of gas. Subsequent HI 21 cm-line surveys of the Galaxy and theoretical studies led to the two-component model of the interstellar medium in which dense, cold HI concentrations are in pressure equilibrium with the diffuse, warm intercloud medium (Field, Goldsmith, & Habing 1969, Clark, Radhakrishnan, & Wilson 1962, Clark 1965, Radhakrishnan et al. 1972). The current picture of the interstellar medium is the three component model where the third component is the tenuous, hot coronal gas created largely due to the supernova activity (McKee & Ostriker 1977, Wolfire et al. 1995).
Although a consistent picture of the ISM has evolved over the years, there are some unresolved issues concerning the ’clouds’ detected in the absorption lines of NaI and CaII. Consider Fig. 1 which shows a histogram of the radial velocities of discrete components observed in the direction of 64 stars from the data in Siluk and Silk (1974). Since most of these stars are nearby ( 500 pc) the radial velocities of the absorbing features are essentially due to the random motions of the clouds. The distribution of the low velocity features can be approximated well by the Gaussian shown (Fig. 1). These ’slow’ clouds were detected in HI 21 cm-line absorption and emission and have mean values of HI column densities of 3 1020 cm-2, spin temperatures of 80 K and volume densities of 20 cm-3 (Spitzer 1978). There are 4 such concentrations per kpc. These slow clouds have an effective scale height of 250 pc and are the ’standard’ HI clouds. The higher velocity features (fast clouds) were not detected either in HI absorption or in HI emission. These fast clouds also showed anomalous ratios of the column density of sodium to singly ionized calcium. This ratio was less than 1 for the fast clouds while significantly greater than 1 for the slow clouds (Routly & Spitzer 1952). If the fast clouds were shocked clouds, calcium which is normally locked in grains will be released to the gas in such clouds, resulting in the observed lower values of the NaI / CaII ratios. Such shocked clouds could be expected to be of lower HI column density and of higher spin temperature resulting in lower optical depth for absorption in the HI 21 cm-line ( Radhakrishnan & Srinivasan 1980, Rajagopal, Srinivasan & Dwarakanath 1998). Such fast clouds might also go undetected in HI emission due to their lower column densities.
The motivation for the survey carried out with the Giant Meterwave Radio Telescope (GMRT) was to detect such a population of fast clouds in HI 21 cm-line absorption. The basic idea was to build a histogram for the local HI clouds similar to the one shown in Fig. 1. Such a study can compare the fast clouds detected so far only in the absorption lines of NaI and CaII with those detected in HI 21 cm-line absorption.
2 Observations
Extragalactic radio sources unresolved in the Very Large Array B-configuration and with their 21 cm flux densities greater than 1 Jy were selected. The magnitude of the Galactic latitudes of the sources were restricted to be more than 15o to avoid the confusion caused by HI absorption in the plane and to enhance the chances of detection of local clouds in HI absorption. A total of 104 sources were selected which are distributed rather uniformly in the Galactic longitude and latitude. The observations were carried out using the GMRT during the months of March-April, 2000 and April-June, 2001. About 120 hours of observations were carried out. At a velocity resolution of 3.3 km s-1 the detection limit in optical depth was 0.01 (3). This is the most sensitive high latitude HI absorption survey to-date.
3 Results
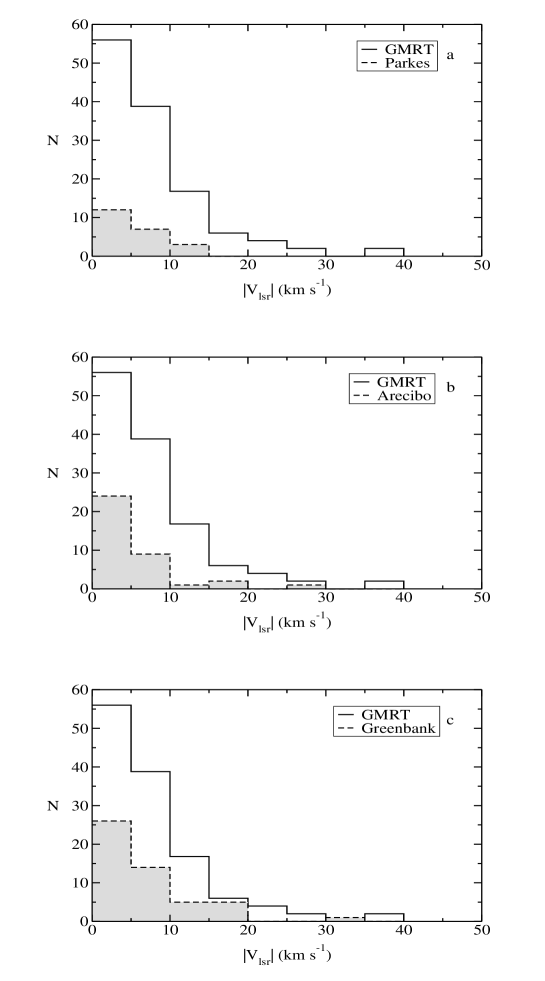
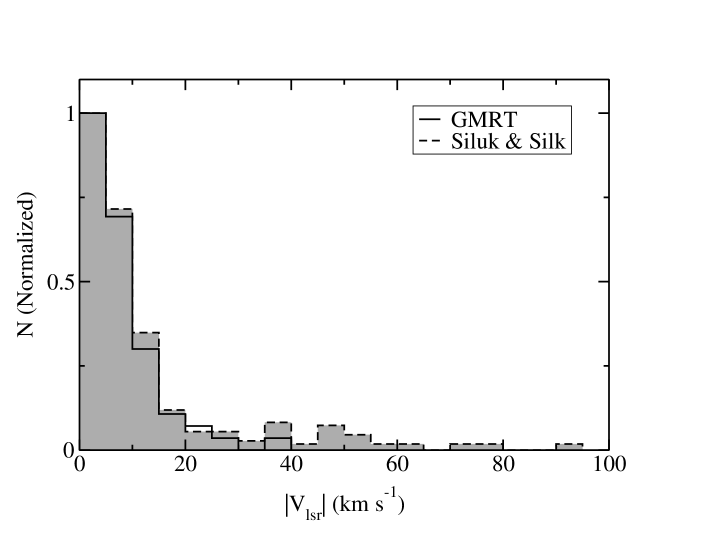
An example HI absorption spectrum along with the corresponding HI emission spectrum from the Leiden Dwingeloo Sky Survey (Hartmann & Burton 1995) is shown in Fig. 2. Multiple Gaussian components were fitted to both the absorption and the corresponding emission spectra and discrete components were identified. All the spectra and the components identified are presented elsewhere. A total of 120 discrete absorption features were detected in the survey. A histogram of these features is compared with some of the earlier HI absorption surveys in Fig. 3. The significantly larger number of HI absorption components detected in the present survey due to its lower detection limit in optical depth is evident. It is also evident that the current survey has detected larger number of clouds at larger random velocities than the earlier surveys. A normalised histogram of the HI absorbing clouds from the GMRT survey is shown in comparison to that of the data from Siluk and Silk (1974) in Fig. 4. The histogram of HI clouds now clearly has a high velocity tail extending up to 40 km s-1 and looking more like the histogram of clouds detected in optical absorption lines.
The histogram of HI clouds is best fit by two Gaussians with velocity dispersions of 7.6 0.3 km s-1 and 21 4 km s-1 respectively (Fig. 5). The total number of fast clouds (V 15 km s-1) is about 20% of the total number detected in the survey. The mean optical depth of these fast clouds is 0.04 0.02 with a mean spin temperature of 125 82 K and a mean HI column density of (4.3 3.4) 1019 cm-2. The HI column density estimates were made from the spectra obtained from the Leiden Dwingeloo Sky Survey (Hartmann & Burton 1995). The column densities of these discrete components (NHI) are plotted against their velocities in Fig. 6.
4 Discussion
The nature of the clouds in the high velocity tail first detected in the histogram of optical absorption lines (Fig. 1) is now clearer. The sensitive, high latitude, HI 21 cm-line absorption survey from the GMRT has detected some of these fast clouds. These fast clouds have three times larger velocity dispersion and ten times lower column densities compared to the slow clouds as might be expected if they were from a shocked population of clouds. The decrease in the HI column densities of the fast clouds as a function of their random velocities (Fig. 6) is also consistent with this scenario. The shocked HI clouds are also expected to be warmer than the slow clouds. The mean spin temperature of the fast clouds detected in the GMRT survey is not significantly higher than that of the standard slow clouds. However, this might be a selection effect since for a given optical depth detection limit and an HI column density, clouds with lower spin temperature will be preferentially detected.
The fast clouds with three times higher dispersion are expected to have a scale height about ten times larger compared to the slow HI clouds. Given an effective thickness of 250 pc for the slow clouds, the fast clouds can have an effective thickness of 2.5 kpc. The fast clouds can be part of the halo of the Galaxy. Recent HI emission studies using the Greenbank telescope have led to the discovery of a population of discrete HI clouds in the Galactic halo with a velocity dispersion similar to that of the fast clouds reported here (Lockman 2002). The fast clouds, once detected only in optical absorption lines, have now been detected in both HI absorption and emission leading to a clearer picture of the interstellar medium. Further details of the GMRT HI absorption survey and the data analysis as well as a more elaborate discussion of the results are found in Mohan, Dwarakanath & Srinivasan (2004a,b).
Acknowledgements
This article is a written version of the invited talk presented in the two-day workshop held at the National Centre for Radio Astrophysics (Pune) during March 22 - 23, 2004 in honor of Prof. Govind Swarup’s seventy fifth birthday. The results presented here form part of the PhD Thesis of Rekhesh Mohan (2003).
References
- [1] Adams, W. A. 1949, ApJ, 109, 354.
- [2] Blaauw, A. 1952, BAN, 11, 459.
- [3] Clark, B. G., Radhakrishnan, V., & Wilson, R. W. 1962, ApJ, 135, 151.
- [4] Clark, B. G. 1965, ApJ, 142, 1398.
- [5] Dickey, J. M., Salpeter, E. E., Terzian, Y. 1978, ApJSS, 36, 77.
- [6] Field, G. B., Goldsmith, D. W., Habing, H. J. 1969, ApJ, 155, L149.
- [7] Hartmann, D., Burton, W. B. 1995, An Atlas of Galactic Neutral Hydrogen, Cambridge Univ. Press.
- [8] Lockman, F. J. 2002, ApJ, 580, L47.
- [9] Martin, E. R., York, D. G. 1982, ApJ, 257, 135.
- [10] Mebold, U., Winnberg, A., Kalberla, P. M. W., Goss, W. M. 1982, AA, 115, 223.
- [11] McKee, C. F., Ostriker, J. P. 1977, ApJ, 218, 418.
- [12] Mohan, R. 2003, Ph. D. Thesis, Jawaharlal Nehru University, New Delhi.
- [13] Mohan, R., Dwarakanath, K. S., Srinivasan, G. 2004a, JAA (accepted)
- [14] Mohan, R., Dwarakanath, K. S., Srinivasan, G. 2004b, JAA (accepted)
- [15] Radhakrishnan, V., Goss, W. M., Murray, J. D., & Brooks, J. W. 1972, ApJS, 24, 49.
- [16] Radhakrishnan, V., Srinivasan, G. 1980, JAA, 1, 47.
- [17] Rajagopal, J., Srinivasan, G., Dwarakanath, K. S. 1998, JAA, 19, 117.
- [18] Routly, P. M., Spitzer, L. 1952, ApJ, 115, 227.
- [19] Siluk, R. S., Silk, J. 1974, ApJ, 192, 51.
- [20] Spitzer, L. 1978, Physical Processes in the Interstellar Medium, John Wiley.
- [21] Wolfire, M. G., Hollenbach, D., McKee, C. F., Tielens, A. G. G. M., & Bakes, E. L. O. 1995, ApJ, 443, 152.